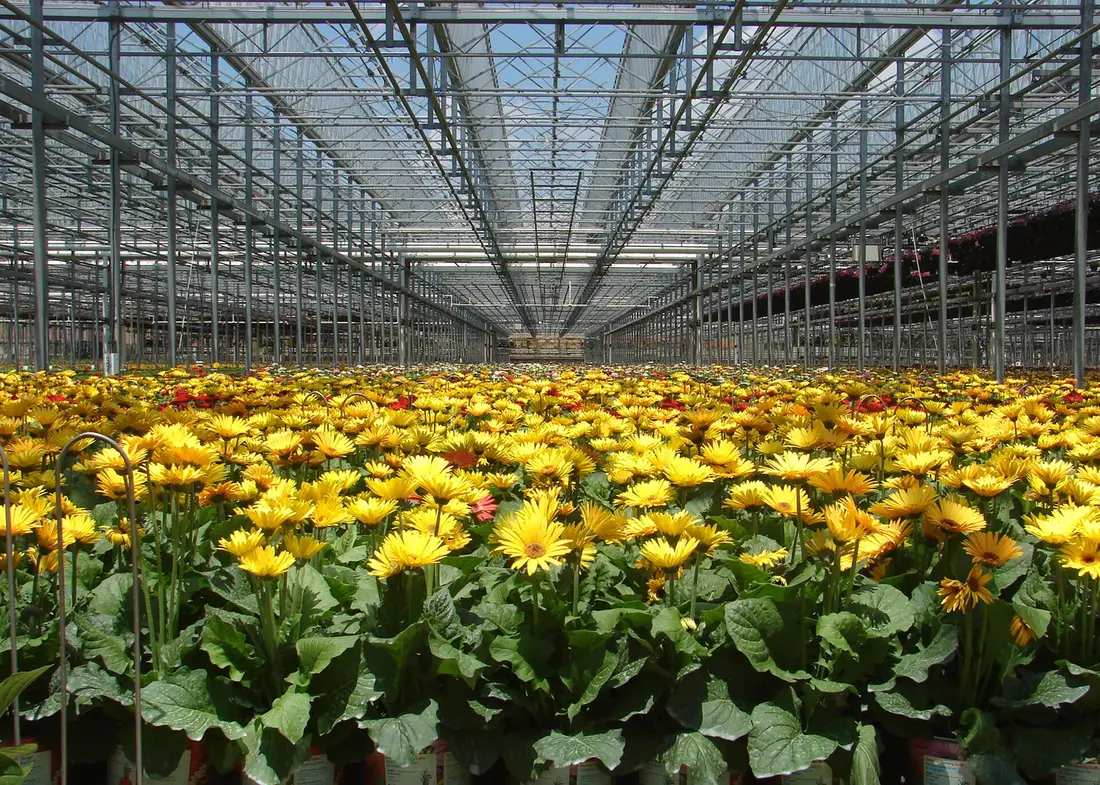
MARKET DOSSIER
United States
UNITED STATES OF AMERICA
Row crops, permanent plantings and specialty produce on a shrinking water budget.
What hydro-retention changes for irrigated acres.
Foreword
This dossier describes the United States from the angle of irrigation water, climate, fertilisers and crops. It is intended for the authorities responsible for agriculture and water, and for the economic players of the sector. It answers three questions: Where is irrigation water used, for which crops, and with what reserves? It then examines what our products can change, and what that may be worth, for the country, for each of the ten farm production regions and for each state.
The dossier rests on the 2023 Irrigation and Water Management Survey of the US Department of Agriculture. For every state, it gives the water applied to each crop, its source, the irrigation methods, the price of purchased water and the energy spent on pumping.
Reading the sources. Every figure refers to a source, named in the text and detailed in Annex A. Each source carries a confidence level:
What this dossier does not do. It does not turn a trial carried out elsewhere into an American result. Water savings and yield gains by crop are scenarios, built from the trials cited.
What remains to be completed. Some figures of the survey are withheld to protect individual farms. Section 12 gives the details.
Summary
The seven points below summarise the dossier. The key figures come from public sources (USDA, US Geological Survey, FAO, World Bank, PVGIS). Water savings are scenarios, described in Annex B.
80.9 M af Of irrigation water applied on farms in 2023 (99.8 bn m³), on 53.1 million acres (USDA). | 54% Of this water is pumped from wells. Several major aquifers are falling, the High Plains (Ogallala) aquifer first. | 10.7 M af Of water saved per year in the central scenario (13.2 bn m³), 13% of irrigation water. |
$7.8 bn Of annual value in the central scenario: Water saved at $94 per acre-foot and yield gain. | $172 bn Of agricultural exports in 2024, for $212 bn of imports (FAOSTAT). | $14.3 bn Of indicative spending on mineral fertilisers in 2024, lower bound, for 11.4 million tonnes of nitrogen. |
Key figures
Key indicators for the United States
Indicator | Value | Year | Source (level) |
|---|---|---|---|
Irrigation water applied on farms | 80,937,415 acre-feet (99.8 bn m³) | 2023 | USDA IWMS (A6, A) |
Irrigated acres (in the open) | 53,076,539 acres (21.5 M ha) | 2023 | USDA IWMS (A6, A) |
Water per irrigated acre | 1.5 acre-feet | 2023 | USDA IWMS (A6, A) |
Share pumped from wells | 54% | 2023 | USDA IWMS (A6, A) |
Solar radiation (20 farm stations) | 1,381 to 2,136 kWh/m²/year | 2005–2020 | PVGIS (A11, A) |
Rainfall (20 farm stations) | 249 to 1,297 mm/year | 1991–2020 | ERA5-Land (A12, B) |
Nitrogen used | 11.43 million tonnes | 2024 | FAOSTAT (A5, A) |
Potential water saving (central) | 10.67 million acre-feet per year | Scenario | Calculation (Annex B) |
Source: See the « Source » column; levels explained in the foreword.
1. Green Solutions and our products
Green Solutions develops products for water, fertilisation and crop protection. Four families concern this dossier. The performance figures quoted are those published by the manufacturer or by the trials, with their confidence level.
Products concerned by this dossier
Product | Claimed use | Published evidence | Level |
|---|---|---|---|
EVERGREEN® (water retainer) | Holds rain or irrigation water as a gel, close to the roots | Trials on maize, potato, watermelon, date palm, soybean (sections 8 and 9) | B to C |
ECOSORB® (water retainer based on maize starch) | Same use; effect lasts 2 to 3 years according to the website | Soybean trial (China); laboratory acrylamide analysis | B to C |
ECOFERT® (fertiliser) | Fertiliser certified by SOHISCERT and EU Organic | Published certificate; potato trial combined with EVERGREEN | A (certificate), C (results) |
Paulownia ALTIFOLIA® | Fast-growing tree for agroforestry | Website figures; no trial in the United States | C |
Water Vital®, NAPEMA® | Outside the scope of this dossier | No independent source in the documents consulted | — |
Source: Green Solutions website (product sheets and published trials), Annex A, sources A20 to A26.
The products are designed for the situations this dossier describes: Irrigated crops in dry summers, sandy soils that drain fast, and farms that pump their water from falling aquifers. The indicative dose published on the website is 30 to 75 kg per hectare.
2. The United States in figures
The United States has about 341.8 million inhabitants (2025) and a gross domestic product of 30.8 trillion dollars (2025). Agriculture accounts for 0.9% of gross domestic product and 1.5% of jobs, but covers 46% of the land area. The 2022 Census of Agriculture counted 284,598 farms that irrigated 54,930,363 acres, against 58,013,907 acres in 2017.
National benchmarks
Indicator | Value | Year | Source |
|---|---|---|---|
Population | 341.8 million inhabitants | 2025 | World Bank (A1) |
Gross domestic product | 30,770 billion current US$ | 2025 | World Bank (A1) |
GDP per capita | 90,027 US$ | 2025 | World Bank (A1) |
Agricultural value added | 0.9% of GDP | 2021 | World Bank (A1) |
Agricultural employment | 1.5% of jobs | 2025 | World Bank (A1) |
Agricultural land | 46.1% of land area | 2024 | World Bank (A1) |
Farms that irrigate | 284,598 | 2022 | USDA Census of Agriculture (A6) |
Irrigated acres | 54,930,363 acres | 2022 | USDA Census of Agriculture (A6) |
Acres equipped for irrigation | 61,016,692 acres | 2022 | USDA Census of Agriculture (A6) |
Fertiliser used | 128 kg per hectare of arable land | 2024 | World Bank (A1) |
Total freshwater withdrawals | 444 bn m³, 40% for agriculture | 2022 | World Bank (A1) |
Withdrawals / internal resources | 15.8% | 2022 | World Bank (A1) |
Water stress (SDG 6.4.2) | 28.2% | 2022 | World Bank (A1) |
Internal water resources | 8,437 m³ per inhabitant per year | 2022 | World Bank (A1) |
Average precipitation | 715 mm per year | 2022 | World Bank (A1) |
Cereal yield | 8,414 kg/ha | 2024 | World Bank (A1) |
Food exports | 9.0% of merchandise exports | 2025 | World Bank (A1) |
Food imports | 6.7% of merchandise imports | 2025 | World Bank (A1) |
Source: World Bank, WDI database (A1); USDA, 2022 Census of Agriculture (A6).
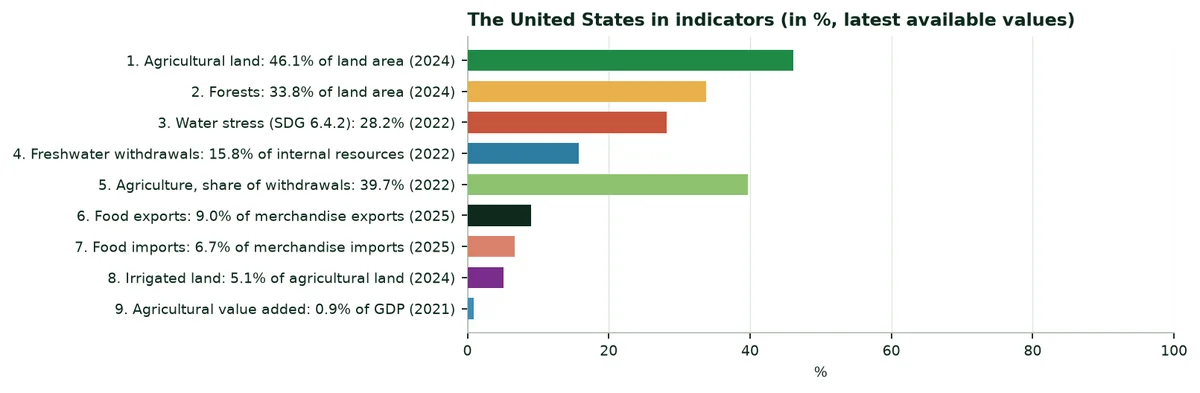
The World Bank counts 444 billion m³ of freshwater withdrawals in 2022, of which 40% for agriculture. This figure includes the water lost in canals before it reaches the fields, and the water for livestock. The USDA survey measures the water actually applied on farms: 99.8 billion m³ in 2023. The dossier uses the survey, which details the water by crop and by state.
3. Sunshine, rainfall and climate change
The dossier follows two farm stations in each of the ten regions: Twenty towns at the heart of irrigated areas, from Fresno in California to Albany in New York. The values describe these towns, not whole regions.
3.1 Sunshine
Horizontal solar radiation ranges from 1,381 kWh/m² per year at Albany (New York) to 2,136 kWh/m² at Phoenix (Arizona). The stronger the radiation, the more water the atmosphere draws from soils and plants.
Climate of the twenty farm stations
Station | Region | Radiation (kWh/m²/yr) | Rainfall (mm/yr) | Reference ET (mm/yr) | Summer deficit (mm) |
|---|---|---|---|---|---|
Phoenix, Arizona | Mountain | 2,136 | 249 | 1,966 | 680 |
Fresno, California | Pacific | 1,953 | 416 | 1,564 | 663 |
Boise, Idaho | Mountain | 1,649 | 318 | 1,310 | 588 |
Lubbock, Texas | Southern Plains | 2,008 | 449 | 1,781 | 524 |
Yakima, Washington | Pacific | 1,553 | 342 | 1,109 | 523 |
Weslaco, Texas | Southern Plains | 1,925 | 591 | 1,710 | 437 |
Garden City, Kansas | Northern Plains | 1,829 | 507 | 1,529 | 418 |
Grand Island, Nebraska | Northern Plains | 1,616 | 738 | 1,194 | 247 |
Stuttgart, Arkansas | Delta States | 1,706 | 1,245 | 1,250 | 243 |
Greenville, Mississippi | Delta States | 1,758 | 1,297 | 1,265 | 222 |
Springfield, Illinois | Corn Belt | 1,522 | 1,009 | 1,075 | 168 |
Harrisburg, Pennsylvania | Northeast | 1,459 | 1,064 | 983 | 144 |
Des Moines, Iowa | Corn Belt | 1,500 | 944 | 1,041 | 131 |
Stevens Point, Wisconsin | Lake States | 1,408 | 834 | 878 | 121 |
Saint Paul, Minnesota | Lake States | 1,397 | 834 | 917 | 120 |
Tifton, Georgia | Southeast | 1,819 | 1,048 | 1,339 | 119 |
Lexington, Kentucky | Appalachian | 1,533 | 1,214 | 1,029 | 115 |
Raleigh, North Carolina | Appalachian | 1,658 | 1,163 | 1,144 | 97 |
Albany, New York | Northeast | 1,381 | 1,116 | 875 | 84 |
Immokalee, Florida | Southeast | 1,887 | 1,185 | 1,447 | -179 |
Source: PVGIS 5.2 (A11), 2005–2020; ERA5-Land (A12), 1991–2020; calculation by the author. Summer deficit: June to August.
3.2 Rainfall and summer deficit
The United States receives on average 715 mm of rain per year (World Bank). At the farm stations, rainfall ranges from 249 mm at Phoenix to 1,297 mm at Greenville (1991–2020 average). For agriculture, the decisive figure is the summer gap: From June to August, the atmosphere demands far more water than the rain provides in the West and the Plains.
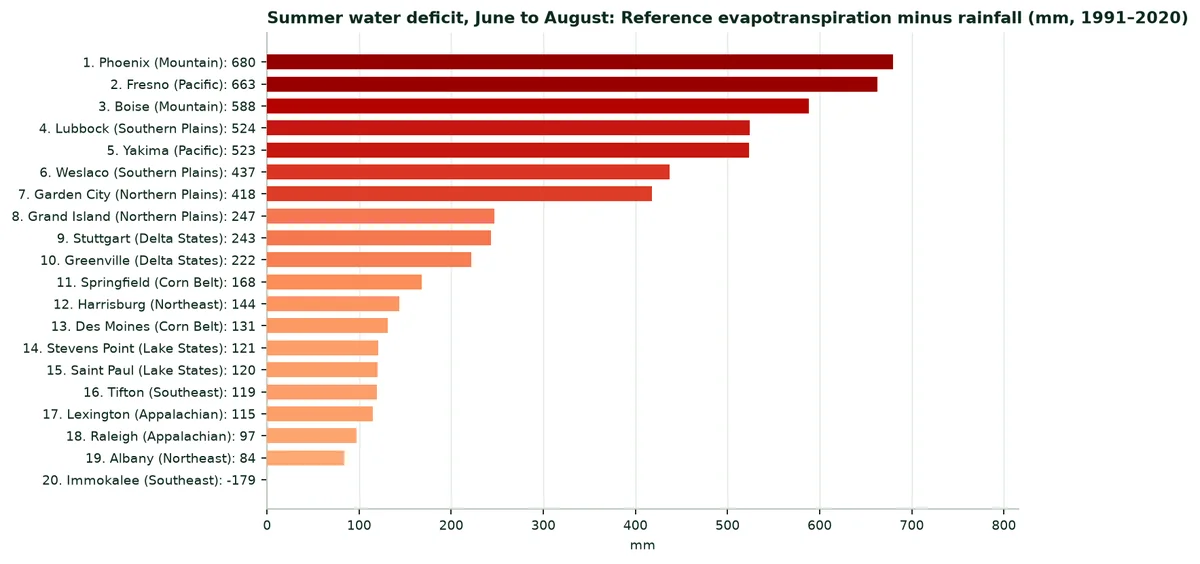
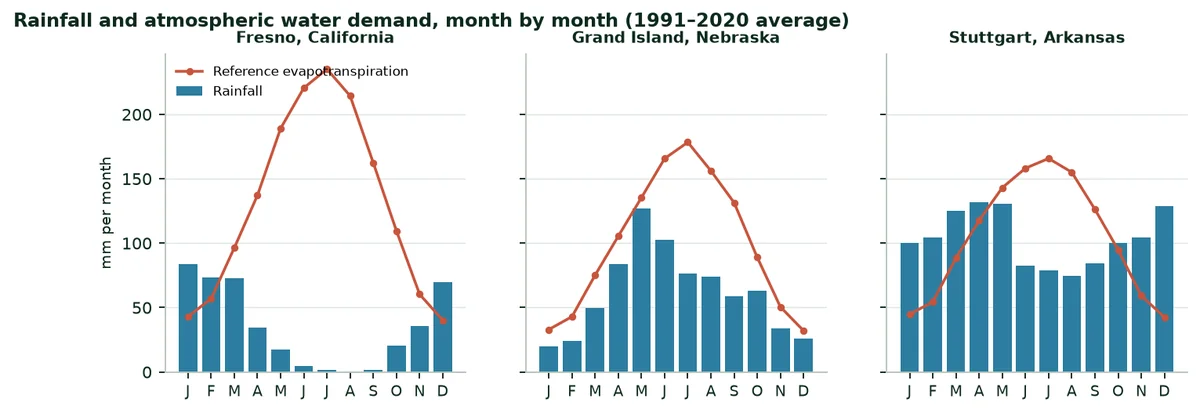
At Fresno, in the Central Valley of California, almost no rain falls from May to September, while the atmosphere demands more than 200 mm a month from June to August. At Grand Island, in Nebraska, summer storms cover part of the demand. At Stuttgart, in the Arkansas Delta, the rain is abundant but falls in winter and spring; the rice and soybeans still need irrigation in July and August. Keeping water in the soil, close to the roots, reduces the water each irrigation must bring.
3.3 Climate change, aquifers and rivers
The Fifth National Climate Assessment (2023) finds that the contiguous United States has warmed by 2.5 °F (1.4 °C) since 1970, faster than the world as a whole (1.7 °F). Hotter summers raise the water demand of crops and shorten the snowpack that fills western reservoirs.
What warming and overuse change for farm water
Effect | What is observed | Source (level) |
|---|---|---|
Temperature | +2.5 °F (1.4 °C) in the contiguous United States since 1970, against +1.7 °F worldwide | Fifth National Climate Assessment (A14, A) |
High Plains (Ogallala) aquifer | About 286 million acre-feet lost since 1950, about 10% of the recoverable water; declines up to 203 feet in some wells | US Geological Survey, 2023 (A9, A) |
Colorado River | First shortage declared for 2022 on the Lower Basin; Arizona loses 512,000 acre-feet a year, about 18% of its share | Bureau of Reclamation; Arizona Department of Water Resources (A10, A) |
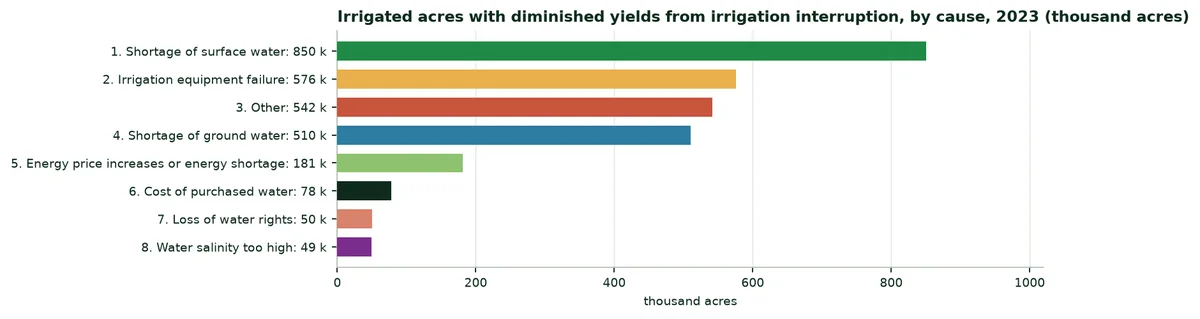
Irrigation interrupted | 2,022,246 acres with lower yields in 2023 because irrigation was interrupted, 850,172 of them by a shortage of surface water | USDA IWMS (A6, A) |
Source: See the « Source » column.
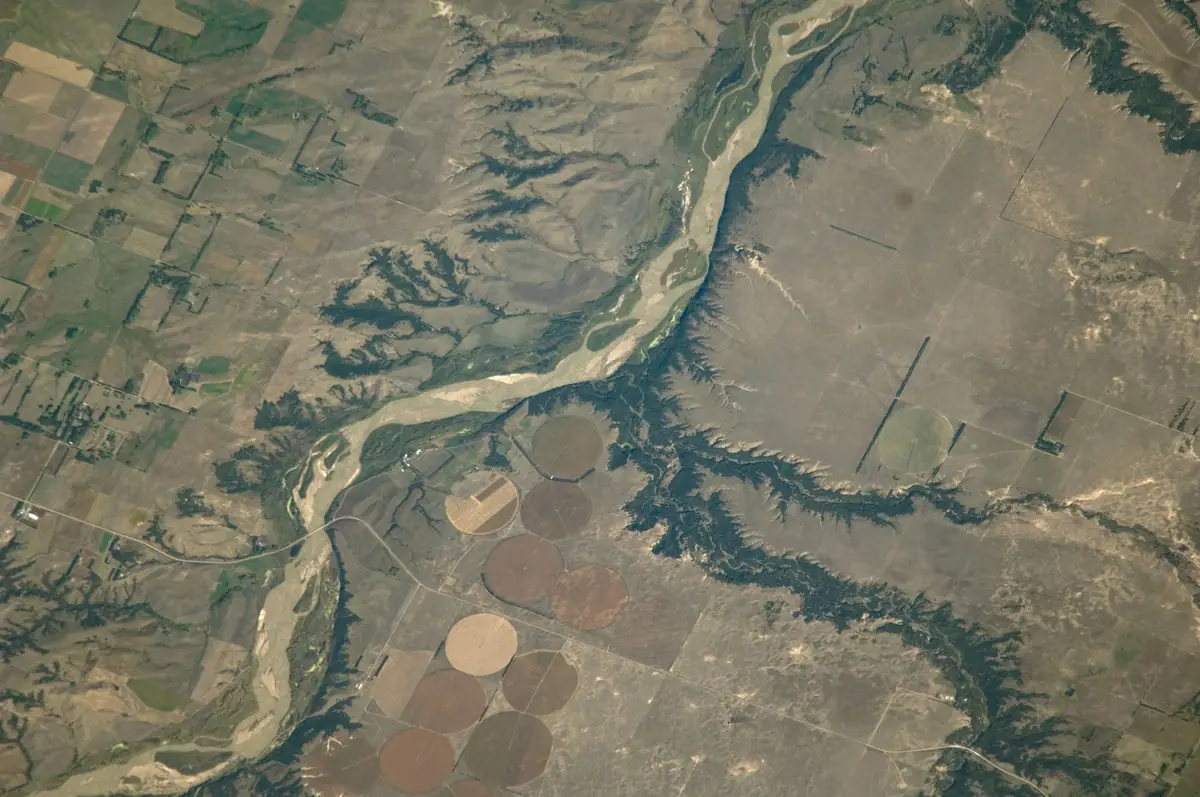
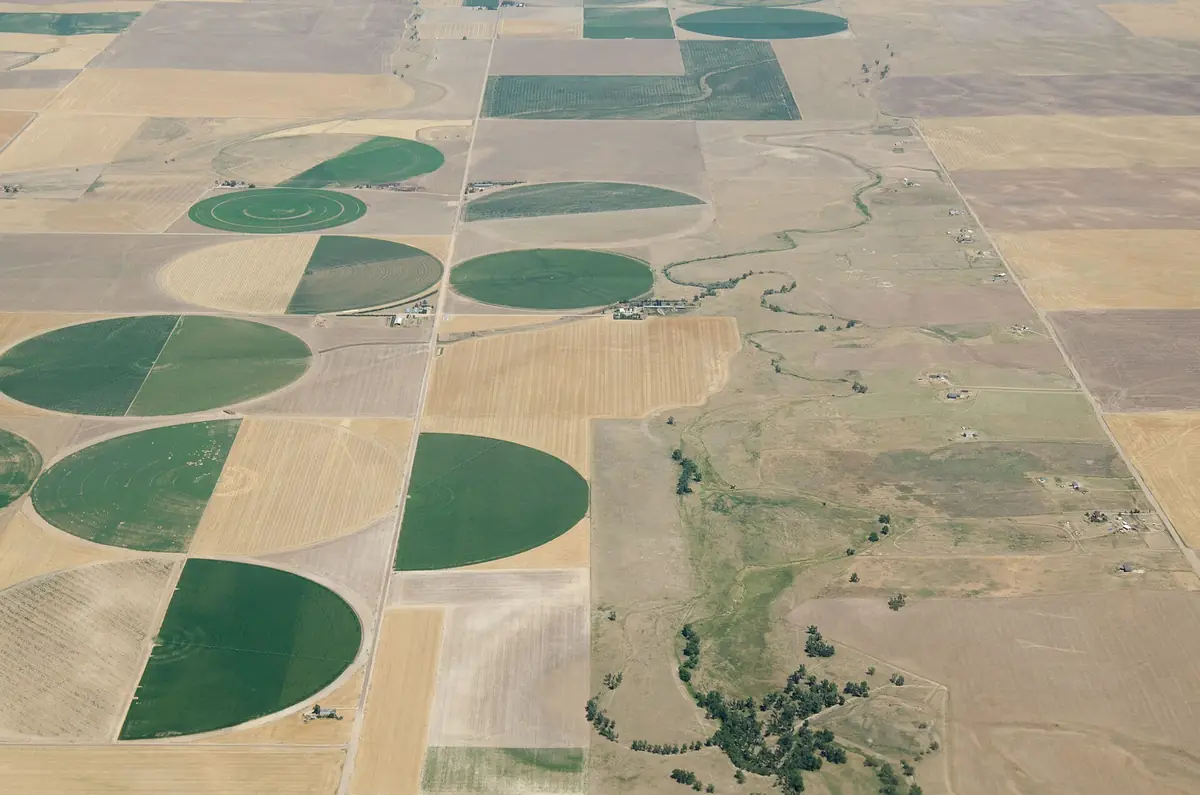
The High Plains aquifer lies under 111.8 million acres in eight states, from South Dakota to Texas. It supplies most of the irrigation of Nebraska, Kansas and the Texas High Plains. Where its water level falls, wells yield less and pumping costs more. Every acre-foot kept in the soil is an acre-foot left in the aquifer.
4. Irrigation water: Volumes, sources, methods, prices
4.1 Volumes applied, state by state
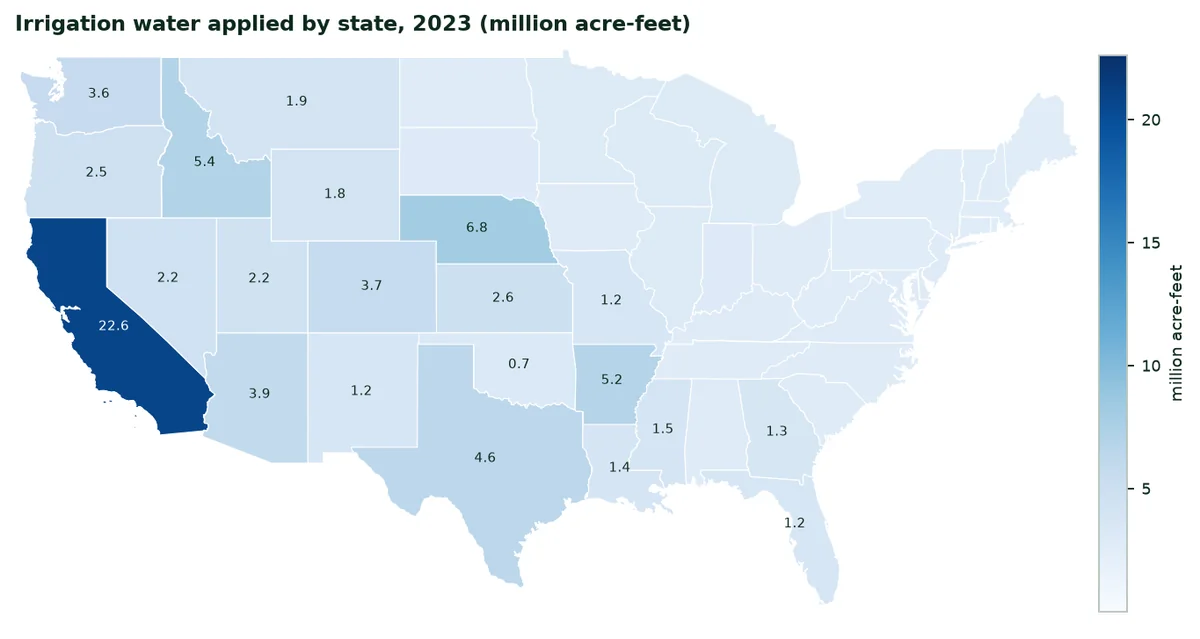
American farms applied 80,937,415 acre-feet of irrigation water in 2023, that is 99.8 billion m³, on 53,076,539 acres. California alone applied 22.6 million acre-feet, 28% of the national total. Nebraska, Idaho, Arkansas and Texas follow.
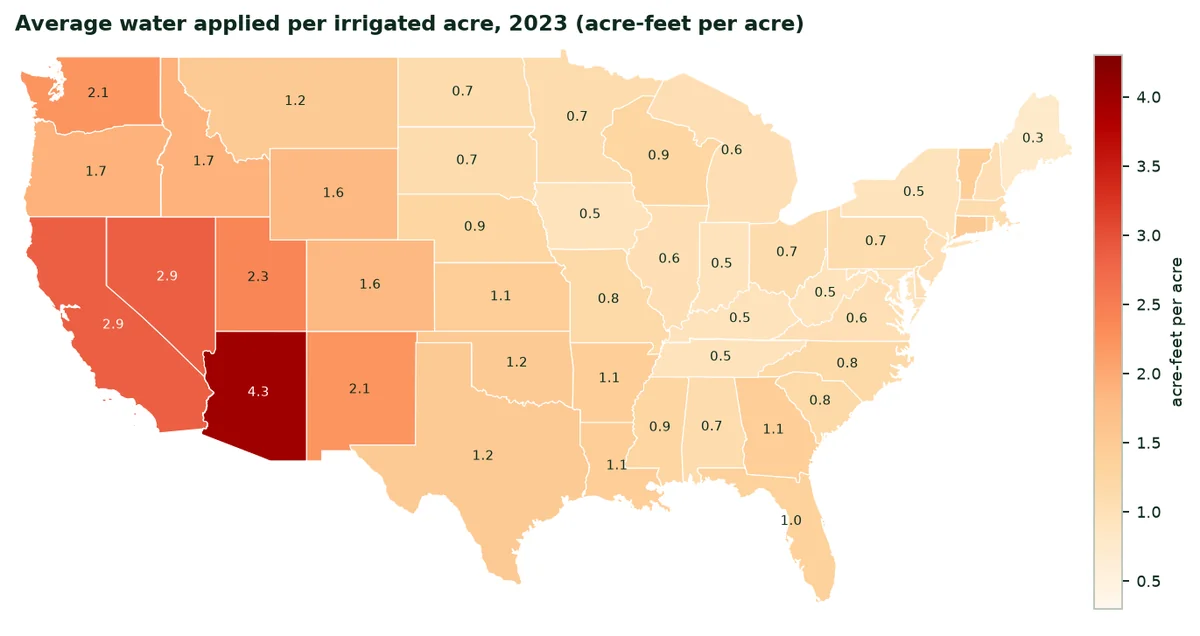
On average, each irrigated acre received 1.5 acre-feet. The figure ranges from less than one acre-foot in the humid East, where irrigation completes the rain, to 4.3 acre-feet in Arizona, where it replaces it.
The fifteen states that apply the most irrigation water, 2023
State | Region | Irrigated acres | Water (acre-feet) | Acre-feet per acre | Share of US water |
|---|---|---|---|---|---|
California | Pacific | 7,755,846 | 22,599,562 | 2.9 | 27.9% |
Nebraska | Northern Plains | 7,305,558 | 6,813,805 | 0.9 | 8.4% |
Idaho | Mountain | 3,180,644 | 5,406,523 | 1.7 | 6.7% |
Arkansas | Delta States | 4,645,925 | 5,165,689 | 1.1 | 6.4% |
Texas | Southern Plains | 3,720,978 | 4,599,571 | 1.2 | 5.7% |
Arizona | Mountain | 920,420 | 3,927,289 | 4.3 | 4.9% |
Colorado | Mountain | 2,367,382 | 3,740,814 | 1.6 | 4.6% |
Washington | Pacific | 1,704,878 | 3,636,947 | 2.1 | 4.5% |
Kansas | Northern Plains | 2,324,901 | 2,570,383 | 1.1 | 3.2% |
Oregon | Pacific | 1,445,030 | 2,478,499 | 1.7 | 3.1% |
Nevada | Mountain | 767,294 | 2,248,790 | 2.9 | 2.8% |
Utah | Mountain | 985,863 | 2,221,470 | 2.3 | 2.7% |
Montana | Mountain | 1,561,047 | 1,879,427 | 1.2 | 2.3% |
Wyoming | Mountain | 1,148,044 | 1,824,742 | 1.6 | 2.3% |
Mississippi | Delta States | 1,713,175 | 1,465,708 | 0.9 | 1.8% |
Source: USDA IWMS 2023 (A6).
4.2 Where the water comes from
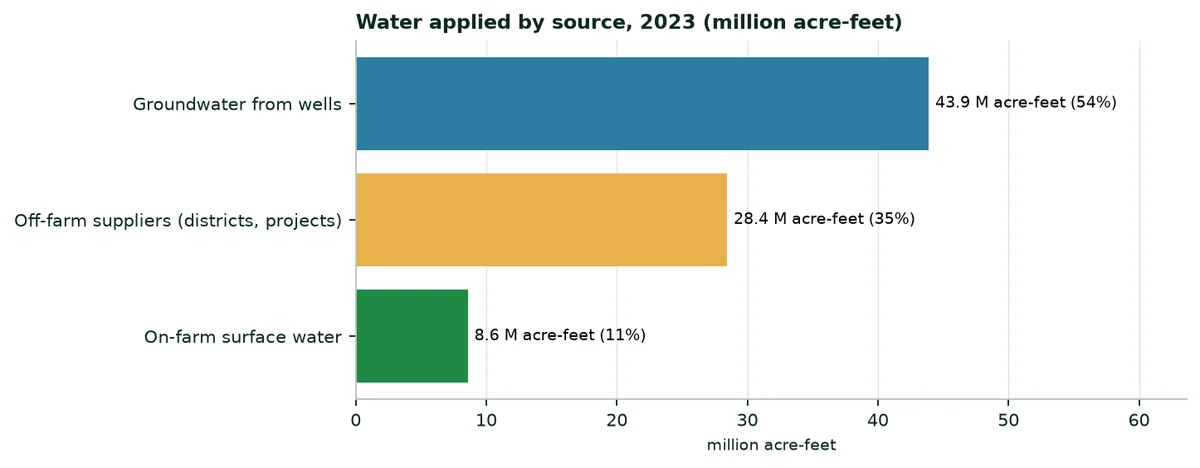
Wells supply 43.9 million acre-feet (54%). Irrigation districts, federal and state projects and other off-farm suppliers deliver 28.4 million, and farmers draw 8.6 million from their own streams, ponds and reservoirs. The West relies on snowmelt stored behind dams; the Plains and the Delta rely on aquifers.
4.3 Irrigation methods
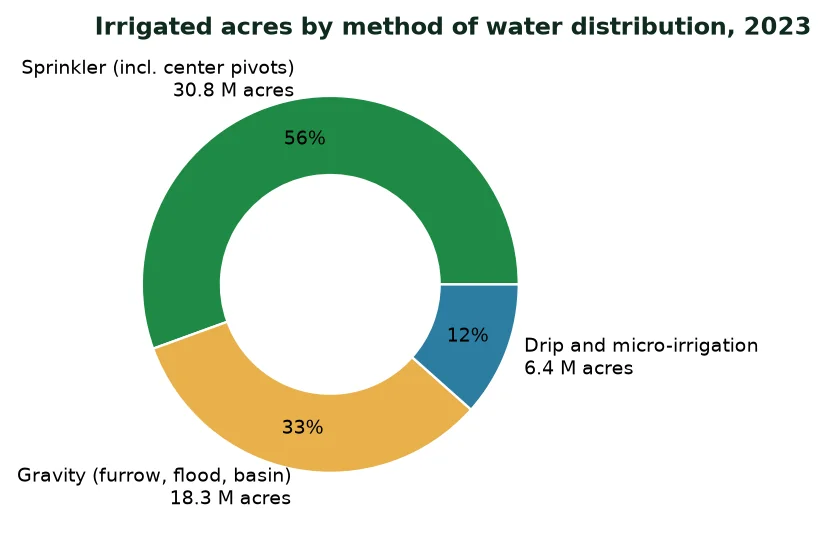
Sprinklers, mostly centre pivots, water 30.8 million acres. Gravity methods (furrows, flooding, basins) still water 18.3 million acres, mostly rice, alfalfa, pasture and cotton. Drip and micro-irrigation cover 6.4 million acres, mostly orchards, vineyards and vegetables. Our water retainers work with all three methods: They hold the water each pass brings, whatever the way it is applied.
4.4 Water resource regions
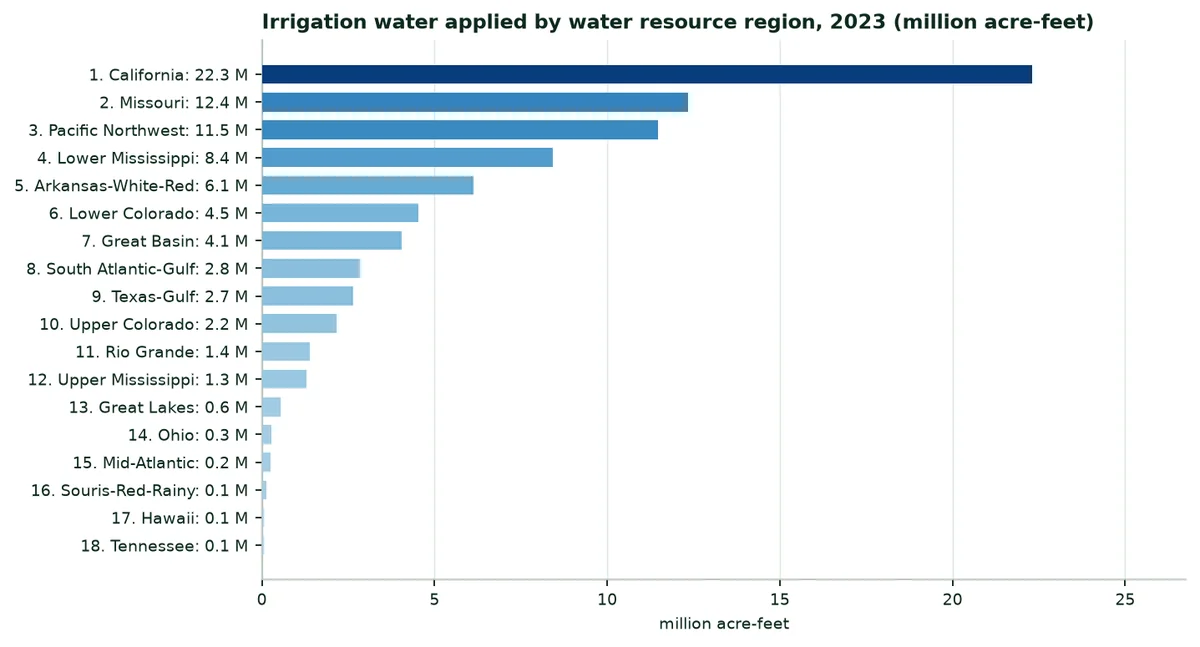
Hydrologists divide the country into water resource regions, which follow the large river basins. The California basin applies the most water, ahead of the Missouri basin (Nebraska, Kansas, the Dakotas, Montana, Wyoming, Colorado) and the Pacific Northwest (the Columbia and Snake basins).
4.5 The price of water
There is no single price of irrigation water. Farms that buy their water from a district or a project paid on average $54.22 per acre-foot in 2023, for a total of $1.14 billion. Farms that pump from wells pay the energy: $3.26 billion in 2023, of which $2.53 billion of electricity, for 608,288 pumps. Spread over all the water applied, the energy represents about $40 per acre-foot.
Price paid for off-farm water in the twelve states that buy the most
State | Off-farm water (acre-feet) | Share of the state's water | Average price ($ per acre-foot) |
|---|---|---|---|
California | 11,727,502 | 52% | 71.98 |
Idaho | 2,573,283 | 48% | 23.35 |
Washington | 2,332,172 | 64% | 49.89 |
Arizona | 1,841,784 | 47% | 37.57 |
Colorado | 1,826,481 | 49% | 24.12 |
Utah | 1,361,314 | 61% | 24.24 |
Wyoming | 1,244,337 | 68% | 18.32 |
Montana | 1,215,967 | 65% | 17.90 |
Nevada | 1,067,340 | 47% | 8.57 |
Oregon | 1,047,744 | 42% | 37.67 |
Texas | 643,238 | 14% | 91.47 |
New Mexico | 494,314 | 41% | 24.91 |
Source: USDA IWMS 2023 (A6), table 18.
To value the water saved, the dossier therefore uses three reference values: $54.22 per acre-foot (the average price of purchased water), $94.48 (the same price plus the pumping energy per acre-foot) and $150 (a high value, for the dry years and the basins where water is scarce). These are assumptions, not the actual cost of each farm.
4.6 Interrupted irrigation
In 2023, 2,022,246 irrigated acres had lower yields because irrigation was interrupted. A shortage of surface water was the first cause (850,172 acres), ahead of equipment failures and a shortage of groundwater (510,222 acres). Water kept in the soil gives crops a reserve when a delivery is cut or a well runs short.
5. Fertilisers: Quantities, prices, spending
5.1 Quantities used
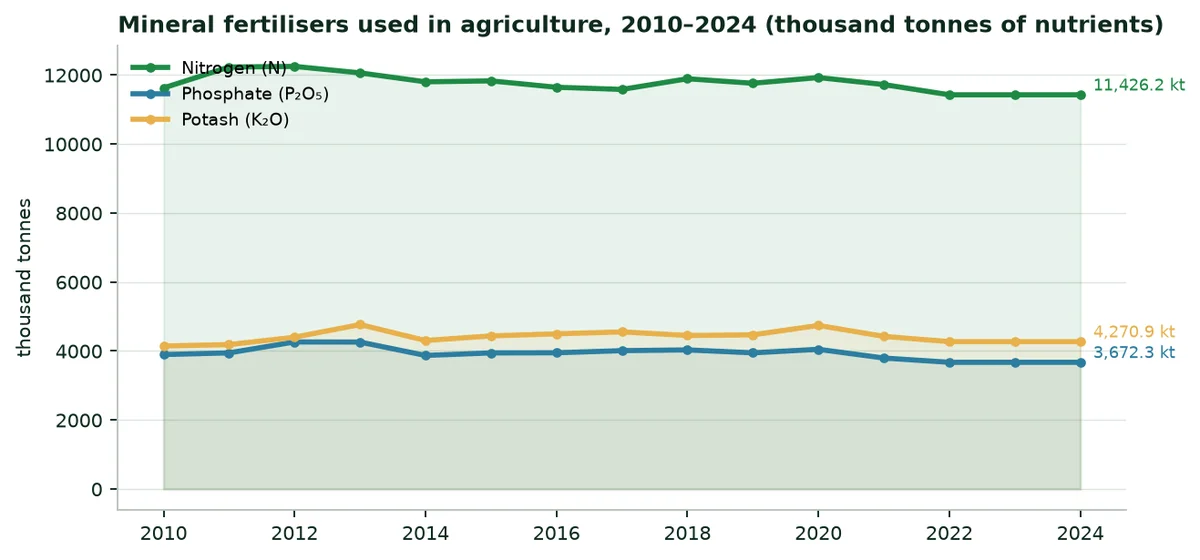
American agriculture used 11.43 million tonnes of nitrogen (N), 3.67 million tonnes of phosphate (P₂O₅) and 4.27 million tonnes of potash (K₂O) in 2024 (FAOSTAT). Corn takes the largest share of the nitrogen.
Fertilisers used, in tonnes of nutrients
Year | Nitrogen (N) | Phosphate (P₂O₅) | Potash (K₂O) |
|---|---|---|---|
2018 | 11,891,321 | 4,031,751 | 4,449,351 |
2019 | 11,760,172 | 3,946,337 | 4,468,817 |
2020 | 11,925,954 | 4,048,614 | 4,741,245 |
2021 | 11,722,823 | 3,796,003 | 4,423,220 |
2022 | 11,426,152 | 3,672,282 | 4,270,921 |
2023 | 11,426,152 | 3,672,282 | 4,270,921 |
2024 | 11,426,152 | 3,672,282 | 4,270,921 |
Source: FAOSTAT (A5).
5.2 Prices
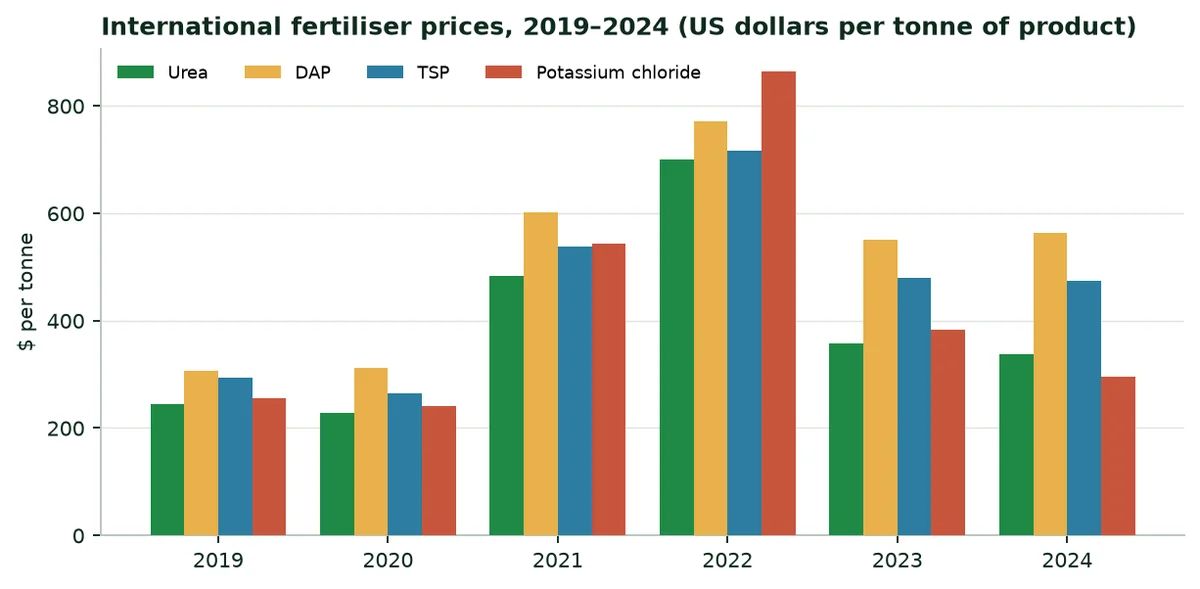
International fertiliser prices doubled in 2021–2022, then fell back. In 2024, urea was worth 338 dollars a tonne and potassium chloride 295 dollars. The prices paid by farmers, with transport and margins, are higher.
5.3 Indicative spending
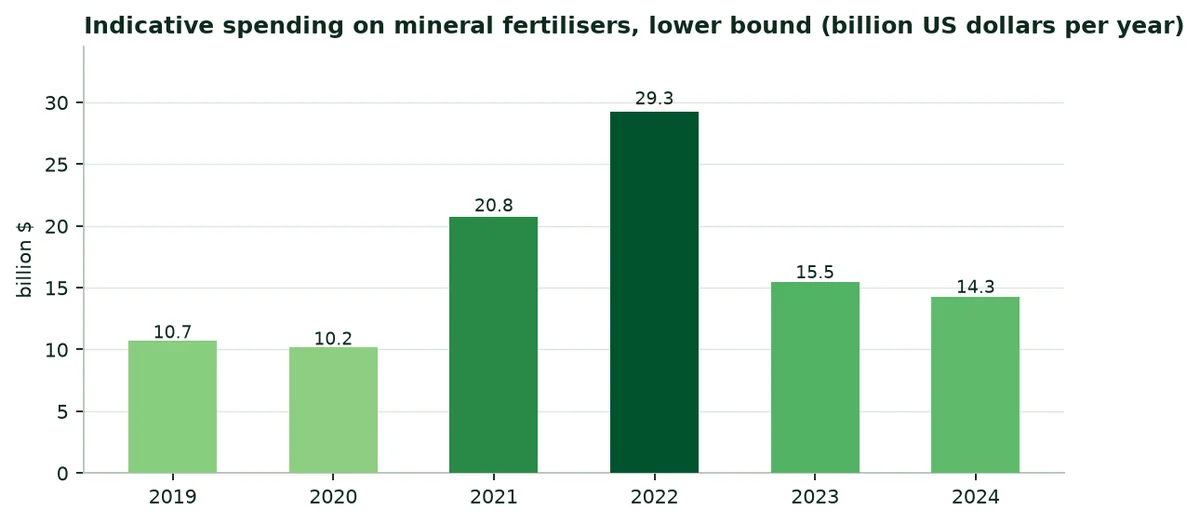
Converted into urea, triple superphosphate and potassium chloride, the nutrients used represent spending of at least 14.3 billion dollars in 2024, and 29.3 billion in 2022, the year of the price peak. Nutrients washed below the roots by irrigation or heavy rain are lost to the crop; a water retainer that holds the water in the root zone also holds the nutrients dissolved in it.
6. The ten regions at a glance
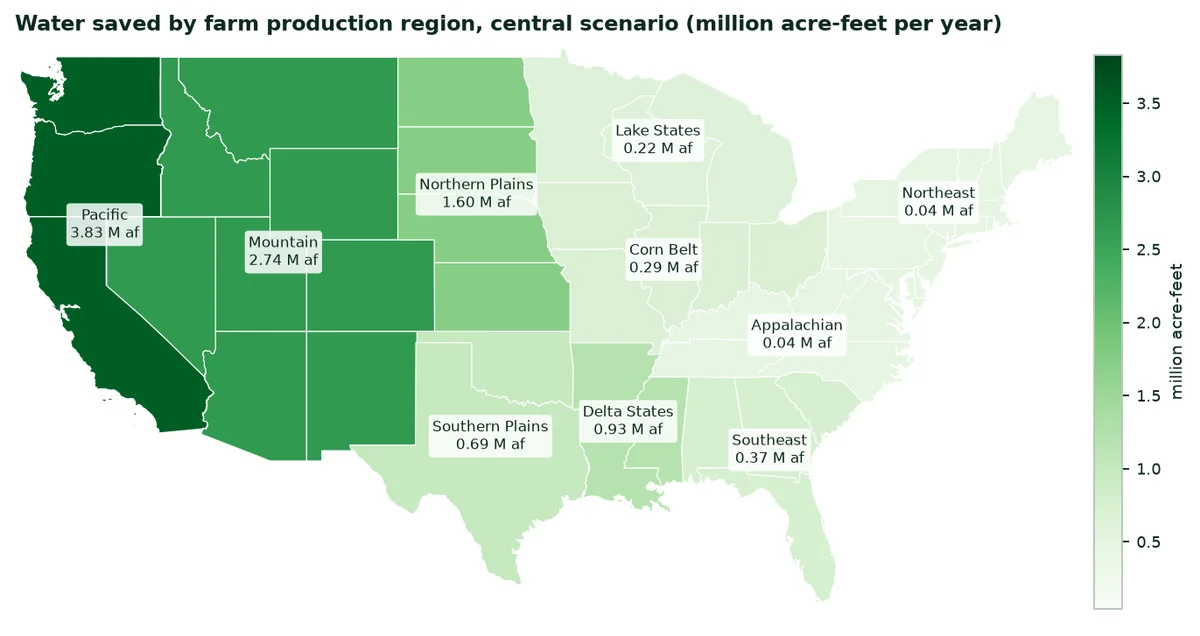
The US Department of Agriculture groups the states into ten farm production regions. The dossier follows them: Each region brings together states with similar climates and crops. Alaska and Hawaii, very small irrigators, are counted in the Pacific region.
Acres, water and central saving by region
Region | States | Irrigated (M acres) | Water (M af) | Af per acre | From wells | Summer deficit (mm) | Central saving (M af/yr) |
|---|---|---|---|---|---|---|---|
Pacific | 5 | 10.91 | 28.77 | 2.6 | 37% | 593 | 3.83 |
Mountain | 8 | 11.51 | 22.46 | 2.0 | 32% | 634 | 2.74 |
Northern Plains | 4 | 10.26 | 9.81 | 1.0 | 94% | 332 | 1.60 |
Southern Plains | 2 | 4.26 | 5.26 | 1.2 | 84% | 480 | 0.69 |
Corn Belt | 5 | 3.04 | 2.07 | 0.7 | 95% | 150 | 0.29 |
Lake States | 3 | 1.78 | 1.25 | 0.7 | 85% | 120 | 0.22 |
Delta States | 3 | 7.66 | 8.03 | 1.0 | 89% | 232 | 0.93 |
Southeast | 4 | 2.36 | 2.74 | 1.1 | 73% | -30 | 0.37 |
Appalachian | 5 | 0.41 | 0.28 | 0.6 | 57% | 106 | 0.04 |
Northeast | 11 | 0.15 | 0.26 | 0.6 | 70% | 114 | 0.04 |
Source: USDA IWMS 2023 (A6); ERA5-Land (A12), average of the two stations; calculation by the author (Annex B). Acres and acre-feet per acre: States with published acres only.
7. The twenty main crops: Three rankings
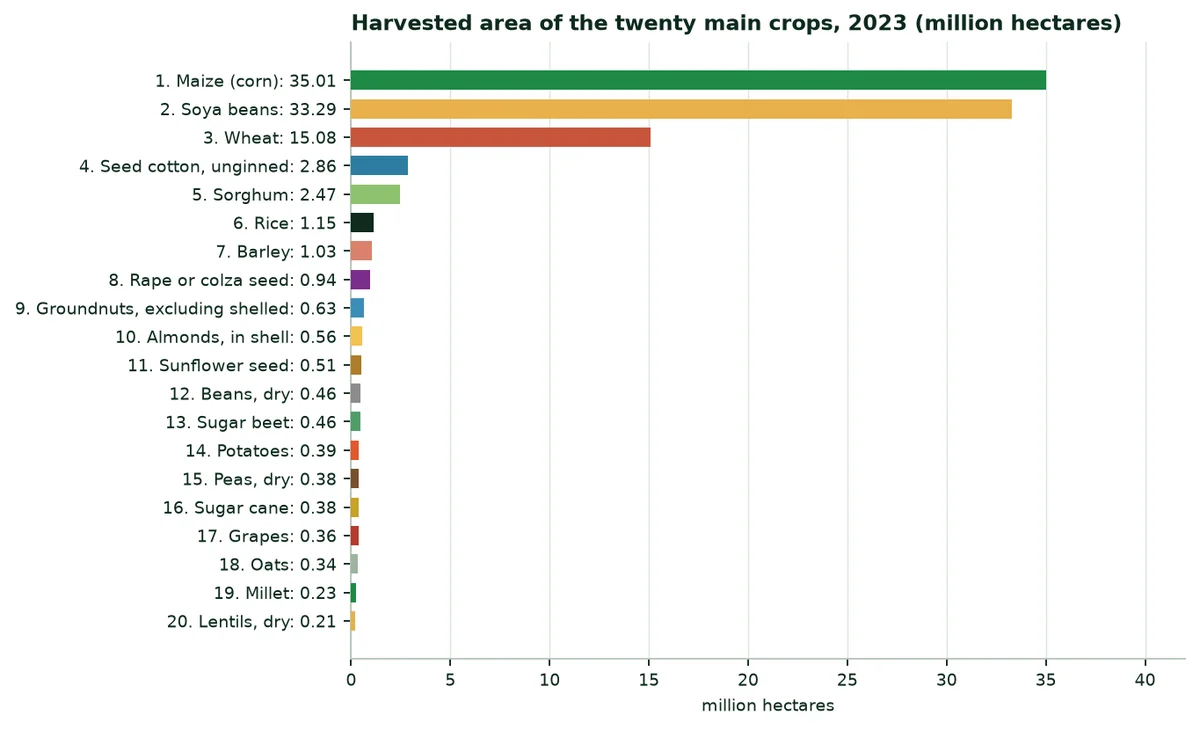
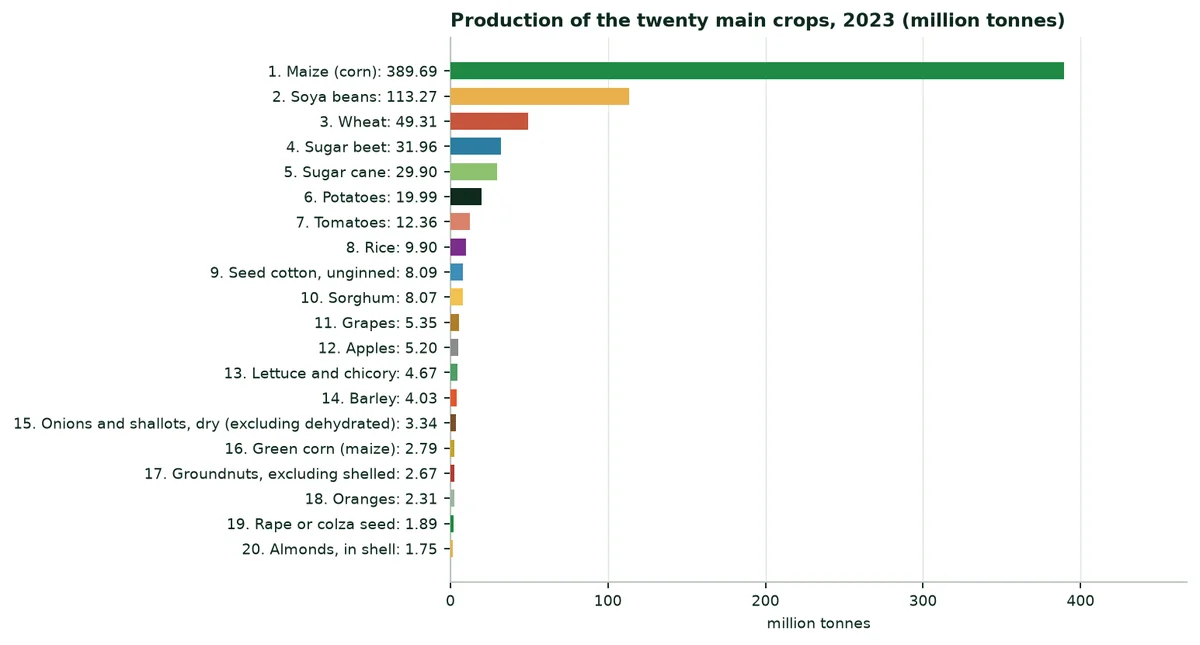
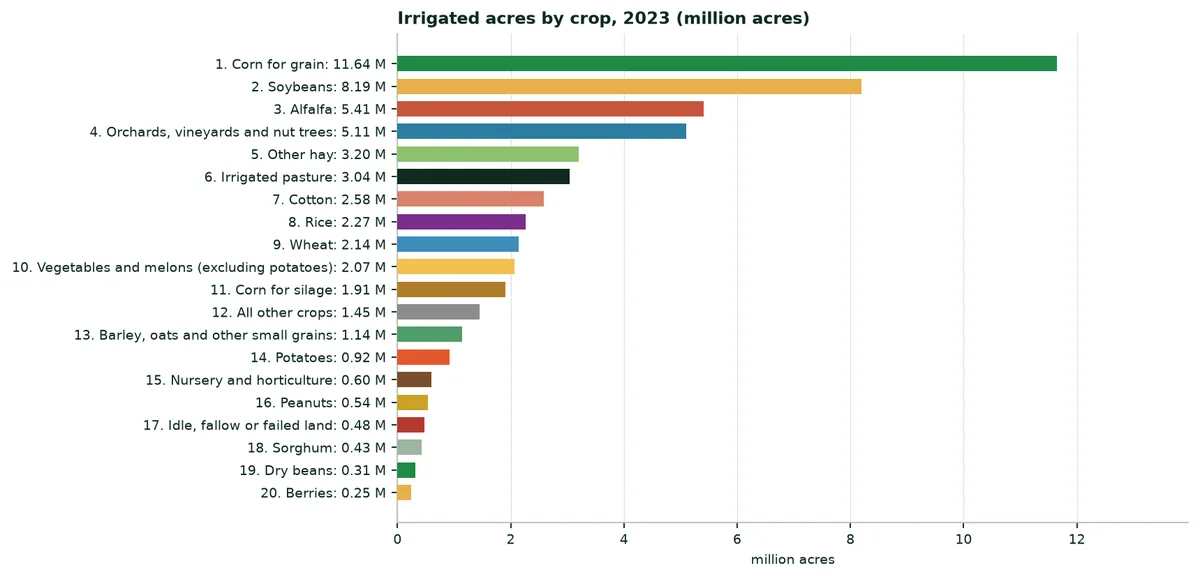
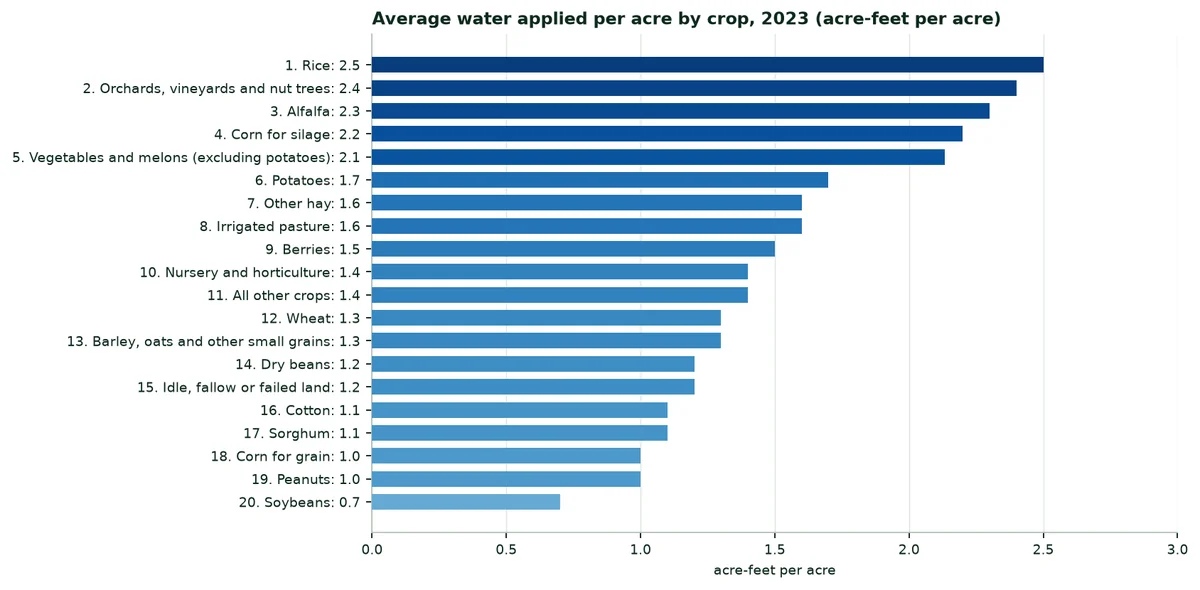
Three rankings complement each other: Area, production and value. Corn and soybeans cover by far the largest areas, mostly without irrigation in the Corn Belt. Irrigation weighs most on alfalfa, orchards and nut trees, vegetables, rice, cotton and the corn of the Plains.
7.1 By area
Twenty main crops by harvested area (2023)
Rank | Crop | Area (ha) | Production (t) | Yield (t/ha) |
|---|---|---|---|---|
1 | Maize (corn) | 35,010,950 | 389,694,460 | 11.1 |
2 | Soya beans | 33,294,250 | 113,272,630 | 3.4 |
3 | Wheat | 15,083,610 | 49,313,930 | 3.3 |
4 | Seed cotton, unginned | 2,858,970 | 8,094,429 | 2.8 |
5 | Sorghum | 2,474,680 | 8,071,090 | 3.3 |
6 | Rice | 1,154,990 | 9,901,510 | 8.6 |
7 | Barley | 1,033,980 | 4,028,680 | 3.9 |
8 | Rape or colza seed | 942,650 | 1,894,950 | 2.0 |
9 | Groundnuts, excluding shelled | 630,100 | 2,666,020 | 4.2 |
10 | Almonds, in shell | 558,472 | 1,751,770 | 3.1 |
11 | Sunflower seed | 511,330 | 1,024,070 | 2.0 |
12 | Beans, dry | 460,580 | 1,070,843 | 2.3 |
13 | Sugar beet | 456,210 | 31,956,490 | 70.0 |
14 | Potatoes | 388,580 | 19,992,090 | 51.4 |
15 | Peas, dry | 377,580 | 814,060 | 2.2 |
16 | Sugar cane | 376,970 | 29,897,180 | 79.3 |
17 | Grapes | 360,579 | 5,351,940 | 14.8 |
18 | Oats | 336,300 | 828,010 | 2.5 |
19 | Millet | 231,480 | 443,890 | 1.9 |
20 | Lentils, dry | 211,650 | 258,410 | 1.2 |
Source: FAOSTAT, crop production 2023 (A2); aggregates excluded.
7.2 By production
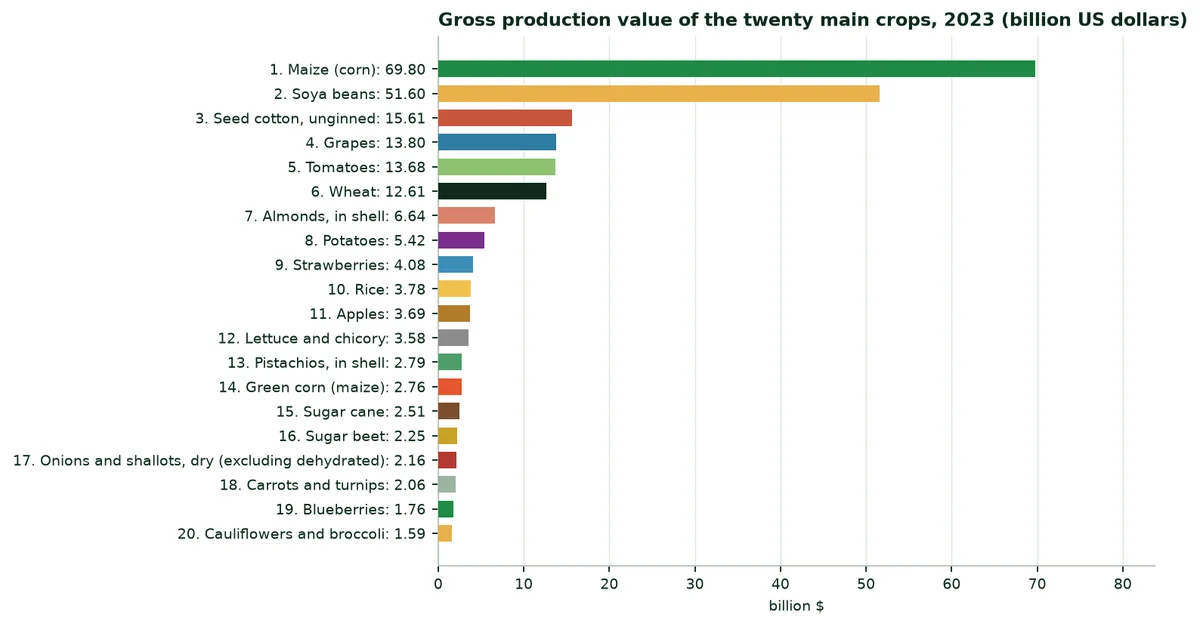
7.3 By value of production
7.4 Irrigated crops
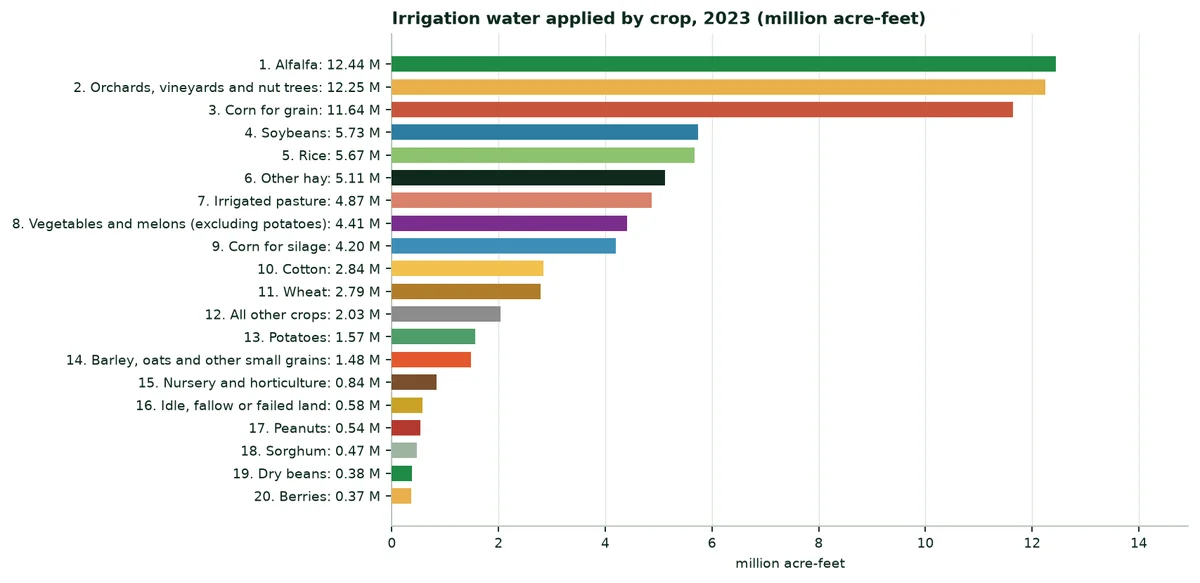
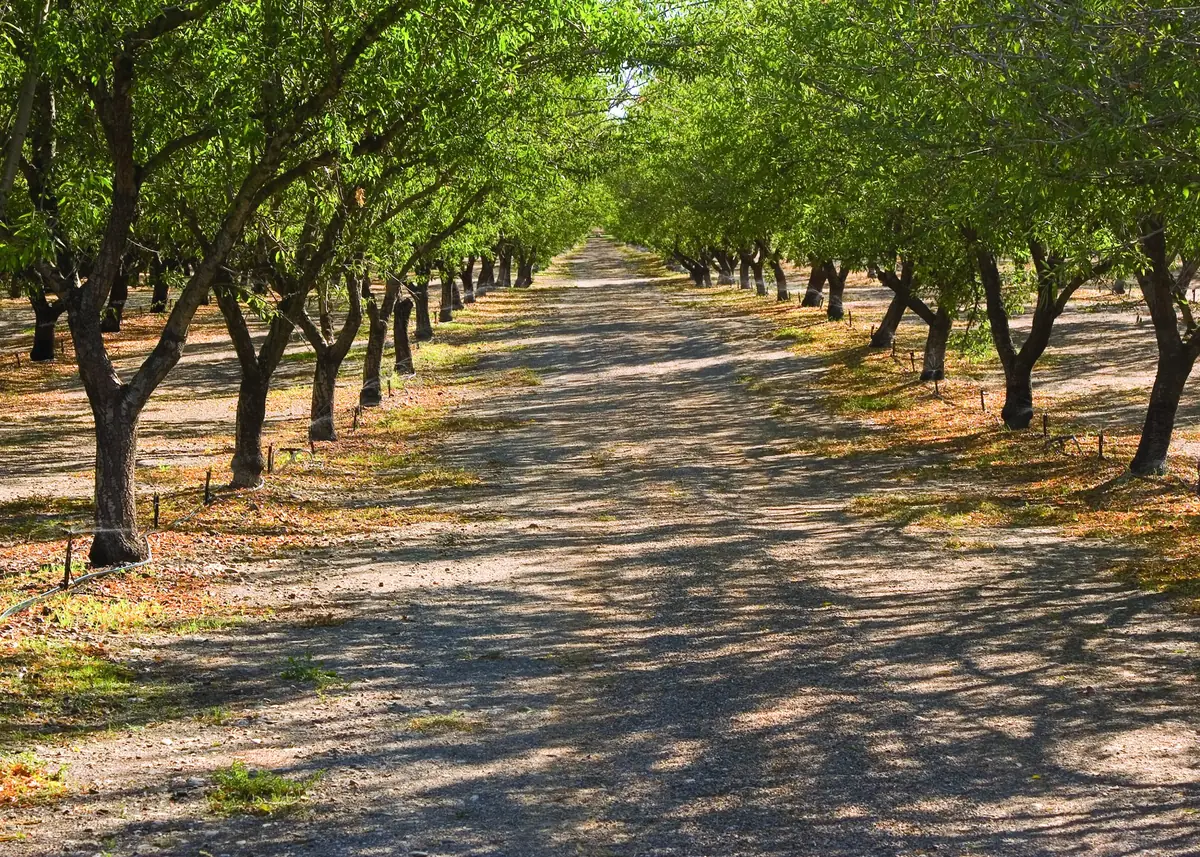
The irrigation survey ranks the crops by the water they receive. Alfalfa (12.4 million acre-feet), orchards, vineyards and nut trees (12.3 million) and corn for grain (11.6 million) together receive nearly half of the water.
8. Extrapolation by crop and water savings
8.1 Method
8.2 Trials used as analogues
Trials cited and their use in the calculation
Trial | Water saving published | Yield gain published | Use in this dossier | Level |
|---|---|---|---|---|
Maize, Turkey (TIGEM, 2025) | −39% | +17.1% | Corn for grain (water and yield), corn for silage (water) | C |
Potato, South Africa (2025–2026) | −52% | +31.4% | Potatoes | C |
Watermelon, Mexico (2023) | −60.5% | +30% | Vegetables and melons | C |
Soybean, China (Shandong) | Not measured | +11.2 to 11.4% | Yield of soybeans, wheat, small grains, peanuts, sorghum and dry beans | B |
Date palm, United Arab Emirates (ICBA, 2020–2021) | −82% | +20% | Not used (few date palms in the United States) | B |
Source: Trials published on the Green Solutions website (A20 to A24).
8.3 Parameters by crop
Water saving used by scenario (cautious / central / strong)
Crop | Analogue | Water |
|---|---|---|
Alfalfa | Generic assumption | 5% / 10% / 20% |
Orchards, vineyards and nut trees | Generic assumption | 5% / 10% / 20% |
Corn for grain | Maize, Turkey | 9.8% / 19.5% / 39% |
Soybeans | Water: Generic assumption; yield: Soybean, China | 5% / 10% / 20% |
Rice | Generic assumption | 5% / 10% / 20% |
Other hay | Generic assumption | 5% / 10% / 20% |
Irrigated pasture | Generic assumption | 5% / 10% / 20% |
Vegetables and melons (excluding potatoes) | Watermelon, Mexico | 15.1% / 30.2% / 60.5% |
Corn for silage | Water: Maize, Turkey; yield not counted | 9.8% / 19.5% / 39% |
Cotton | Generic assumption | 5% / 10% / 20% |
Wheat | Water: Generic assumption; yield: Soybean, China | 5% / 10% / 20% |
All other crops | Generic assumption | 5% / 10% / 20% |
Potatoes | Potato, South Africa | 13% / 26% / 52% |
Barley, oats and other small grains | Water: Generic assumption; yield: Soybean, China | 5% / 10% / 20% |
Nursery and horticulture | Generic assumption | 5% / 10% / 20% |
Idle, fallow or failed land | Generic assumption | 5% / 10% / 20% |
Peanuts | Water: Generic assumption; yield: Soybean, China | 5% / 10% / 20% |
Sorghum | Water: Generic assumption; yield: Soybean, China | 5% / 10% / 20% |
Dry beans | Water: Generic assumption; yield: Soybean, China | 5% / 10% / 20% |
Berries | Generic assumption | 5% / 10% / 20% |
Source: Calculation by the author (Annex B).
8.4 National results
10.7 M af Of water saved per year in the central scenario (13% of irrigation water). | 5.3 to 21.3 Million acre-feet per year, from the cautious to the strong scenario. | 13.1 Mt Of extra production in the central scenario (corn, potatoes, vegetables, soybeans, small grains). |
Water saving and value per year, by scenario and value of water
Scenario | Water saved (M af/yr) | Water saved (bn m³/yr) | Water at $54 (M$) | Water at $94 (M$) | Water at $150 (M$) | Yield (M$) |
|---|---|---|---|---|---|---|
Cautious | 5.34 | 6.58 | 289 | 504 | 800 | 3,400 |
Central | 10.67 | 13.16 | 579 | 1,008 | 1,601 | 6,800 |
Strong | 21.34 | 26.32 | 1,157 | 2,016 | 3,201 | 13,600 |
Source: Calculation by the author (Annex B).
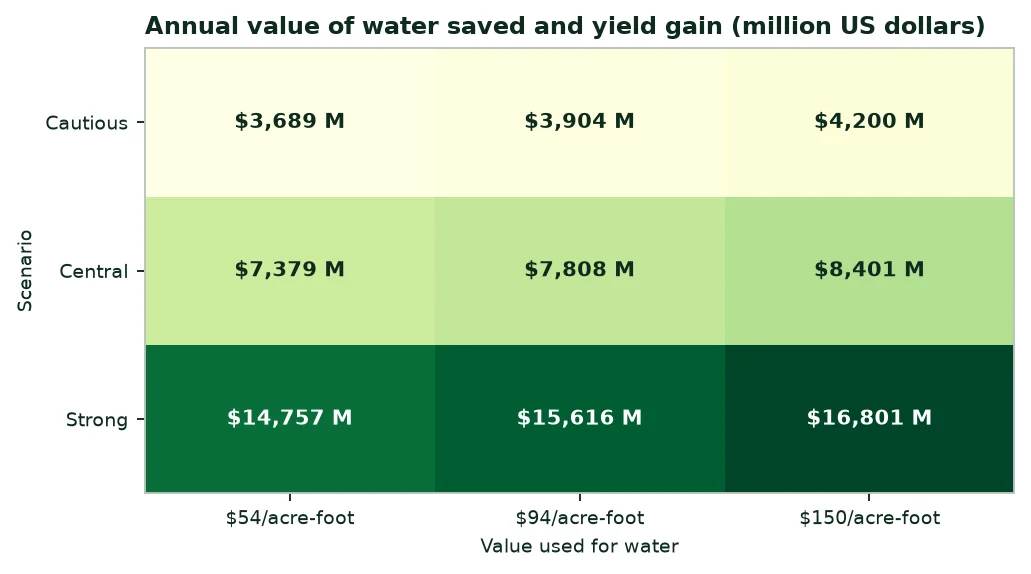
In the central scenario, the total value reaches about 7.8 billion dollars per year: 1.0 billion for the water at $94 per acre-foot, and 6.8 billion for the yield gain. The yield gain weighs more than the water, because purchased water remains cheap in most states.
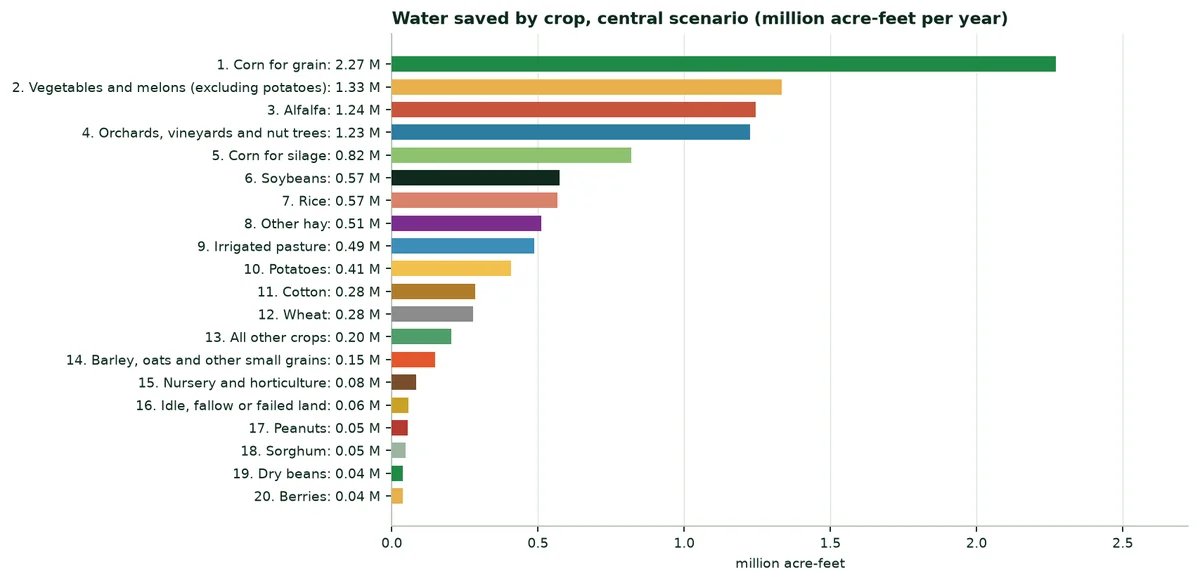
8.5 Water saved by crop (central scenario)
Water saved by crop (central scenario)
Crop | Irrigated acres | Water (thousand af) | Saved (thousand af/yr) | Yield gain (t) |
|---|---|---|---|---|
Corn for grain | 11,641,724 | 11,642 | 2,270 | 4,483,549 |
Vegetables and melons (excluding potatoes) | 2,065,378 | 4,407 | 1,333 | 4,634,287 |
Alfalfa | 5,408,531 | 12,440 | 1,244 | — |
Orchards, vineyards and nut trees | 5,105,937 | 12,254 | 1,225 | — |
Corn for silage | 1,909,521 | 4,201 | 819 | — |
Soybeans | 8,190,426 | 5,733 | 573 | 637,131 |
Rice | 2,268,904 | 5,672 | 567 | — |
Other hay | 3,196,249 | 5,114 | 511 | — |
Irrigated pasture | 3,043,010 | 4,869 | 487 | — |
Potatoes | 920,681 | 1,565 | 407 | 3,009,572 |
Cotton | 2,584,479 | 2,843 | 284 | — |
Wheat | 2,143,635 | 2,787 | 279 | 160,244 |
All other crops | 1,452,288 | 2,033 | 203 | — |
Barley, oats and other small grains | 1,141,657 | 1,484 | 148 | 101,707 |
Nursery and horticulture | 598,980 | 839 | 84 | — |
Idle, fallow or failed land | 482,367 | 579 | 58 | — |
Peanuts | 540,245 | 540 | 54 | 52,265 |
Sorghum | 430,947 | 474 | 47 | 32,137 |
Dry beans | 314,147 | 377 | 38 | 16,700 |
Berries | 246,361 | 370 | 37 | — |
Source: USDA IWMS 2023 (A6); calculation by the author (Annex B).
9. Potential benefits of our products
The table matches each expected benefit with what has been published, its source and its limit. It contains no yield promise.
Benefits, evidence and limits
Benefit | What is published | Source (level) | Limit |
|---|---|---|---|
Less irrigation water | −39% (maize), −52% (potato), −60.5% (watermelon), −82% (date palm) | Green Solutions and ICBA trials (A20 to A24, B to C) | Trials outside the United States, often on a single plot |
Yield maintained or increased | +17.1% (maize), +31.4% (potato), +30% (watermelon), +11% (soybean) | Same trials (B to C) | No statistical replication for most |
Resistance to heat and drought | Date palms without visible stress with watering spaced out | ICBA (A20, B) | One season, one site |
Sandy soils | Trial carried out in sandy, saline soil | ICBA (A20, B) | To be confirmed on American soils |
Fewer fertiliser losses | Higher nutrient levels in the root zone (date palm) | ICBA (A20, B) | Not quantified as fertiliser saved |
Less pumping | Follows from less water applied: Each acre-foot saved from a well saves its pumping energy | Calculation; USDA IWMS (A6) | Depends on the depth of the well and the energy price |
Organic fertilisation | ECOFERT® certified by SOHISCERT and EU Organic | Certificate (A25, A) | Agronomic effect not isolated |
Source: See the « Source » column.
10. External trade: Exports and imports
10.1 Overview
Agricultural trade of the United States
Indicator | 2023 | 2024 | Change |
|---|---|---|---|
Agricultural exports (bn$) | 171.0 | 172.4 | 0.8% |
Agricultural imports (bn$) | 194.5 | 212.4 | 9.2% |
Agricultural balance (bn$) | -23.6 | -40.0 | — |
Source: FAOSTAT, trade in agricultural products (A3); aggregate « crops and livestock products ».
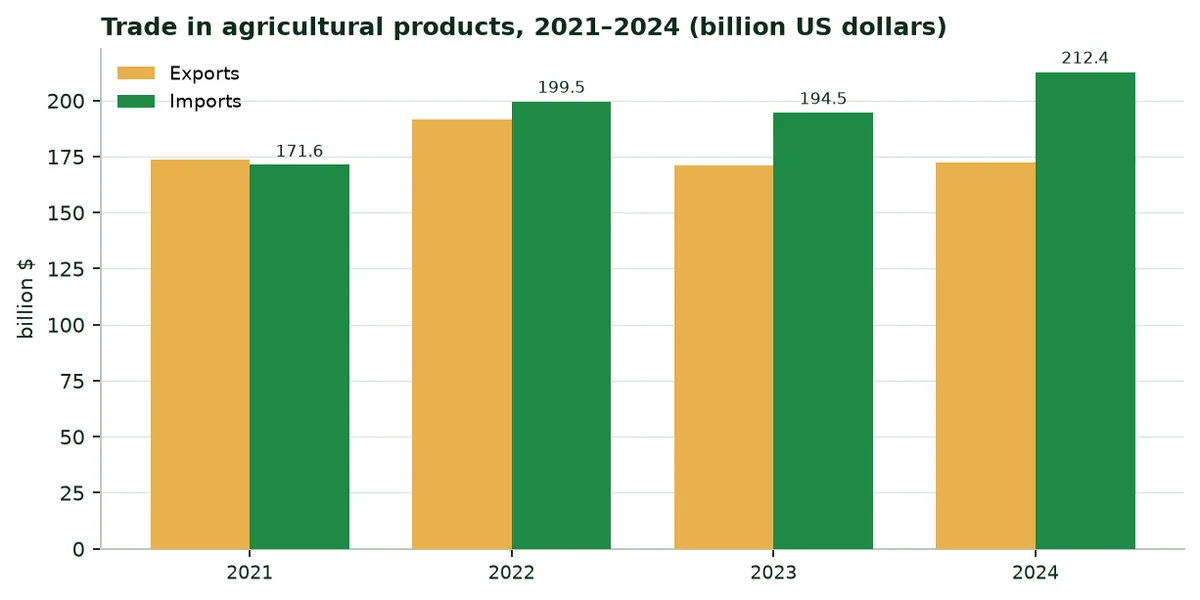
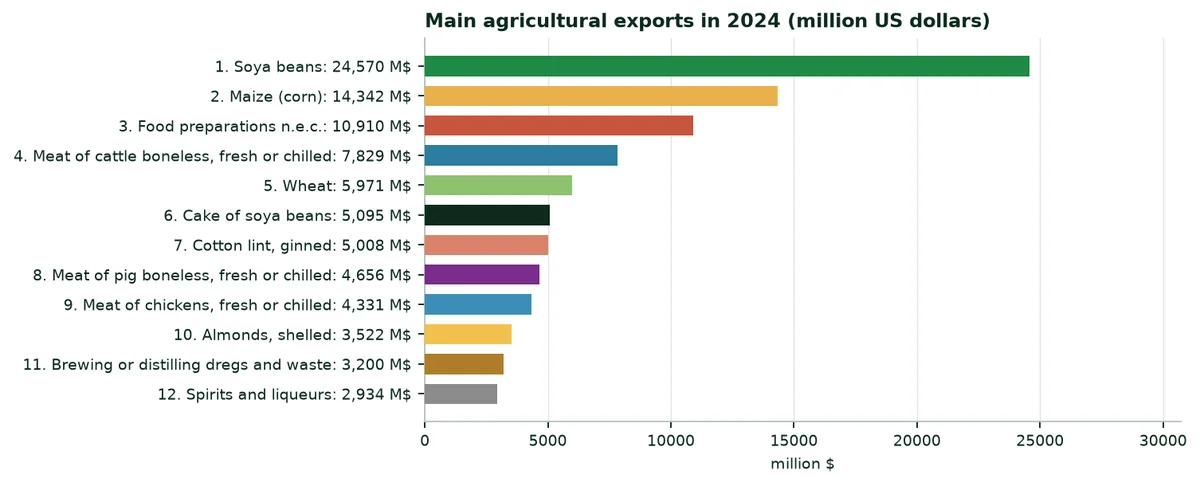
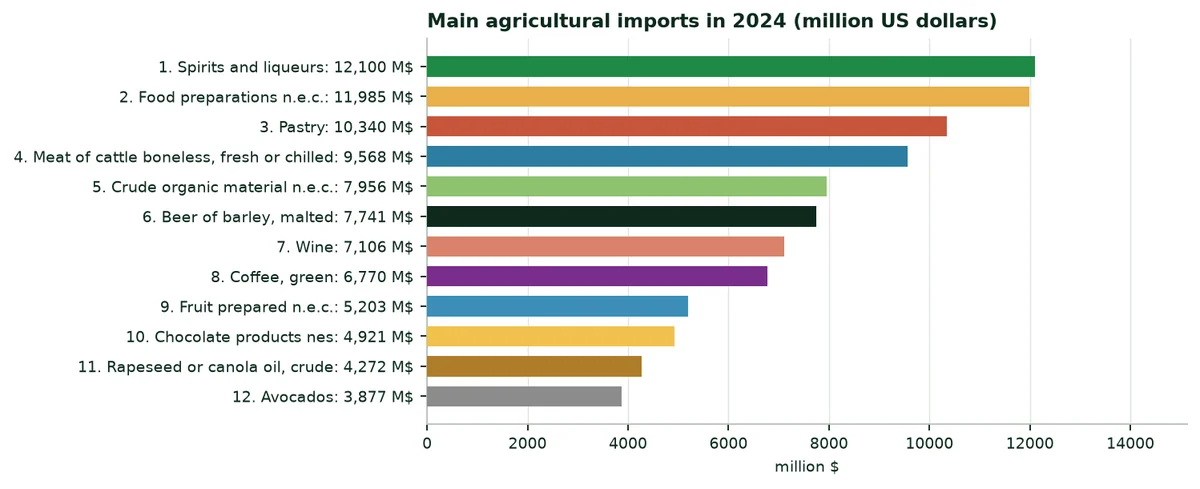
The United States exports soybeans, corn, almonds, beef, pork, cotton and wheat; it imports wine and spirits, fresh fruit and vegetables out of season, coffee, cocoa and processed foods. In 2023 and 2024, imports exceeded exports: $212.4 billion against $172.4 billion in 2024.
10.2 Exports
10.3 Imports
Irrigated products among the exports, 2024
Product | Exports (M$) | Exports (t) | Production 2023 (t) |
|---|---|---|---|
Corn | 14,342 | 62,589,862 | 389,694,460 |
Soybeans | 24,570 | 52,327,703 | 113,272,630 |
Wheat | 5,971 | 21,803,349 | 49,313,930 |
Cotton lint | 5,008 | 2,491,894 | 2,627,060 |
Rice (milled equivalent) | 2,438 | 3,143,664 | 9,901,510 |
Almonds, shelled | 3,522 | 716,374 | 1,751,770 |
Pistachios, in shell | 2,509 | 348,308 | 675,850 |
Potatoes, frozen | 1,569 | 934,863 | 19,992,090 |
Source: FAOSTAT (A2, A3). Production of almonds in shell, of rice as paddy, of potatoes for all uses.
10.4 Water and trade
Almonds, pistachios, rice, cotton and the corn of the Plains are both irrigated crops and export products. Every acre-foot saved on these crops protects export earnings in the dry years, when water deliveries are cut or wells run short.
11. Regional studies: The ten farm production regions
Each region has its own study: Its irrigated agriculture, its summer climate, the water it applies and where that water comes from, its states one by one, its crops, and what our products could change there in the central scenario. The figures come from the same sources as the rest of the dossier; the calculation is that of section 8, applied to the irrigated crops of each state.
11.1 Pacific
States: California, Oregon, Washington, Alaska and Hawaii.
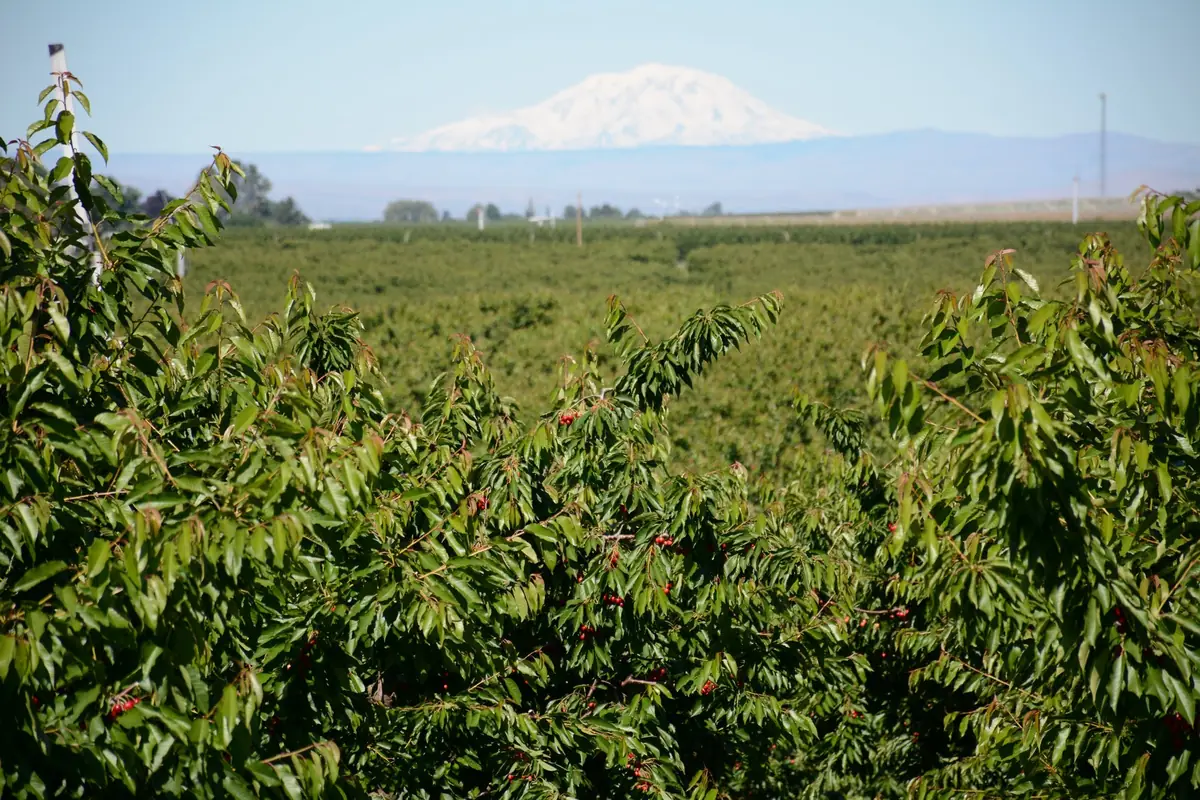
California's Central Valley and Imperial Valley grow almonds, pistachios, grapes, vegetables, alfalfa and rice. Washington's Columbia Basin and Yakima Valley grow apples, cherries, potatoes and hops; Oregon irrigates in the Willamette Valley and the Klamath basin. The water comes from the snowmelt of the Sierra Nevada and the Cascades, stored behind dams and carried by large federal and state projects, and from wells. California now regulates its groundwater under the Sustainable Groundwater Management Act of 2014.
Pacific: Key figures
Indicator | Value | Source (level) |
|---|---|---|
Irrigated acres | 10,905,754 acres, 20.5% of the country (figure withheld for Alaska and Hawaii) | USDA IWMS 2023 (A6, A) |
Farms that irrigate | 62,922 | USDA IWMS 2023 (A6, A) |
Irrigation water applied | 28,771,756 acre-feet (35.49 bn m³), 35.5% of the country | USDA IWMS 2023 (A6, A) |
Water per irrigated acre | 2.63 acre-feet (states with published acres) | Calculation |
Water by source | Wells 37%, off-farm suppliers 53%, on-farm surface water 11% | USDA IWMS 2023 (A6, A) |
Irrigation methods (acres) | Sprinkler 31%, gravity 29%, drip 41% | USDA IWMS 2023 (A6, A) |
Energy for pumping | $1,280 million in 2023 | USDA IWMS 2023 (A6, A) |
Acres hit by interrupted irrigation | 229,627 acres | USDA IWMS 2023 (A6, A) |
Rainfall at Fresno / Yakima | 416 mm / 342 mm per year | ERA5-Land (A12, B) |
Summer deficit at Fresno / Yakima | 663 mm / 523 mm, June to August | ERA5-Land (A12, B) |
Radiation at Fresno / Yakima | 1,953 / 1,553 kWh/m² per year | PVGIS (A11, A) |
Water saved, central scenario | 3,827,091 acre-feet per year, 13% of the region's water, 35.6% of the national saving | Calculation (Annex B) |
Range, cautious to strong | 1,913,546 to 7,654,183 acre-feet per year | Calculation (Annex B) |
Extra production, central scenario | 3,515,637 tonnes per year | Calculation (Annex B) |
Annual value, central scenario | $3,364.6 million (water at $94 per acre-foot and yield) | Calculation (Annex B) |
Source: See the « Source » column.
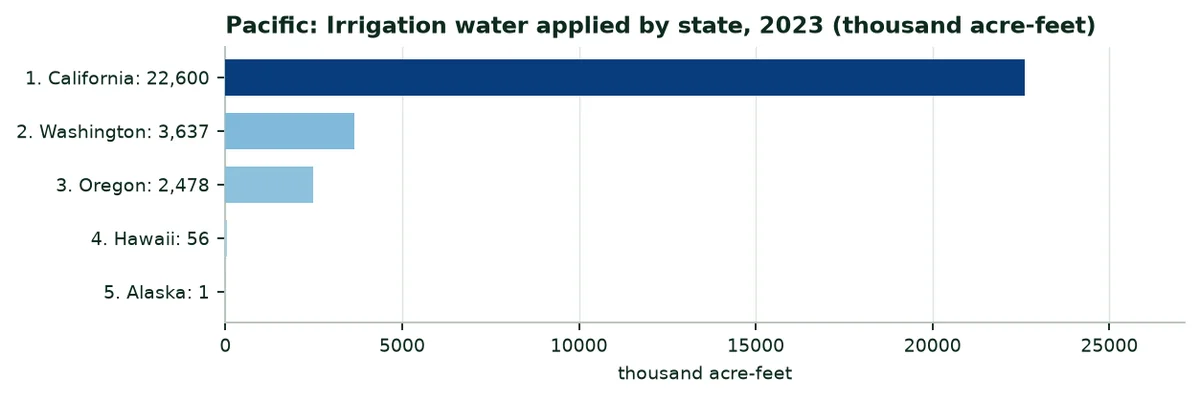
Pacific: State by state
State | Irrigated acres | Water (thousand af) | Af per acre | From wells | Sprinkler / drip | Off-farm water ($/af) | Saved, central (thousand af/yr) |
|---|---|---|---|---|---|---|---|
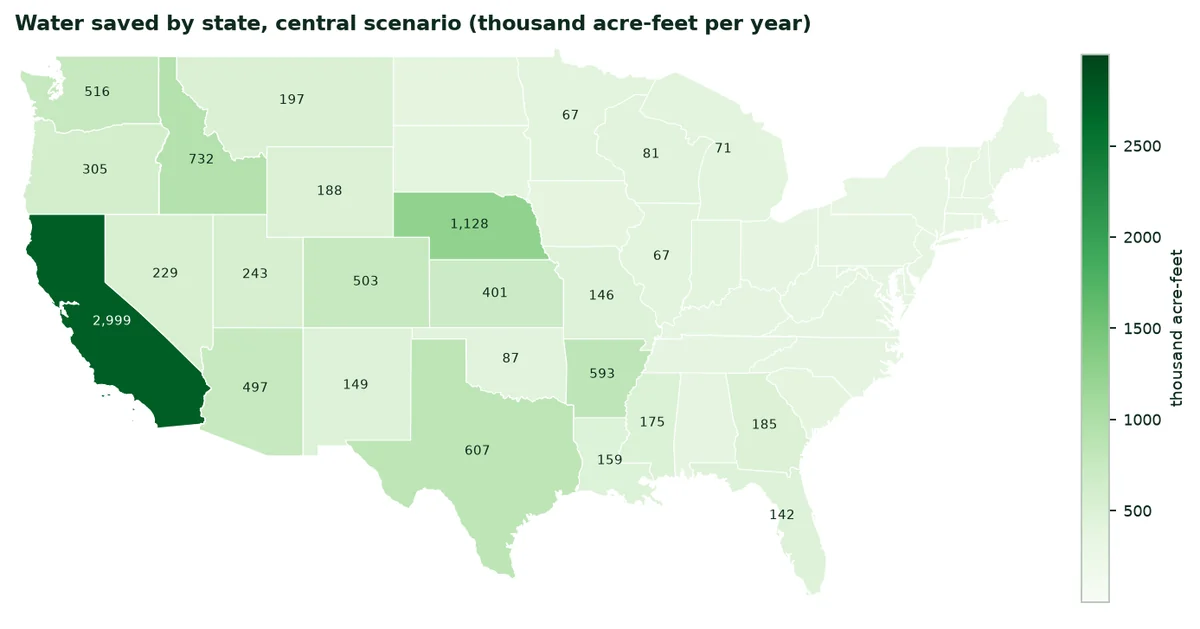
California | 7,755,846 | 22,600 | 2.9 | 38% | 13% / 52% | 71.98 | 2,999.0 |
Washington | 1,704,878 | 3,637 | 2.1 | 27% | 80% / 16% | 49.89 | 515.6 |
Oregon | 1,445,030 | 2,478 | 1.7 | 37% | 72% / 8% | 37.67 | 304.6 |
Hawaii | — | 56 | 1.6 | 15% | 22% / 70% | 216.27 | 7.6 |
Alaska | — | 1 | 0.7 | 90% | 79% / 16% | 550.00 | 0.2 |
Source: USDA IWMS 2023 (A6); calculation by the author (Annex B). « — »: Figure withheld or not applicable.
Pacific: Water by crop and central saving
Crop | Irrigated acres | Water (thousand af) | Af per acre | Saved, central (thousand af/yr) |
|---|---|---|---|---|
Orchards, vineyards and nut trees | 4,386,260 | 11,179 | 2.5 | 1,117.9 |
Alfalfa | 1,207,321 | 3,622 | 3.0 | 362.2 |
Vegetables and melons (excluding potatoes) | 1,210,352 | 3,231 | 2.7 | 977.5 |
Rice | 430,483 | 1,937 | 4.5 | 193.7 |
Corn for silage | 650,434 | 1,915 | 2.9 | 373.5 |
Other hay | 757,423 | 1,575 | 2.1 | 157.5 |
Irrigated pasture | 612,516 | 1,316 | 2.1 | 131.6 |
All other crops | 475,135 | 894 | 1.9 | 89.4 |
Wheat | 382,044 | 661 | 1.7 | 66.1 |
Corn for grain | 218,251 | 545 | 2.5 | 106.2 |
Potatoes | 204,181 | 463 | 2.3 | 120.4 |
Cotton | 153,218 | 429 | 2.8 | 42.9 |
Source: USDA IWMS 2023 (A6), table 39; crops withheld in a state are estimated from the national water per acre; calculation by the author.
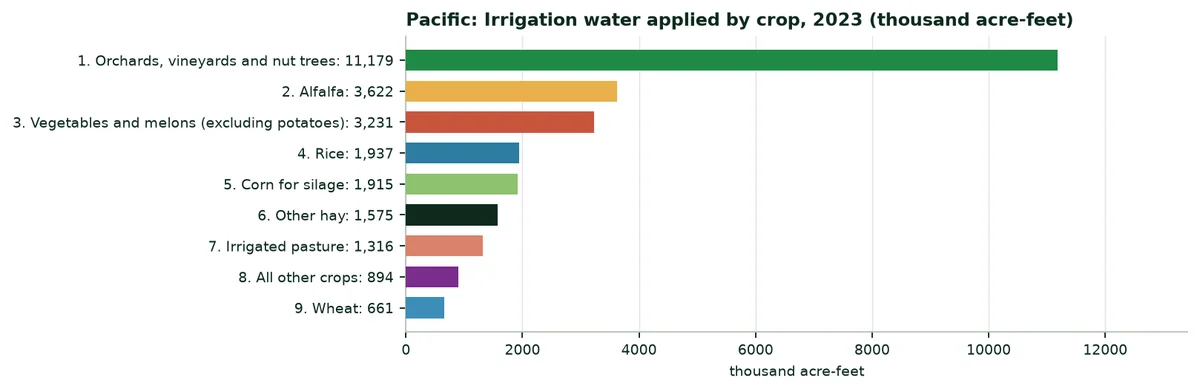
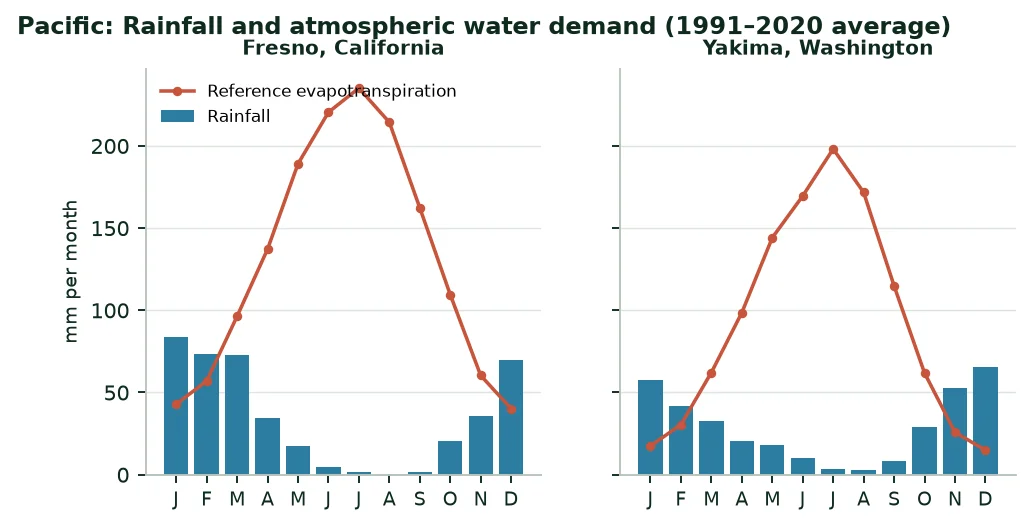
Crops that receive the most water: Orchards, vineyards and nut trees; alfalfa; vegetables and melons (excluding potatoes). First source of saving in the central scenario: Orchards, vineyards and nut trees (1,117,898 acre-feet per year). With a summer deficit of 593 mm on average at its two stations, the region is among the most exposed in the country.
11.2 Mountain
States: Arizona, Colorado, Idaho, Montana, Nevada, New Mexico, Utah and Wyoming.
Almost no crop grows here without irrigation. The Snake River Plain in Idaho grows potatoes, sugar beets, alfalfa and the feed of its dairies. Colorado and Utah irrigate corn, alfalfa and pasture in their valleys; Arizona grows winter vegetables at Yuma, and cotton and alfalfa in its central valleys. The Colorado River and its shortage rules weigh on Arizona and Nevada.
Mountain: Key figures
Indicator | Value | Source (level) |
|---|---|---|
Irrigated acres | 11,514,108 acres, 21.7% of the country | USDA IWMS 2023 (A6, A) |
Farms that irrigate | 59,153 | USDA IWMS 2023 (A6, A) |
Irrigation water applied | 22,460,014 acre-feet (27.70 bn m³), 27.7% of the country | USDA IWMS 2023 (A6, A) |
Water per irrigated acre | 1.95 acre-feet | Calculation |
Water by source | Wells 32%, off-farm suppliers 52%, on-farm surface water 16% | USDA IWMS 2023 (A6, A) |
Irrigation methods (acres) | Sprinkler 54%, gravity 45%, drip 1% | USDA IWMS 2023 (A6, A) |
Energy for pumping | $476 million in 2023 | USDA IWMS 2023 (A6, A) |
Acres hit by interrupted irrigation | 584,472 acres | USDA IWMS 2023 (A6, A) |
Rainfall at Boise / Phoenix | 318 mm / 249 mm per year | ERA5-Land (A12, B) |
Summer deficit at Boise / Phoenix | 588 mm / 680 mm, June to August | ERA5-Land (A12, B) |
Radiation at Boise / Phoenix | 1,649 / 2,136 kWh/m² per year | PVGIS (A11, A) |
Water saved, central scenario | 2,737,606 acre-feet per year, 12% of the region's water, 25.5% of the national saving | Calculation (Annex B) |
Range, cautious to strong | 1,368,803 to 5,475,213 acre-feet per year | Calculation (Annex B) |
Extra production, central scenario | 2,204,705 tonnes per year | Calculation (Annex B) |
Annual value, central scenario | $1,197.6 million (water at $94 per acre-foot and yield) | Calculation (Annex B) |
Source: See the « Source » column.
Mountain: State by state
State | Irrigated acres | Water (thousand af) | Af per acre | From wells | Sprinkler / drip | Off-farm water ($/af) | Saved, central (thousand af/yr) |
|---|---|---|---|---|---|---|---|
Idaho | 3,180,644 | 5,407 | 1.7 | 37% | 82% / 1% | 23.35 | 731.5 |
Arizona | 920,420 | 3,927 | 4.3 | 45% | 19% / 10% | 37.57 | 496.7 |
Colorado | 2,367,382 | 3,741 | 1.6 | 33% | 53% / 1% | 24.12 | 503.2 |
Nevada | 767,294 | 2,249 | 2.9 | 31% | 27% / 3% | 8.57 | 229.1 |
Utah | 985,863 | 2,221 | 2.3 | 34% | 60% / 0% | 24.24 | 243.3 |
Montana | 1,561,047 | 1,879 | 1.2 | 3% | 45% / 0% | 17.90 | 196.7 |
Wyoming | 1,148,044 | 1,825 | 1.6 | 6% | 29% / 0% | 18.32 | 188.2 |
New Mexico | 583,414 | 1,211 | 2.1 | 55% | 51% / 2% | 24.91 | 148.9 |
Source: USDA IWMS 2023 (A6); calculation by the author (Annex B). « — »: Figure withheld or not applicable.
Mountain: Water by crop and central saving
Crop | Irrigated acres | Water (thousand af) | Af per acre | Saved, central (thousand af/yr) |
|---|---|---|---|---|
Alfalfa | 3,631,941 | 8,361 | 2.3 | 836.1 |
Irrigated pasture | 1,968,357 | 3,105 | 1.6 | 310.5 |
Other hay | 1,644,411 | 2,619 | 1.6 | 261.9 |
Corn for silage | 675,094 | 1,470 | 2.2 | 286.7 |
Corn for grain | 719,817 | 1,196 | 1.7 | 233.2 |
Wheat | 738,330 | 1,187 | 1.6 | 118.7 |
Barley, oats and other small grains | 744,030 | 1,041 | 1.4 | 104.1 |
Potatoes | 404,237 | 766 | 1.9 | 199.1 |
Vegetables and melons (excluding potatoes) | 212,011 | 606 | 2.9 | 183.3 |
All other crops | 290,992 | 576 | 2.0 | 57.6 |
Cotton | 124,329 | 461 | 3.7 | 46.1 |
Orchards, vineyards and nut trees | 118,492 | 406 | 3.4 | 40.6 |
Source: USDA IWMS 2023 (A6), table 39; crops withheld in a state are estimated from the national water per acre; calculation by the author.
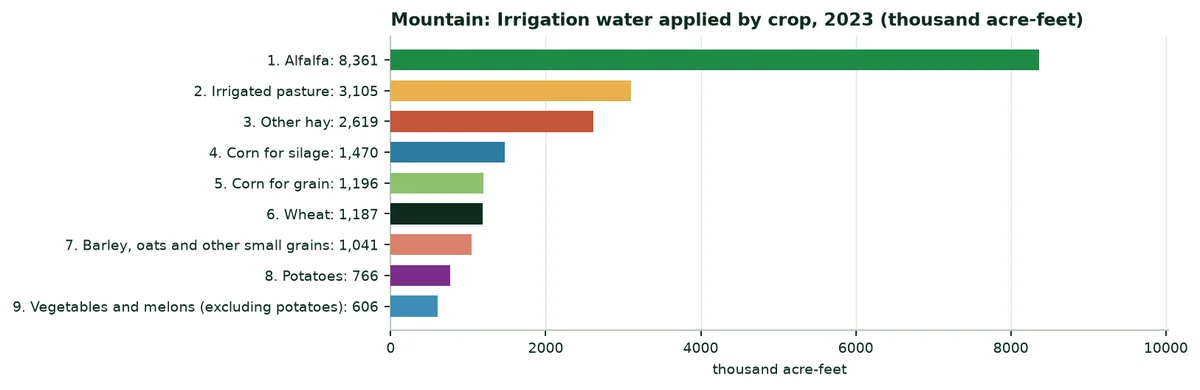
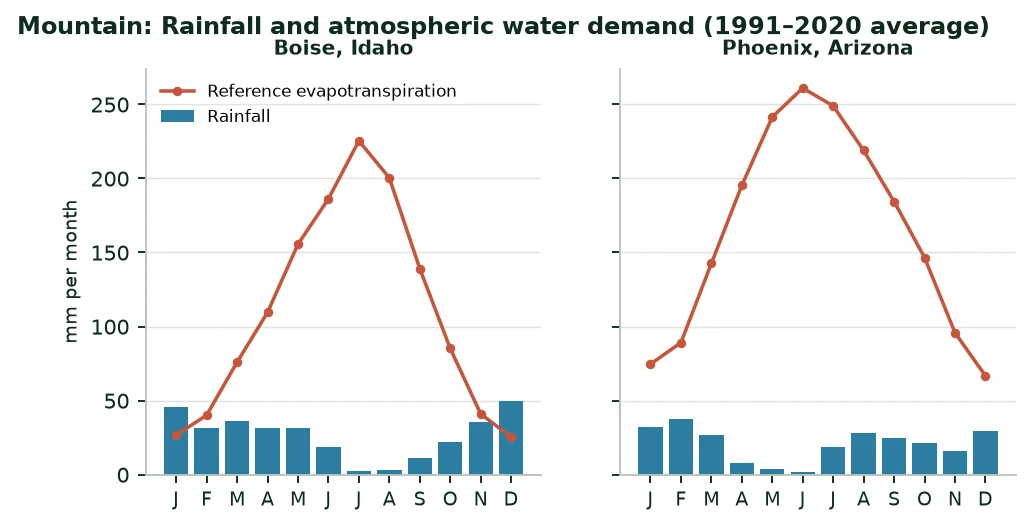
Crops that receive the most water: Alfalfa; irrigated pasture; other hay. First source of saving in the central scenario: Alfalfa (836,147 acre-feet per year). With a summer deficit of 634 mm on average at its two stations, the region is among the most exposed in the country.
11.3 Northern Plains
States: Kansas, Nebraska, North Dakota and South Dakota.
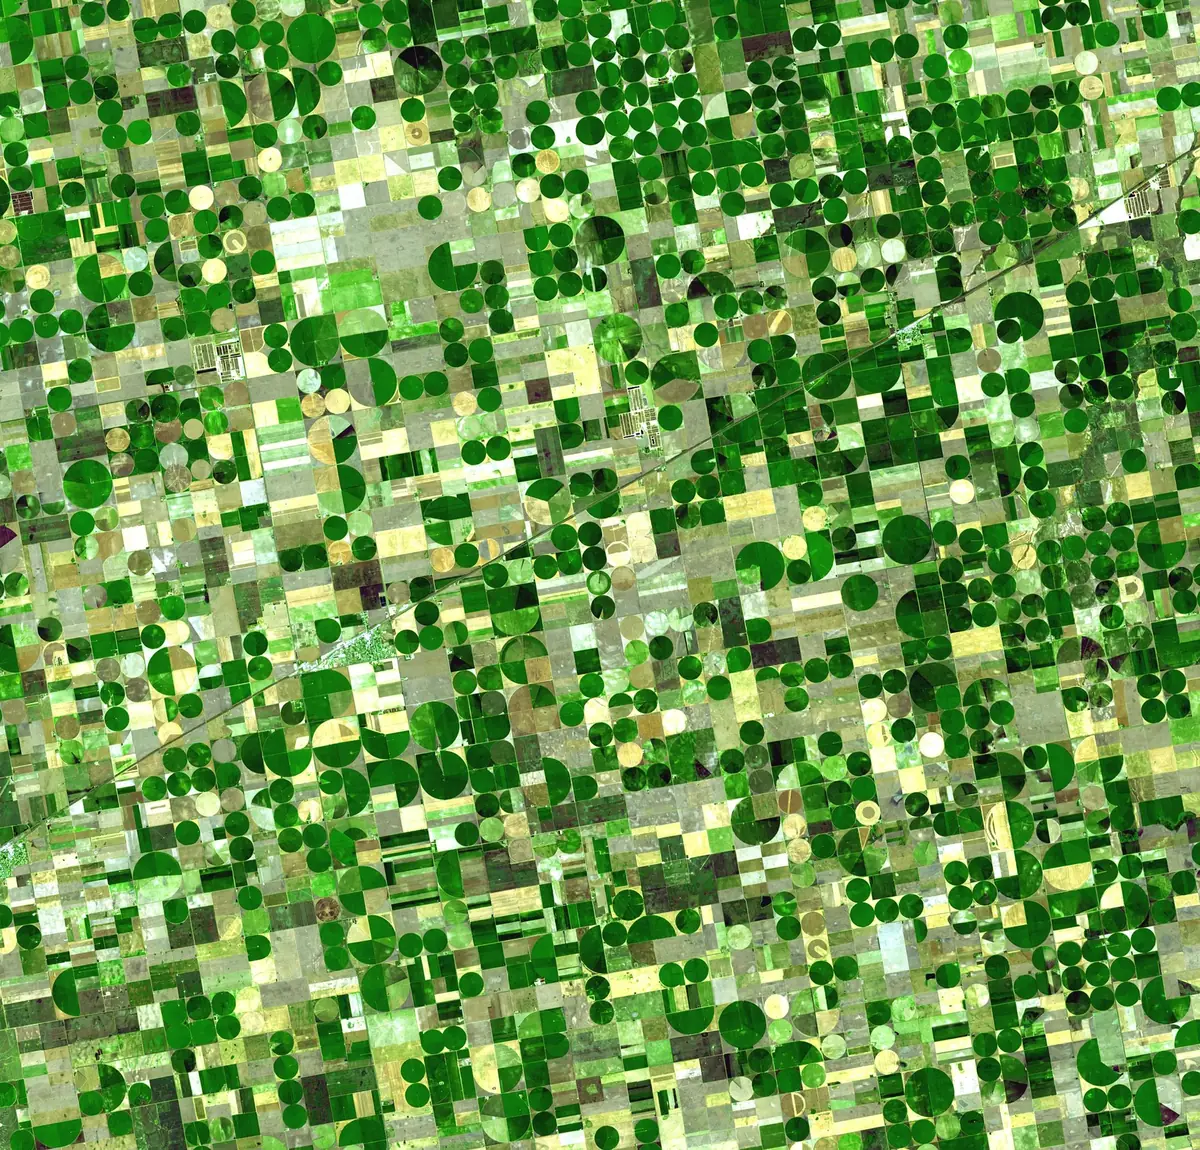
Nebraska is the most irrigated state east of the Rocky Mountains. Its centre pivots draw on the High Plains (Ogallala) aquifer to grow corn, soybeans and alfalfa. Western Kansas irrigates corn, wheat and sorghum for its feedlots, where the aquifer is falling. The Dakotas irrigate little.
Northern Plains: Key figures
Indicator | Value | Source (level) |
|---|---|---|
Irrigated acres | 10,256,245 acres, 19.3% of the country | USDA IWMS 2023 (A6, A) |
Farms that irrigate | 19,269 | USDA IWMS 2023 (A6, A) |
Irrigation water applied | 9,809,670 acre-feet (12.10 bn m³), 12.1% of the country | USDA IWMS 2023 (A6, A) |
Water per irrigated acre | 0.96 acre-feet | Calculation |
Water by source | Wells 94%, off-farm suppliers 5%, on-farm surface water 1% | USDA IWMS 2023 (A6, A) |
Irrigation methods (acres) | Sprinkler 94%, gravity 5%, drip 1% | USDA IWMS 2023 (A6, A) |
Energy for pumping | $504 million in 2023 | USDA IWMS 2023 (A6, A) |
Acres hit by interrupted irrigation | 420,889 acres | USDA IWMS 2023 (A6, A) |
Rainfall at Grand Island / Garden City | 738 mm / 507 mm per year | ERA5-Land (A12, B) |
Summer deficit at Grand Island / Garden City | 247 mm / 418 mm, June to August | ERA5-Land (A12, B) |
Radiation at Grand Island / Garden City | 1,616 / 1,829 kWh/m² per year | PVGIS (A11, A) |
Water saved, central scenario | 1,596,891 acre-feet per year, 16% of the region's water, 14.9% of the national saving | Calculation (Annex B) |
Range, cautious to strong | 798,446 to 3,193,783 acre-feet per year | Calculation (Annex B) |
Extra production, central scenario | 2,757,538 tonnes per year | Calculation (Annex B) |
Annual value, central scenario | $728.2 million (water at $94 per acre-foot and yield) | Calculation (Annex B) |
Source: See the « Source » column.
Northern Plains: State by state
State | Irrigated acres | Water (thousand af) | Af per acre | From wells | Sprinkler / drip | Off-farm water ($/af) | Saved, central (thousand af/yr) |
|---|---|---|---|---|---|---|---|
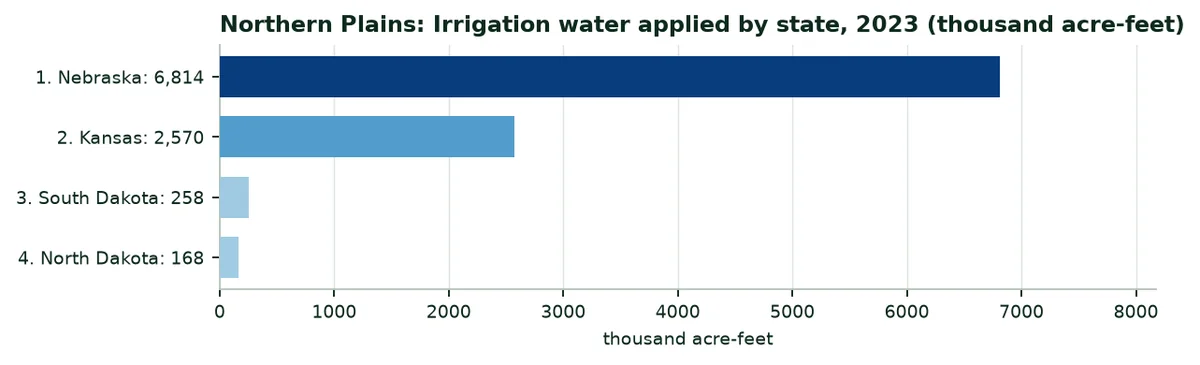
Nebraska | 7,305,558 | 6,814 | 0.9 | 94% | 93% / 0% | 72.03 | 1,128.4 |
Kansas | 2,324,901 | 2,570 | 1.1 | 97% | 97% / 1% | 35.65 | 401.1 |
South Dakota | 379,485 | 258 | 0.7 | 74% | 97% / 0% | 65.28 | 39.6 |
North Dakota | 246,301 | 168 | 0.7 | 74% | 92% / 0% | 58.74 | 27.8 |
Source: USDA IWMS 2023 (A6); calculation by the author (Annex B). « — »: Figure withheld or not applicable.
Northern Plains: Water by crop and central saving
Crop | Irrigated acres | Water (thousand af) | Af per acre | Saved, central (thousand af/yr) |
|---|---|---|---|---|
Corn for grain | 5,894,017 | 6,031 | 1.0 | 1,176.0 |
Soybeans | 2,455,317 | 1,984 | 0.8 | 198.4 |
Alfalfa | 418,283 | 428 | 1.0 | 42.8 |
Wheat | 479,302 | 374 | 0.8 | 37.4 |
Corn for silage | 233,992 | 249 | 1.1 | 48.5 |
Other hay | 234,928 | 212 | 0.9 | 21.2 |
All other crops | 125,183 | 167 | 1.3 | 16.7 |
Sorghum | 122,920 | 109 | 0.9 | 10.9 |
Potatoes | 73,882 | 94 | 1.3 | 24.5 |
Irrigated pasture | 84,597 | 61 | 0.7 | 6.1 |
Dry beans | 80,997 | 54 | 0.7 | 5.4 |
Idle, fallow or failed land | 46,046 | 32 | 0.7 | 3.2 |
Source: USDA IWMS 2023 (A6), table 39; crops withheld in a state are estimated from the national water per acre; calculation by the author.
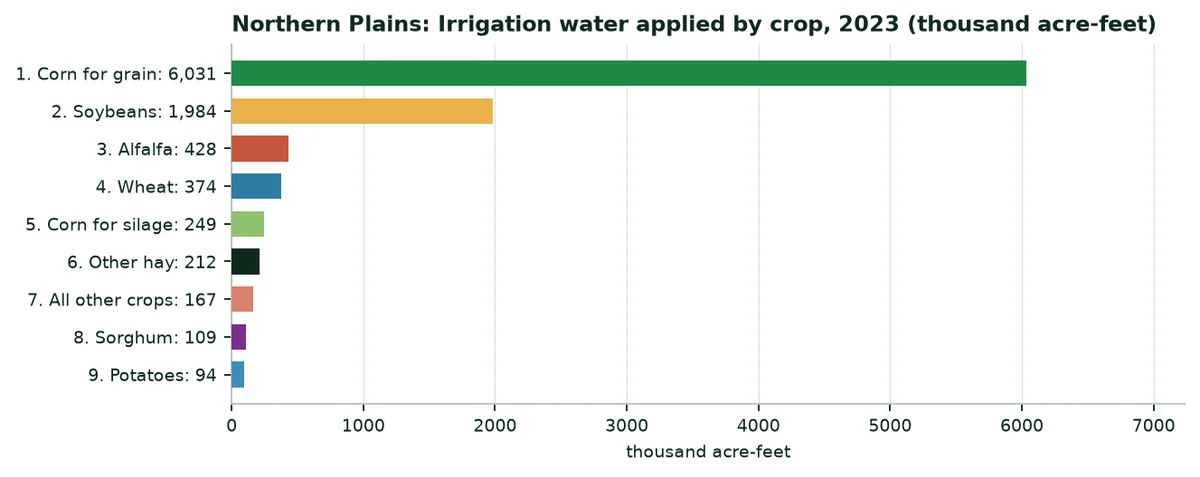
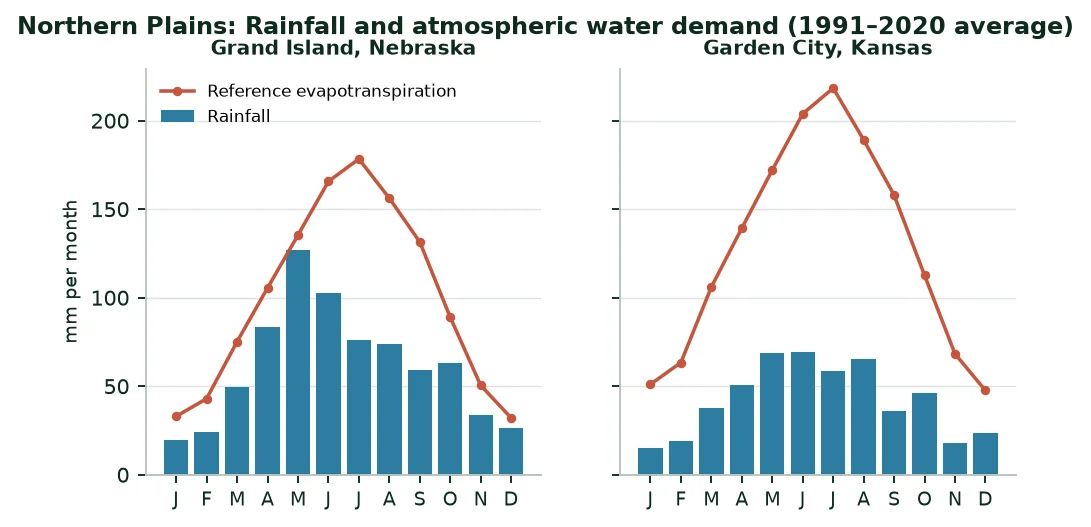
Crops that receive the most water: Corn for grain; soybeans; alfalfa. First source of saving in the central scenario: Corn for grain (1,176,007 acre-feet per year). With a summer deficit of 332 mm on average at its two stations, the region is in the middle of the country's range.
11.4 Southern Plains
States: Oklahoma and Texas.
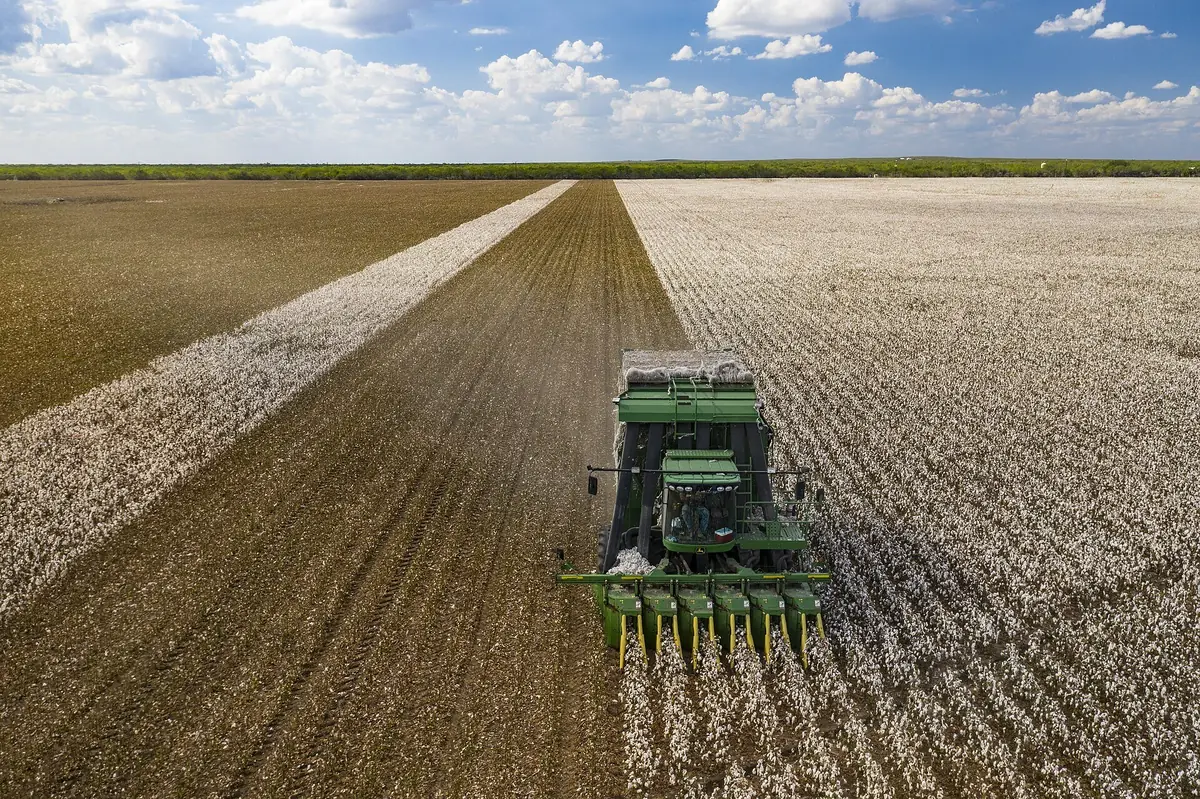
The Texas High Plains, around Lubbock and Amarillo, grow cotton, corn, sorghum and wheat on the southern part of the High Plains aquifer, where its level has fallen the most. The Rio Grande Valley grows citrus and vegetables; the Oklahoma panhandle irrigates corn and wheat.
Southern Plains: Key figures
Indicator | Value | Source (level) |
|---|---|---|
Irrigated acres | 4,259,912 acres, 8.0% of the country | USDA IWMS 2023 (A6, A) |
Farms that irrigate | 12,630 | USDA IWMS 2023 (A6, A) |
Irrigation water applied | 5,264,862 acre-feet (6.49 bn m³), 6.5% of the country | USDA IWMS 2023 (A6, A) |
Water per irrigated acre | 1.24 acre-feet | Calculation |
Water by source | Wells 84%, off-farm suppliers 13%, on-farm surface water 4% | USDA IWMS 2023 (A6, A) |
Irrigation methods (acres) | Sprinkler 76%, gravity 12%, drip 12% | USDA IWMS 2023 (A6, A) |
Energy for pumping | $318 million in 2023 | USDA IWMS 2023 (A6, A) |
Acres hit by interrupted irrigation | 533,351 acres | USDA IWMS 2023 (A6, A) |
Rainfall at Lubbock / Weslaco | 449 mm / 591 mm per year | ERA5-Land (A12, B) |
Summer deficit at Lubbock / Weslaco | 524 mm / 437 mm, June to August | ERA5-Land (A12, B) |
Radiation at Lubbock / Weslaco | 2,008 / 1,925 kWh/m² per year | PVGIS (A11, A) |
Water saved, central scenario | 693,165 acre-feet per year, 13% of the region's water, 6.5% of the national saving | Calculation (Annex B) |
Range, cautious to strong | 346,583 to 1,386,330 acre-feet per year | Calculation (Annex B) |
Extra production, central scenario | 584,471 tonnes per year | Calculation (Annex B) |
Annual value, central scenario | $295.4 million (water at $94 per acre-foot and yield) | Calculation (Annex B) |
Source: See the « Source » column.
Southern Plains: State by state
State | Irrigated acres | Water (thousand af) | Af per acre | From wells | Sprinkler / drip | Off-farm water ($/af) | Saved, central (thousand af/yr) |
|---|---|---|---|---|---|---|---|
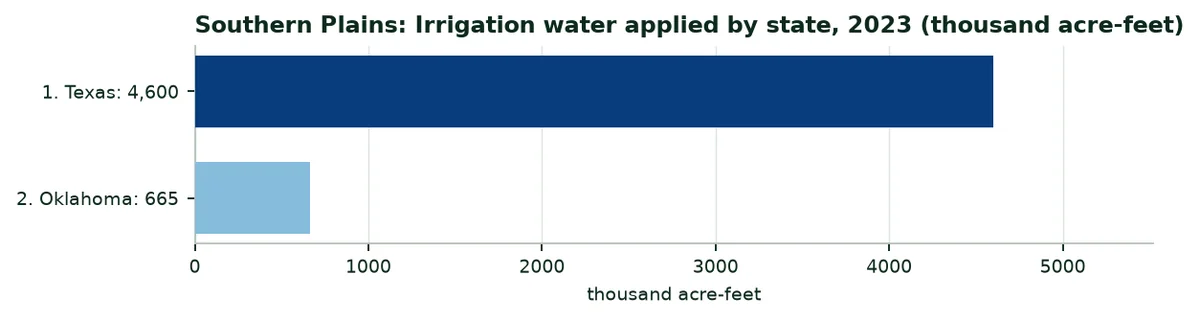
Texas | 3,720,978 | 4,600 | 1.2 | 82% | 74% / 13% | 91.47 | 606.6 |
Oklahoma | 538,934 | 665 | 1.2 | 94% | 92% / 4% | 440.79 | 86.5 |
Source: USDA IWMS 2023 (A6); calculation by the author (Annex B). « — »: Figure withheld or not applicable.
Southern Plains: Water by crop and central saving
Crop | Irrigated acres | Water (thousand af) | Af per acre | Saved, central (thousand af/yr) |
|---|---|---|---|---|
Cotton | 1,056,025 | 950 | 0.9 | 95.0 |
Corn for grain | 648,308 | 933 | 1.4 | 181.9 |
Other hay | 488,067 | 593 | 1.2 | 59.3 |
Wheat | 390,676 | 441 | 1.1 | 44.1 |
Corn for silage | 234,930 | 412 | 1.8 | 80.4 |
Irrigated pasture | 326,286 | 342 | 1.0 | 34.2 |
Sorghum | 232,460 | 256 | 1.1 | 25.6 |
Idle, fallow or failed land | 217,757 | 234 | 1.1 | 23.4 |
Barley, oats and other small grains | 149,302 | 170 | 1.1 | 17.0 |
Orchards, vineyards and nut trees | 64,837 | 152 | 2.3 | 15.2 |
Rice | 62,495 | 144 | 2.3 | 14.4 |
Alfalfa | 73,024 | 134 | 1.8 | 13.4 |
Source: USDA IWMS 2023 (A6), table 39; crops withheld in a state are estimated from the national water per acre; calculation by the author.
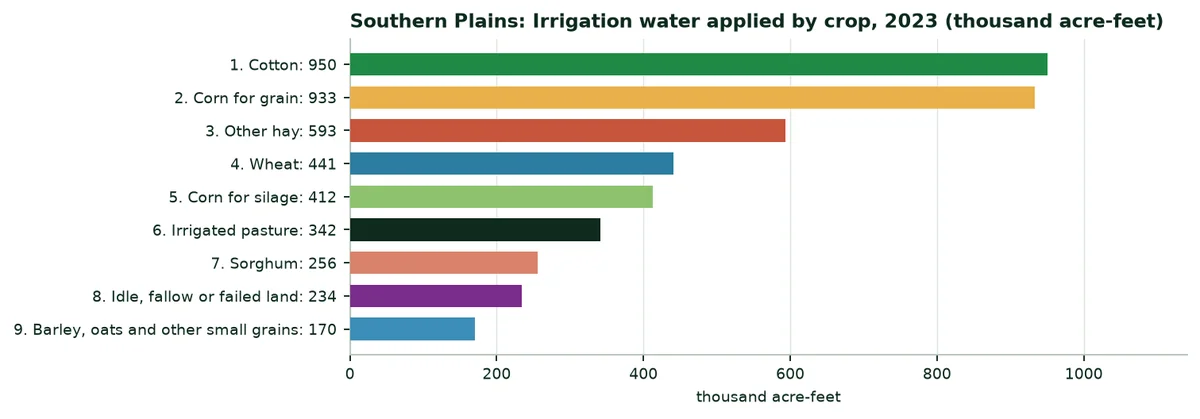
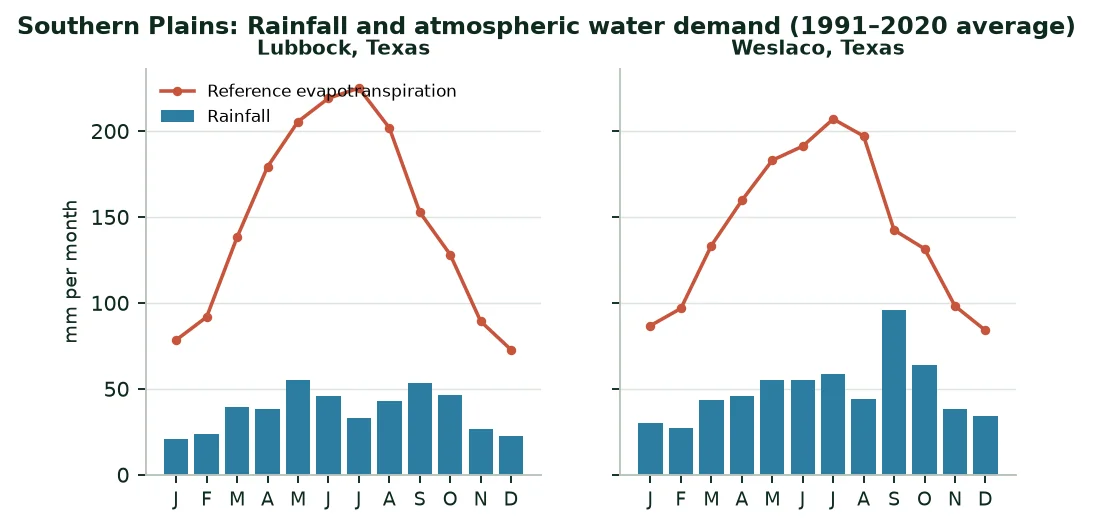
Crops that receive the most water: Cotton; corn for grain; other hay. First source of saving in the central scenario: Corn for grain (181,937 acre-feet per year). With a summer deficit of 480 mm on average at its two stations, the region is among the most exposed in the country.
11.5 Corn Belt
States: Illinois, Indiana, Iowa, Missouri and Ohio.
Corn and soybeans are mostly rain-fed. Irrigation is concentrated on sandy soils and river bottoms: The Missouri bootheel (rice, cotton, corn, soybeans), the sands of central Illinois and northern Indiana. There, a centre pivot secures the yield in the dry weeks of July.
Corn Belt: Key figures
Indicator | Value | Source (level) |
|---|---|---|
Irrigated acres | 3,036,365 acres, 5.7% of the country | USDA IWMS 2023 (A6, A) |
Farms that irrigate | 9,883 | USDA IWMS 2023 (A6, A) |
Irrigation water applied | 2,066,403 acre-feet (2.55 bn m³), 2.6% of the country | USDA IWMS 2023 (A6, A) |
Water per irrigated acre | 0.68 acre-feet | Calculation |
Water by source | Wells 95%, off-farm suppliers 1%, on-farm surface water 4% | USDA IWMS 2023 (A6, A) |
Irrigation methods (acres) | Sprinkler 69%, gravity 29%, drip 1% | USDA IWMS 2023 (A6, A) |
Energy for pumping | $108 million in 2023 | USDA IWMS 2023 (A6, A) |
Acres hit by interrupted irrigation | 50,781 acres | USDA IWMS 2023 (A6, A) |
Rainfall at Des Moines / Springfield | 944 mm / 1,009 mm per year | ERA5-Land (A12, B) |
Summer deficit at Des Moines / Springfield | 131 mm / 168 mm, June to August | ERA5-Land (A12, B) |
Radiation at Des Moines / Springfield | 1,500 / 1,522 kWh/m² per year | PVGIS (A11, A) |
Water saved, central scenario | 292,159 acre-feet per year, 14% of the region's water, 2.7% of the national saving | Calculation (Annex B) |
Range, cautious to strong | 146,079 to 584,317 acre-feet per year | Calculation (Annex B) |
Extra production, central scenario | 750,085 tonnes per year | Calculation (Annex B) |
Annual value, central scenario | $294.2 million (water at $94 per acre-foot and yield) | Calculation (Annex B) |
Source: See the « Source » column.
Corn Belt: State by state
State | Irrigated acres | Water (thousand af) | Af per acre | From wells | Sprinkler / drip | Off-farm water ($/af) | Saved, central (thousand af/yr) |
|---|---|---|---|---|---|---|---|
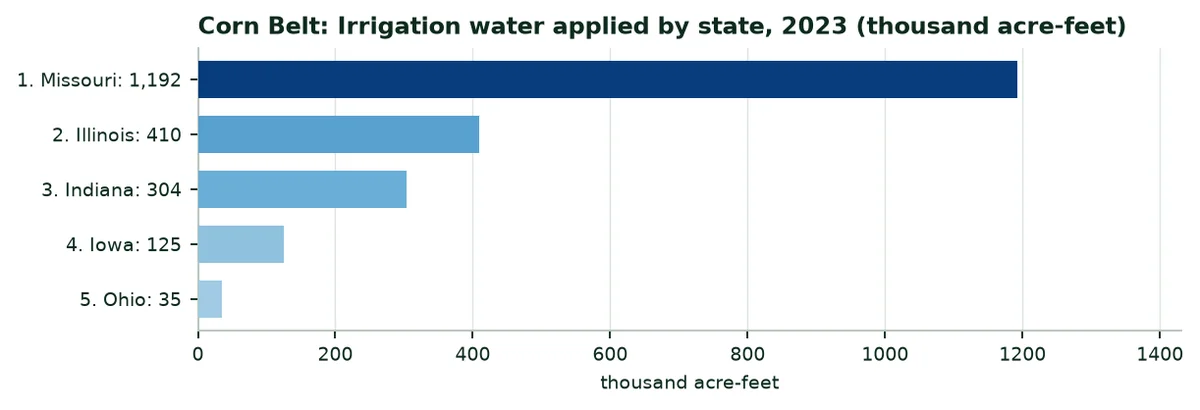
Missouri | 1,486,605 | 1,192 | 0.8 | 98% | 40% / 1% | 381.68 | 146.2 |
Illinois | 679,401 | 410 | 0.6 | 98% | 98% / 2% | 383.62 | 66.9 |
Indiana | 581,477 | 304 | 0.5 | 86% | 98% / 1% | 324.74 | 51.6 |
Iowa | 234,886 | 125 | 0.5 | 94% | 99% / 1% | 1,229.00 | 21.7 |
Ohio | 53,996 | 35 | 0.7 | 62% | 83% / 16% | 232.46 | 5.7 |
Source: USDA IWMS 2023 (A6); calculation by the author (Annex B). « — »: Figure withheld or not applicable.
Corn Belt: Water by crop and central saving
Crop | Irrigated acres | Water (thousand af) | Af per acre | Saved, central (thousand af/yr) |
|---|---|---|---|---|
Corn for grain | 1,266,601 | 799 | 0.6 | 155.7 |
Soybeans | 1,157,054 | 709 | 0.6 | 70.9 |
Cotton | 273,892 | 219 | 0.8 | 21.9 |
Rice | 122,248 | 183 | 1.5 | 18.3 |
Nursery and horticulture | 32,501 | 34 | 1.0 | 3.4 |
Other irrigated land (not itemised) | — | 30 | — | 3.0 |
Vegetables and melons (excluding potatoes) | 53,610 | 28 | 0.5 | 8.5 |
All other crops | 26,645 | 16 | 0.6 | 1.6 |
Wheat | 46,885 | 15 | 0.3 | 1.5 |
Potatoes | 14,367 | 13 | 0.9 | 3.3 |
Corn for silage | 17,841 | 8 | 0.5 | 1.6 |
Peanuts | 11,840 | 7 | 0.6 | 0.7 |
Source: USDA IWMS 2023 (A6), table 39; crops withheld in a state are estimated from the national water per acre; calculation by the author.
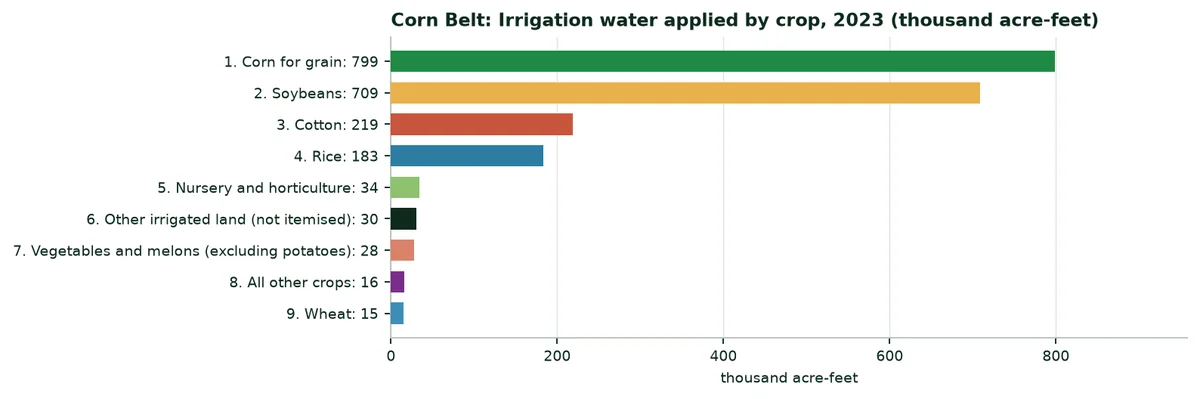
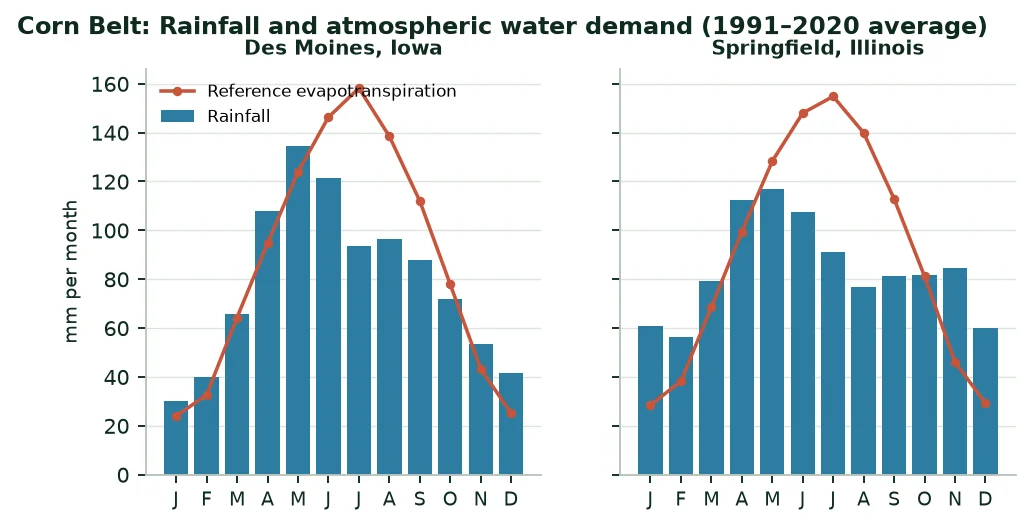
Crops that receive the most water: Corn for grain; soybeans; cotton. First source of saving in the central scenario: Corn for grain (155,708 acre-feet per year). With a summer deficit of 150 mm on average at its two stations, the region is among the least exposed in the country.
11.6 Lake States
States: Michigan, Minnesota and Wisconsin.
Dairy farms, corn and soybeans, mostly rain-fed. Irrigation waters sandy soils: The Central Sands of Wisconsin (potatoes, vegetables, sweet corn), central Minnesota and southwest Michigan (seed corn, vegetables). Sandy soils hold little water, which favours water retainers.
Lake States: Key figures
Indicator | Value | Source (level) |
|---|---|---|
Irrigated acres | 1,784,573 acres, 3.4% of the country | USDA IWMS 2023 (A6, A) |
Farms that irrigate | 9,762 | USDA IWMS 2023 (A6, A) |
Irrigation water applied | 1,251,724 acre-feet (1.54 bn m³), 1.5% of the country | USDA IWMS 2023 (A6, A) |
Water per irrigated acre | 0.70 acre-feet | Calculation |
Water by source | Wells 85%, off-farm suppliers 3%, on-farm surface water 12% | USDA IWMS 2023 (A6, A) |
Irrigation methods (acres) | Sprinkler 95%, gravity 1%, drip 4% | USDA IWMS 2023 (A6, A) |
Energy for pumping | $78 million in 2023 | USDA IWMS 2023 (A6, A) |
Acres hit by interrupted irrigation | 47,987 acres | USDA IWMS 2023 (A6, A) |
Rainfall at Stevens Point / Saint Paul | 834 mm / 834 mm per year | ERA5-Land (A12, B) |
Summer deficit at Stevens Point / Saint Paul | 121 mm / 120 mm, June to August | ERA5-Land (A12, B) |
Radiation at Stevens Point / Saint Paul | 1,408 / 1,397 kWh/m² per year | PVGIS (A11, A) |
Water saved, central scenario | 218,558 acre-feet per year, 17% of the region's water, 2.0% of the national saving | Calculation (Annex B) |
Range, cautious to strong | 109,279 to 437,115 acre-feet per year | Calculation (Annex B) |
Extra production, central scenario | 1,339,016 tonnes per year | Calculation (Annex B) |
Annual value, central scenario | $763.1 million (water at $94 per acre-foot and yield) | Calculation (Annex B) |
Source: See the « Source » column.
Lake States: State by state
State | Irrigated acres | Water (thousand af) | Af per acre | From wells | Sprinkler / drip | Off-farm water ($/af) | Saved, central (thousand af/yr) |
|---|---|---|---|---|---|---|---|
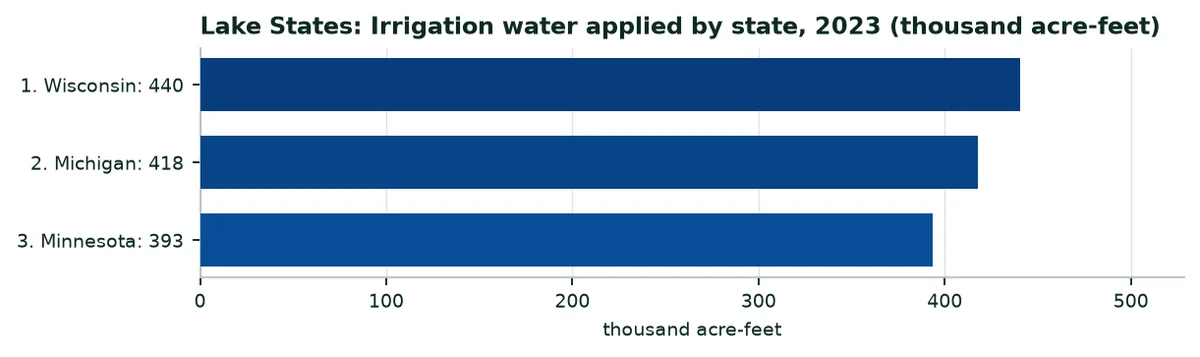
Wisconsin | 480,561 | 440 | 0.9 | 83% | 97% / 1% | 57.69 | 81.3 |
Michigan | 746,242 | 418 | 0.6 | 82% | 91% / 9% | 2,301.05 | 70.6 |
Minnesota | 557,770 | 393 | 0.7 | 92% | 98% / 0% | 936.69 | 66.7 |
Source: USDA IWMS 2023 (A6); calculation by the author (Annex B). « — »: Figure withheld or not applicable.
Lake States: Water by crop and central saving
Crop | Irrigated acres | Water (thousand af) | Af per acre | Saved, central (thousand af/yr) |
|---|---|---|---|---|
Corn for grain | 736,614 | 493 | 0.7 | 96.1 |
Soybeans | 330,781 | 199 | 0.6 | 19.9 |
Vegetables and melons (excluding potatoes) | 235,061 | 120 | 0.5 | 36.2 |
Potatoes | 151,914 | 119 | 0.8 | 30.9 |
Berries | 42,384 | 90 | 2.1 | 9.0 |
Corn for silage | 67,421 | 43 | 0.6 | 8.3 |
Alfalfa | 62,442 | 36 | 0.6 | 3.6 |
Dry beans | 49,302 | 36 | 0.7 | 3.6 |
Nursery and horticulture | 39,713 | 33 | 0.8 | 3.3 |
All other crops | 20,262 | 29 | 1.4 | 2.9 |
Orchards, vineyards and nut trees | 23,414 | 14 | 0.6 | 1.4 |
Wheat | 30,821 | 13 | 0.4 | 1.3 |
Source: USDA IWMS 2023 (A6), table 39; crops withheld in a state are estimated from the national water per acre; calculation by the author.
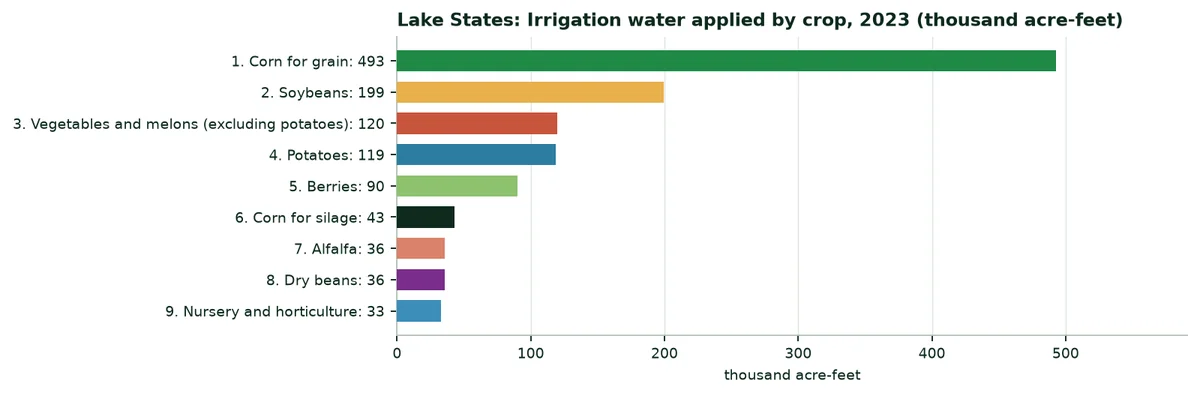
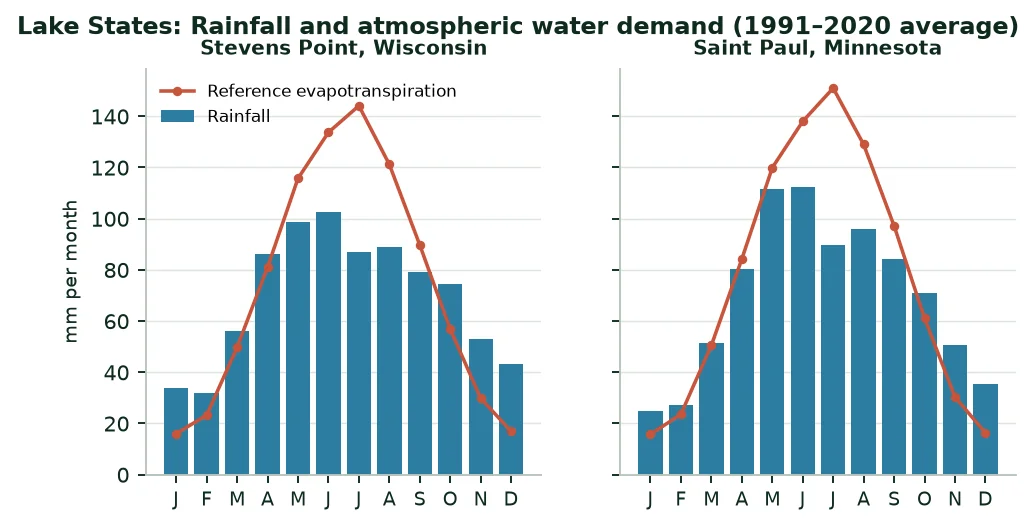
Crops that receive the most water: Corn for grain; soybeans; vegetables and melons (excluding potatoes). First source of saving in the central scenario: Corn for grain (96,059 acre-feet per year). With a summer deficit of 120 mm on average at its two stations, the region is among the least exposed in the country.
11.7 Delta States
States: Arkansas, Louisiana and Mississippi.
The Mississippi Delta grows rice, soybeans, corn and cotton, irrigated by flooding and furrows. Most of the water comes from the Mississippi River Valley alluvial aquifer, whose level is falling in eastern Arkansas. Louisiana also grows sugarcane.
Delta States: Key figures
Indicator | Value | Source (level) |
|---|---|---|
Irrigated acres | 7,664,672 acres, 14.4% of the country | USDA IWMS 2023 (A6, A) |
Farms that irrigate | 6,387 | USDA IWMS 2023 (A6, A) |
Irrigation water applied | 8,034,841 acre-feet (9.91 bn m³), 9.9% of the country | USDA IWMS 2023 (A6, A) |
Water per irrigated acre | 1.05 acre-feet | Calculation |
Water by source | Wells 89%, off-farm suppliers 1%, on-farm surface water 10% | USDA IWMS 2023 (A6, A) |
Irrigation methods (acres) | Sprinkler 9%, gravity 91%, drip 0% | USDA IWMS 2023 (A6, A) |
Energy for pumping | $274 million in 2023 | USDA IWMS 2023 (A6, A) |
Acres hit by interrupted irrigation | 81,648 acres | USDA IWMS 2023 (A6, A) |
Rainfall at Stuttgart / Greenville | 1,245 mm / 1,297 mm per year | ERA5-Land (A12, B) |
Summer deficit at Stuttgart / Greenville | 243 mm / 222 mm, June to August | ERA5-Land (A12, B) |
Radiation at Stuttgart / Greenville | 1,706 / 1,758 kWh/m² per year | PVGIS (A11, A) |
Water saved, central scenario | 926,682 acre-feet per year, 12% of the region's water, 8.6% of the national saving | Calculation (Annex B) |
Range, cautious to strong | 463,341 to 1,853,364 acre-feet per year | Calculation (Annex B) |
Extra production, central scenario | 871,940 tonnes per year | Calculation (Annex B) |
Annual value, central scenario | $335.1 million (water at $94 per acre-foot and yield) | Calculation (Annex B) |
Source: See the « Source » column.
Delta States: State by state
State | Irrigated acres | Water (thousand af) | Af per acre | From wells | Sprinkler / drip | Off-farm water ($/af) | Saved, central (thousand af/yr) |
|---|---|---|---|---|---|---|---|
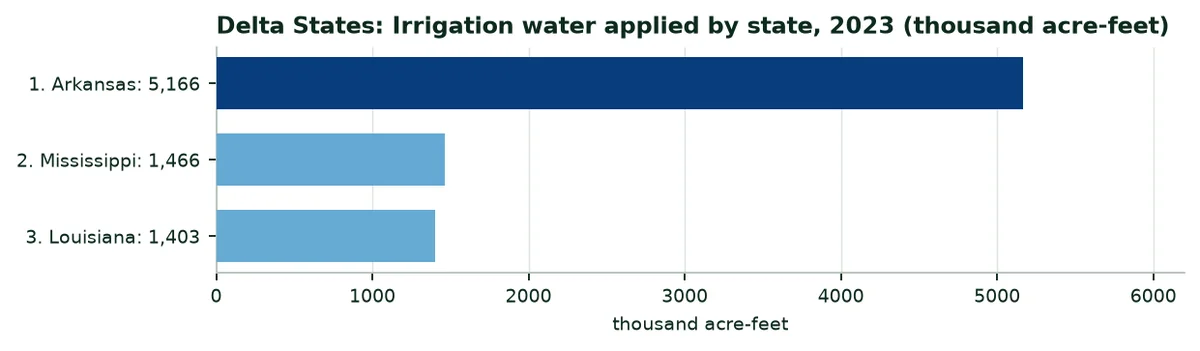
Arkansas | 4,645,925 | 5,166 | 1.1 | 88% | 8% / 0% | 27.24 | 592.7 |
Mississippi | 1,713,175 | 1,466 | 0.9 | 95% | 13% / 0% | 173.45 | 174.5 |
Louisiana | 1,305,572 | 1,403 | 1.1 | 85% | 6% / 0% | 882.55 | 159.4 |
Source: USDA IWMS 2023 (A6); calculation by the author (Annex B). « — »: Figure withheld or not applicable.
Delta States: Water by crop and central saving
Crop | Irrigated acres | Water (thousand af) | Af per acre | Saved, central (thousand af/yr) |
|---|---|---|---|---|
Rice | 1,645,983 | 3,267 | 2.0 | 326.7 |
Soybeans | 3,934,317 | 3,109 | 0.8 | 310.9 |
Corn for grain | 1,444,258 | 1,222 | 0.8 | 238.4 |
Cotton | 522,779 | 427 | 0.8 | 42.7 |
All other crops | 50,228 | 35 | 0.7 | 3.5 |
Peanuts | 24,235 | 17 | 0.7 | 1.7 |
Nursery and horticulture | 13,512 | 9 | 0.7 | 0.9 |
Other hay | 9,078 | 6 | 0.6 | 0.6 |
Irrigated pasture | 5,414 | 2 | 0.4 | 0.2 |
Sorghum | 3,492 | 2 | 0.6 | 0.2 |
Berries | 3,010 | 1 | 0.5 | 0.1 |
Orchards, vineyards and nut trees | 2,774 | 1 | 0.5 | 0.1 |
Source: USDA IWMS 2023 (A6), table 39; crops withheld in a state are estimated from the national water per acre; calculation by the author.
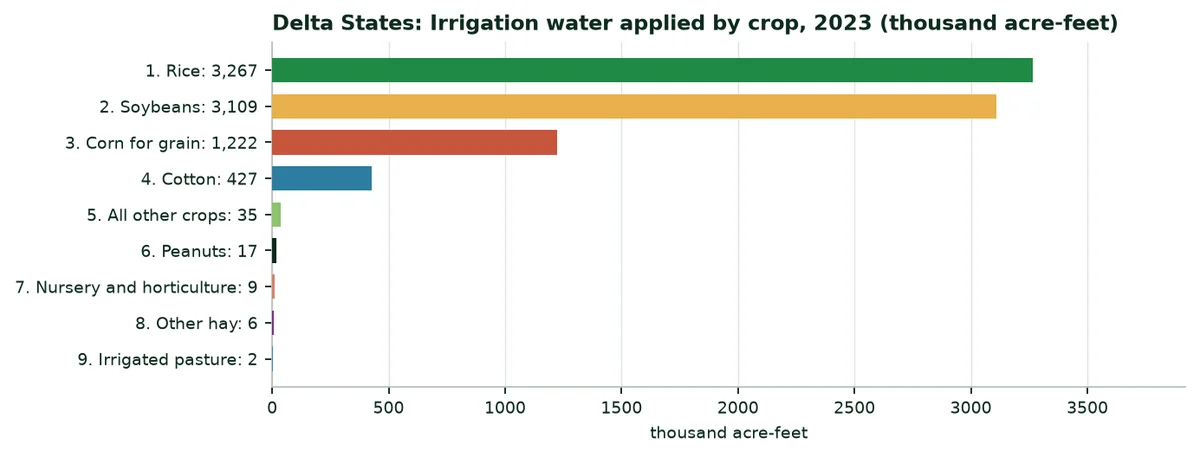
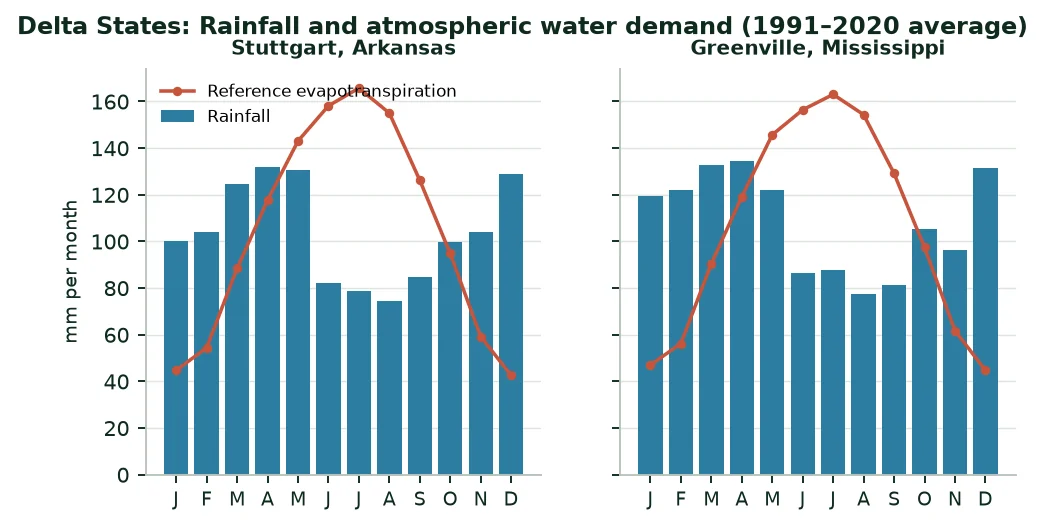
Crops that receive the most water: Rice; soybeans; corn for grain. First source of saving in the central scenario: Rice (326,725 acre-feet per year). With a summer deficit of 232 mm on average at its two stations, the region is in the middle of the country's range.
11.8 Southeast
States: Alabama, Florida, Georgia and South Carolina.
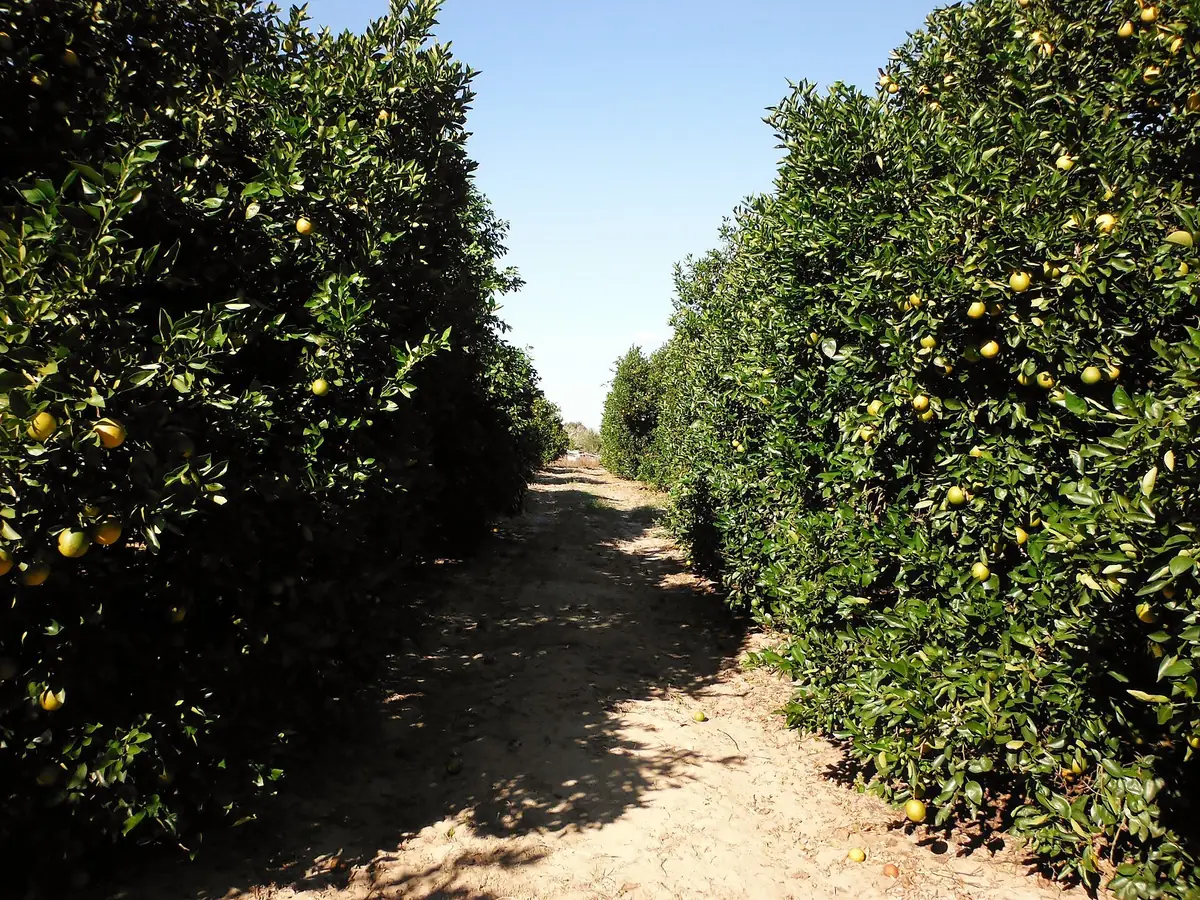
Southwest Georgia irrigates peanuts, cotton and corn with centre pivots supplied by the Floridan aquifer. Florida irrigates citrus, vegetables, sugarcane and nurseries; South Carolina and Alabama irrigate to complete the rain on sandy soils.
Southeast: Key figures
Indicator | Value | Source (level) |
|---|---|---|
Irrigated acres | 2,357,456 acres, 4.4% of the country (figure withheld for Alabama and South Carolina) | USDA IWMS 2023 (A6, A) |
Farms that irrigate | 14,339 | USDA IWMS 2023 (A6, A) |
Irrigation water applied | 2,738,369 acre-feet (3.38 bn m³), 3.4% of the country | USDA IWMS 2023 (A6, A) |
Water per irrigated acre | 1.05 acre-feet (states with published acres) | Calculation |
Water by source | Wells 73%, off-farm suppliers 13%, on-farm surface water 15% | USDA IWMS 2023 (A6, A) |
Irrigation methods (acres) | Sprinkler 63%, gravity 16%, drip 21% | USDA IWMS 2023 (A6, A) |
Energy for pumping | $152 million in 2023 | USDA IWMS 2023 (A6, A) |
Acres hit by interrupted irrigation | 39,444 acres | USDA IWMS 2023 (A6, A) |
Rainfall at Tifton / Immokalee | 1,048 mm / 1,185 mm per year | ERA5-Land (A12, B) |
Summer deficit at Tifton / Immokalee | 119 mm / -179 mm, June to August | ERA5-Land (A12, B) |
Radiation at Tifton / Immokalee | 1,819 / 1,887 kWh/m² per year | PVGIS (A11, A) |
Water saved, central scenario | 365,782 acre-feet per year, 13% of the region's water, 3.4% of the national saving | Calculation (Annex B) |
Range, cautious to strong | 182,891 to 731,565 acre-feet per year | Calculation (Annex B) |
Extra production, central scenario | 639,099 tonnes per year | Calculation (Annex B) |
Annual value, central scenario | $517.9 million (water at $94 per acre-foot and yield) | Calculation (Annex B) |
Source: See the « Source » column.
Southeast: State by state
State | Irrigated acres | Water (thousand af) | Af per acre | From wells | Sprinkler / drip | Off-farm water ($/af) | Saved, central (thousand af/yr) |
|---|---|---|---|---|---|---|---|
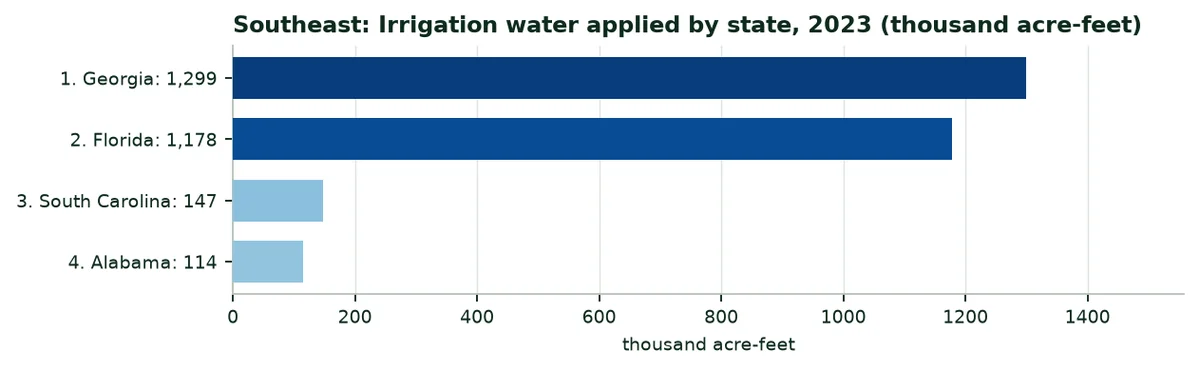
Georgia | 1,221,632 | 1,299 | 1.1 | 83% | 90% / 9% | 229.64 | 185.1 |
Florida | 1,135,824 | 1,178 | 1.0 | 60% | 26% / 36% | 42.15 | 142.3 |
South Carolina | — | 147 | 0.8 | 88% | 89% / 11% | 2,315.31 | 23.5 |
Alabama | — | 114 | 0.7 | 61% | 96% / 2% | 55.52 | 14.8 |
Source: USDA IWMS 2023 (A6); calculation by the author (Annex B). « — »: Figure withheld or not applicable.
Southeast: Water by crop and central saving
Crop | Irrigated acres | Water (thousand af) | Af per acre | Saved, central (thousand af/yr) |
|---|---|---|---|---|
Orchards, vineyards and nut trees | 478,964 | 546 | 1.1 | 54.6 |
Corn for grain | 422,409 | 425 | 1.0 | 82.8 |
Peanuts | 385,421 | 392 | 1.0 | 39.2 |
Cotton | 390,993 | 350 | 0.9 | 35.0 |
All other crops | 382,547 | 265 | 0.7 | 26.5 |
Nursery and horticulture | 161,730 | 249 | 1.5 | 24.9 |
Vegetables and melons (excluding potatoes) | 183,713 | 223 | 1.2 | 67.4 |
Other hay | 49,154 | 59 | 1.2 | 5.9 |
Wheat | 38,825 | 44 | 1.1 | 4.4 |
Berries | 31,837 | 39 | 1.2 | 3.9 |
Soybeans | 78,225 | 35 | 0.4 | 3.5 |
Corn for silage | 18,965 | 30 | 1.6 | 5.9 |
Source: USDA IWMS 2023 (A6), table 39; crops withheld in a state are estimated from the national water per acre; calculation by the author.
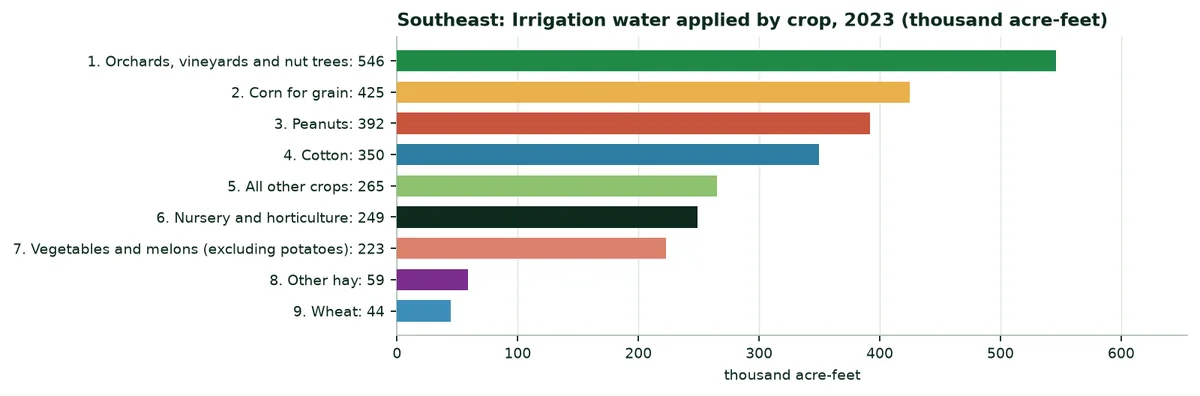
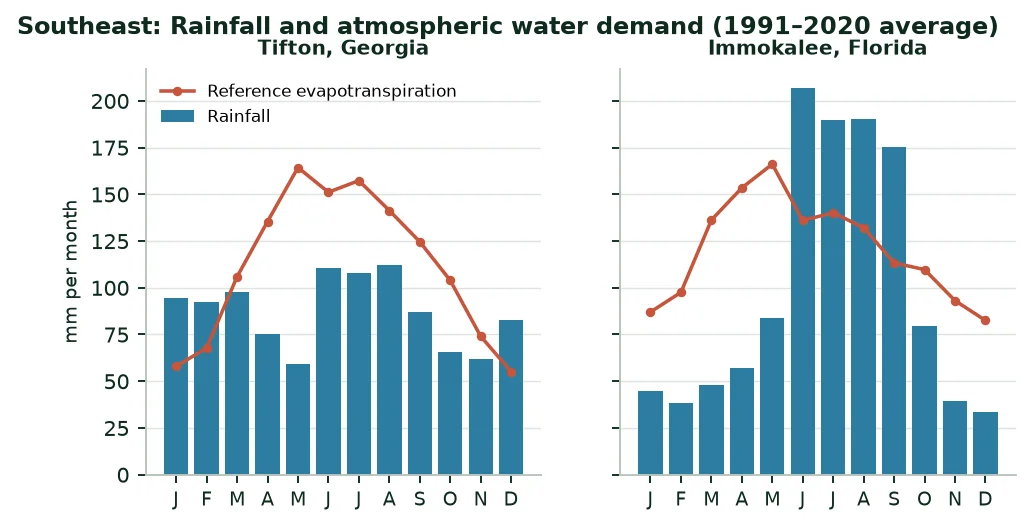
Crops that receive the most water: Orchards, vineyards and nut trees; corn for grain; peanuts. First source of saving in the central scenario: Corn for grain (82,802 acre-feet per year). With a summer deficit of -30 mm on average at its two stations, the region is among the least exposed in the country.
11.9 Appalachian
States: Kentucky, North Carolina, Tennessee, Virginia and West Virginia.
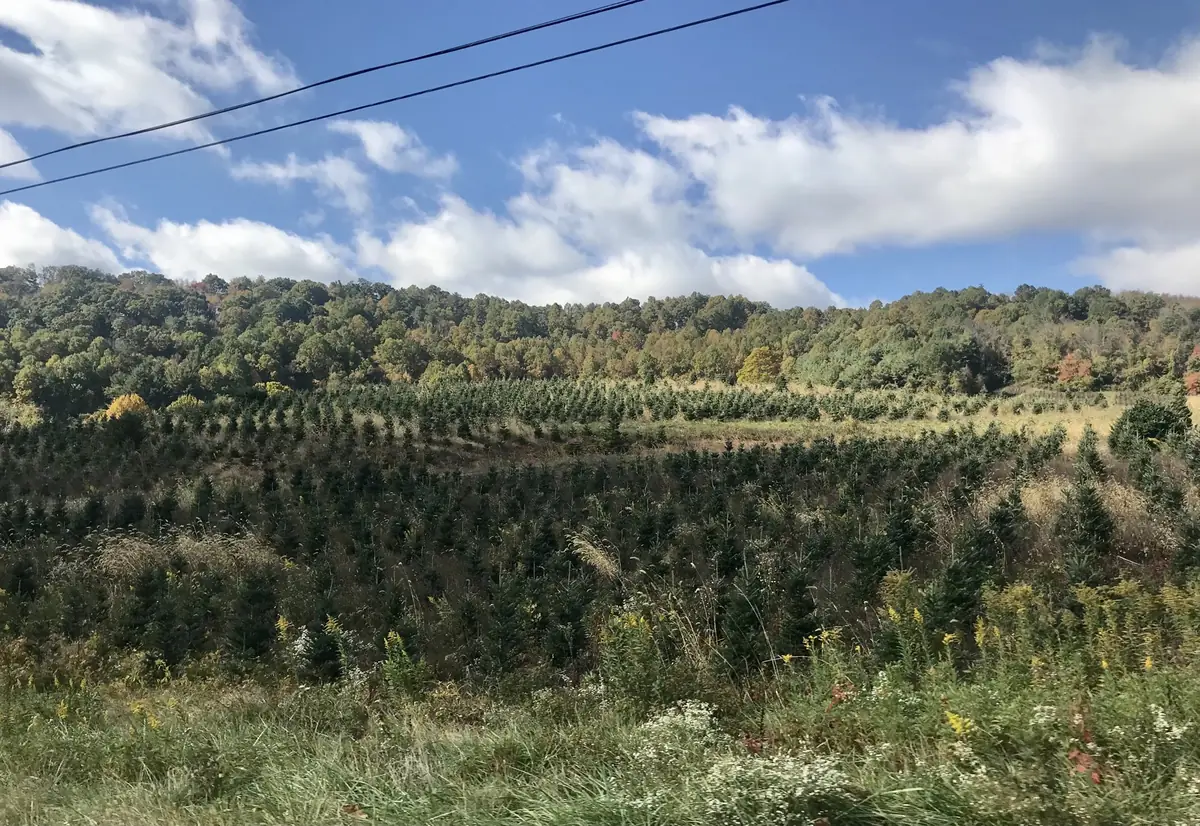
Tobacco, vegetables, nurseries, soybeans and corn. Most crops are rain-fed; irrigation completes the rain for vegetables, nurseries, Christmas trees and some row crops in the dry weeks of summer.
Appalachian: Key figures
Indicator | Value | Source (level) |
|---|---|---|
Irrigated acres | 406,602 acres, 0.8% of the country (figure withheld for Virginia) | USDA IWMS 2023 (A6, A) |
Farms that irrigate | 7,471 | USDA IWMS 2023 (A6, A) |
Irrigation water applied | 281,164 acre-feet (0.35 bn m³), 0.3% of the country | USDA IWMS 2023 (A6, A) |
Water per irrigated acre | 0.61 acre-feet (states with published acres) | Calculation |
Water by source | Wells 57%, off-farm suppliers 6%, on-farm surface water 37% | USDA IWMS 2023 (A6, A) |
Irrigation methods (acres) | Sprinkler 93%, gravity 1%, drip 6% | USDA IWMS 2023 (A6, A) |
Energy for pumping | $23 million in 2023 | USDA IWMS 2023 (A6, A) |
Acres hit by interrupted irrigation | 19,680 acres | USDA IWMS 2023 (A6, A) |
Rainfall at Raleigh / Lexington | 1,163 mm / 1,214 mm per year | ERA5-Land (A12, B) |
Summer deficit at Raleigh / Lexington | 97 mm / 115 mm, June to August | ERA5-Land (A12, B) |
Radiation at Raleigh / Lexington | 1,658 / 1,533 kWh/m² per year | PVGIS (A11, A) |
Water saved, central scenario | 44,473 acre-feet per year, 16% of the region's water, 0.4% of the national saving | Calculation (Annex B) |
Range, cautious to strong | 22,237 to 88,947 acre-feet per year | Calculation (Annex B) |
Extra production, central scenario | 199,717 tonnes per year | Calculation (Annex B) |
Annual value, central scenario | $137.4 million (water at $94 per acre-foot and yield) | Calculation (Annex B) |
Source: See the « Source » column.
Appalachian: State by state
State | Irrigated acres | Water (thousand af) | Af per acre | From wells | Sprinkler / drip | Off-farm water ($/af) | Saved, central (thousand af/yr) |
|---|---|---|---|---|---|---|---|
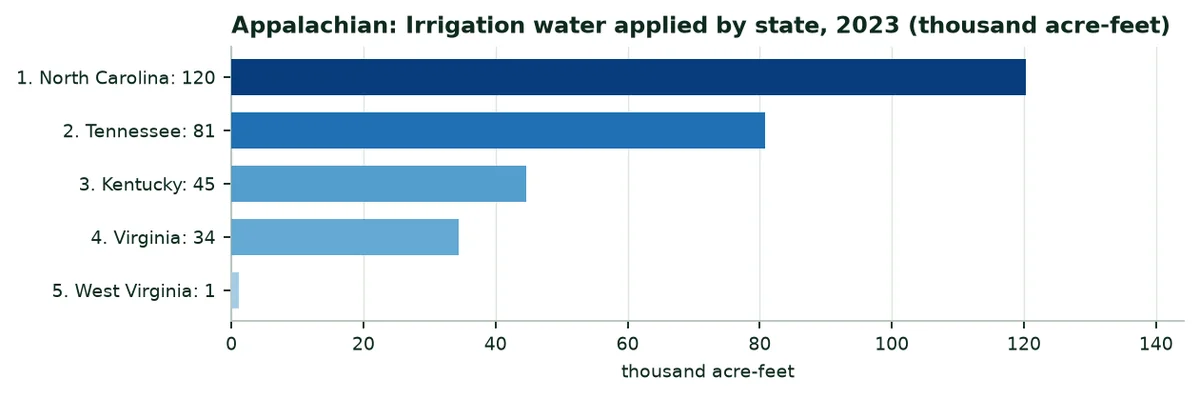
North Carolina | 150,265 | 120 | 0.8 | 48% | 91% / 9% | 277.98 | 17.8 |
Tennessee | 173,528 | 81 | 0.5 | 91% | 95% / 4% | 198.31 | 13.9 |
Kentucky | 81,034 | 45 | 0.5 | 51% | 97% / 3% | 177.22 | 6.8 |
Virginia | — | 34 | 0.6 | 15% | 90% / 10% | 1,256.00 | 5.8 |
West Virginia | 1,775 | 1 | 0.5 | 54% | 39% / 52% | 157.09 | 0.2 |
Source: USDA IWMS 2023 (A6); calculation by the author (Annex B). « — »: Figure withheld or not applicable.
Appalachian: Water by crop and central saving
Crop | Irrigated acres | Water (thousand af) | Af per acre | Saved, central (thousand af/yr) |
|---|---|---|---|---|
Corn for grain | 156,122 | 72 | 0.5 | 13.9 |
Nursery and horticulture | 34,288 | 46 | 1.3 | 4.6 |
Soybeans | 113,126 | 40 | 0.4 | 4.0 |
Vegetables and melons (excluding potatoes) | 48,724 | 39 | 0.8 | 11.7 |
Cotton | 43,030 | 20 | 0.5 | 2.0 |
Wheat | 14,510 | 16 | 1.1 | 1.6 |
Berries | 14,113 | 12 | 0.9 | 1.2 |
Peanuts | 7,258 | 9 | 1.3 | 0.9 |
Other hay | 7,831 | 8 | 1.0 | 0.8 |
Corn for silage | 4,774 | 6 | 1.2 | 1.1 |
Other irrigated land (not itemised) | — | 5 | — | 0.5 |
Potatoes | 6,000 | 4 | 0.7 | 1.1 |
Source: USDA IWMS 2023 (A6), table 39; crops withheld in a state are estimated from the national water per acre; calculation by the author.
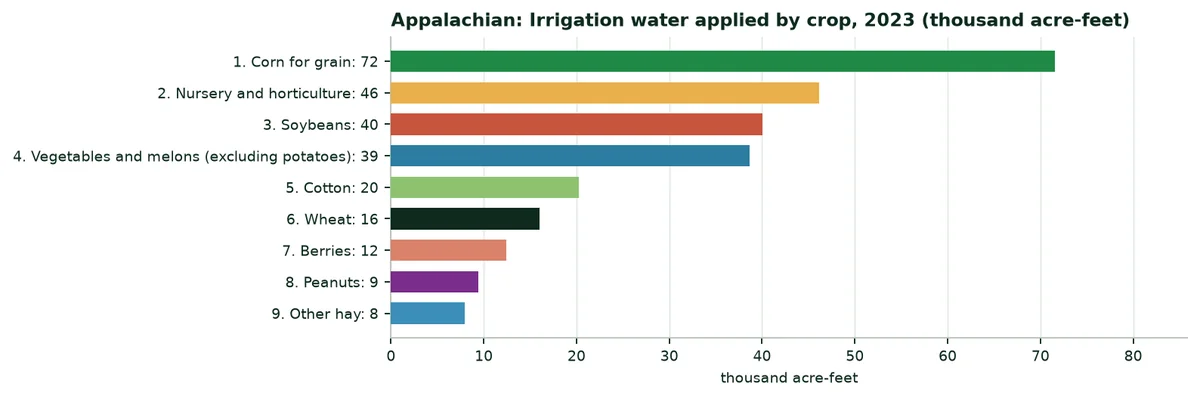
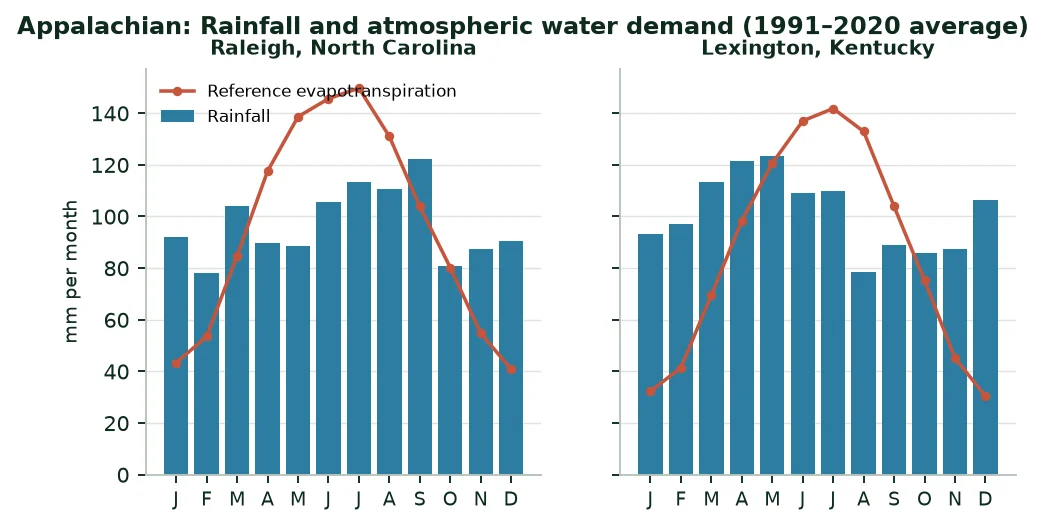
Crops that receive the most water: Corn for grain; nursery and horticulture; soybeans. First source of saving in the central scenario: Corn for grain (13,949 acre-feet per year). With a summer deficit of 106 mm on average at its two stations, the region is among the least exposed in the country.
11.10 Northeast
States: Connecticut, Delaware, Maine, Maryland, Massachusetts, New Hampshire, New Jersey, New York, Pennsylvania, Rhode Island and Vermont.
Dairy farms, vegetables, orchards and nurseries, and potatoes in Maine. Irrigation is concentrated on the Delmarva peninsula (corn, soybeans, vegetables), in New Jersey and in the vegetable and fruit areas of New York and Pennsylvania.
Northeast: Key figures
Indicator | Value | Source (level) |
|---|---|---|
Irrigated acres | 152,335 acres, 0.3% of the country (figure withheld for Delaware, Maine, Maryland, Massachusetts and Rhode Island) | USDA IWMS 2023 (A6, A) |
Farms that irrigate | 10,898 | USDA IWMS 2023 (A6, A) |
Irrigation water applied | 258,612 acre-feet (0.32 bn m³), 0.3% of the country | USDA IWMS 2023 (A6, A) |
Water per irrigated acre | 0.58 acre-feet (states with published acres) | Calculation |
Water by source | Wells 70%, off-farm suppliers 5%, on-farm surface water 24% | USDA IWMS 2023 (A6, A) |
Irrigation methods (acres) | Sprinkler 79%, gravity 3%, drip 18% | USDA IWMS 2023 (A6, A) |
Energy for pumping | $46 million in 2023 | USDA IWMS 2023 (A6, A) |
Acres hit by interrupted irrigation | 14,367 acres | USDA IWMS 2023 (A6, A) |
Rainfall at Harrisburg / Albany | 1,064 mm / 1,116 mm per year | ERA5-Land (A12, B) |
Summer deficit at Harrisburg / Albany | 144 mm / 84 mm, June to August | ERA5-Land (A12, B) |
Radiation at Harrisburg / Albany | 1,459 / 1,381 kWh/m² per year | PVGIS (A11, A) |
Water saved, central scenario | 42,581 acre-feet per year, 16% of the region's water, 0.4% of the national saving | Calculation (Annex B) |
Range, cautious to strong | 21,290 to 85,161 acre-feet per year | Calculation (Annex B) |
Extra production, central scenario | 227,266 tonnes per year | Calculation (Annex B) |
Annual value, central scenario | $166.8 million (water at $94 per acre-foot and yield) | Calculation (Annex B) |
Source: See the « Source » column.
Northeast: State by state
State | Irrigated acres | Water (thousand af) | Af per acre | From wells | Sprinkler / drip | Off-farm water ($/af) | Saved, central (thousand af/yr) |
|---|---|---|---|---|---|---|---|
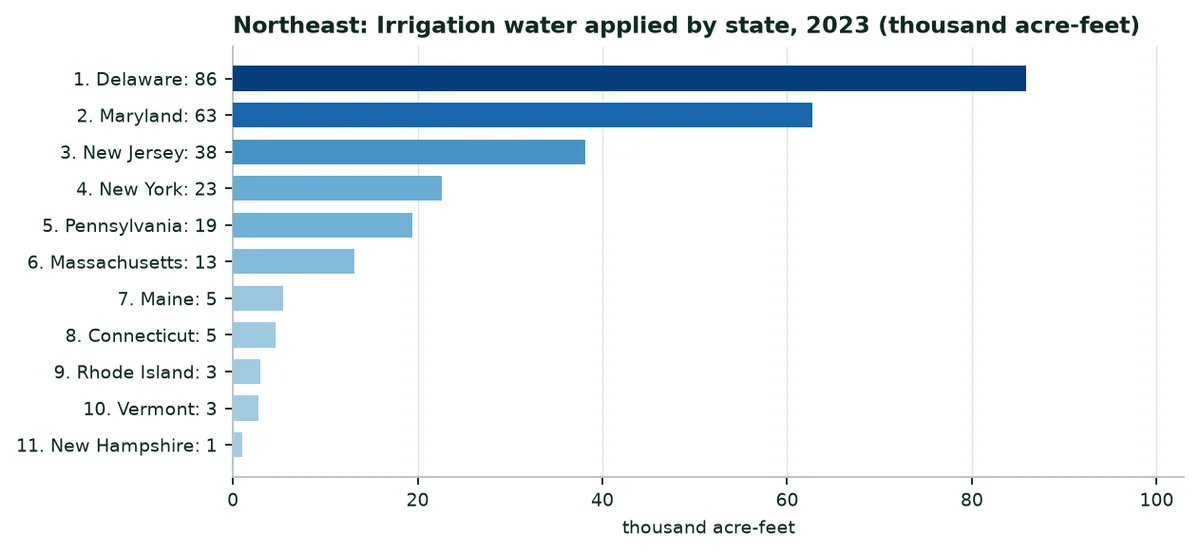
Delaware | — | 86 | 0.6 | 93% | 97% / 3% | — | 15.2 |
Maryland | — | 63 | 0.5 | 77% | 91% / 9% | 905.00 | 10.0 |
New Jersey | 69,373 | 38 | 0.6 | 79% | 67% / 26% | 132.67 | 6.1 |
New York | 47,118 | 23 | 0.5 | 51% | 43% / 52% | 581.13 | 3.6 |
Pennsylvania | 28,104 | 19 | 0.7 | 28% | 45% / 51% | 170.30 | 3.6 |
Massachusetts | — | 13 | 0.7 | 12% | 63% / 18% | 353.21 | 1.5 |
Maine | — | 5 | 0.3 | 37% | 89% / 10% | 605.00 | 1.0 |
Connecticut | 3,645 | 5 | 1.2 | 18% | 48% / 50% | 1,204.09 | 0.7 |
Rhode Island | — | 3 | 0.8 | 40% | 80% / 12% | 1,902.99 | 0.3 |
Vermont | 2,330 | 3 | 1.1 | 24% | 28% / 48% | — | 0.4 |
New Hampshire | 1,765 | 1 | 0.6 | 25% | 59% / 32% | 583.33 | 0.2 |
 Source: USDA IWMS 2023 (A6); calculation by the author (Annex B). « — »: Figure withheld or not applicable.
Northeast: Water by crop and central saving
Crop | Irrigated acres | Water (thousand af) | Af per acre | Saved, central (thousand af/yr) |
|---|---|---|---|---|
Corn for grain | 135,327 | 73 | 0.5 | 14.2 |
Nursery and horticulture | 62,568 | 44 | 0.7 | 4.4 |
Vegetables and melons (excluding potatoes) | 61,575 | 43 | 0.7 | 13.0 |
Soybeans | 94,375 | 42 | 0.4 | 4.2 |
Berries | 37,688 | 19 | 0.5 | 1.9 |
Orchards, vineyards and nut trees | 21,433 | 12 | 0.5 | 1.2 |
Other irrigated land (not itemised) | — | 6 | — | 0.6 |
All other crops | 11,594 | 5 | 0.4 | 0.5 |
Wheat | 18,425 | 4 | 0.2 | 0.4 |
Potatoes | 8,531 | 4 | 0.4 | 1.0 |
Corn for silage | 5,139 | 3 | 0.7 | 0.7 |
Idle, fallow or failed land | 2,983 | 3 | 1.0 | 0.3 |
Source: USDA IWMS 2023 (A6), table 39; crops withheld in a state are estimated from the national water per acre; calculation by the author.
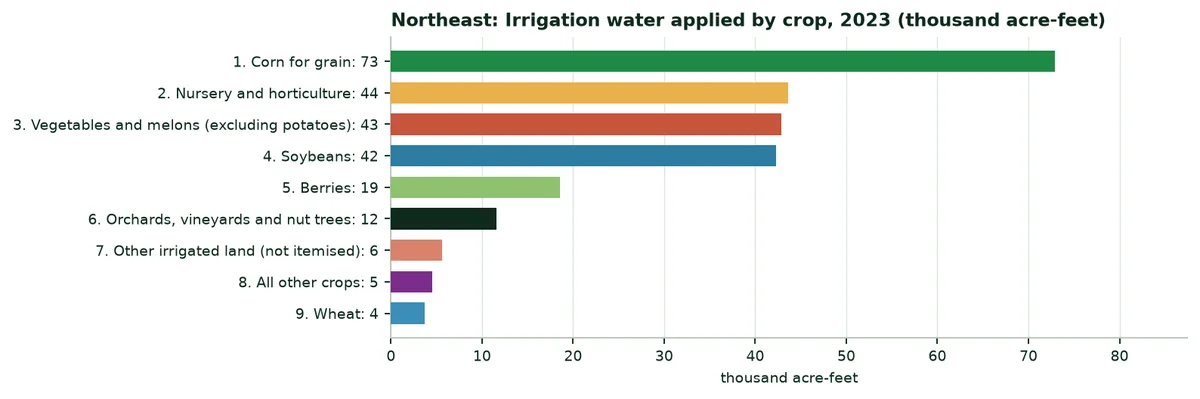
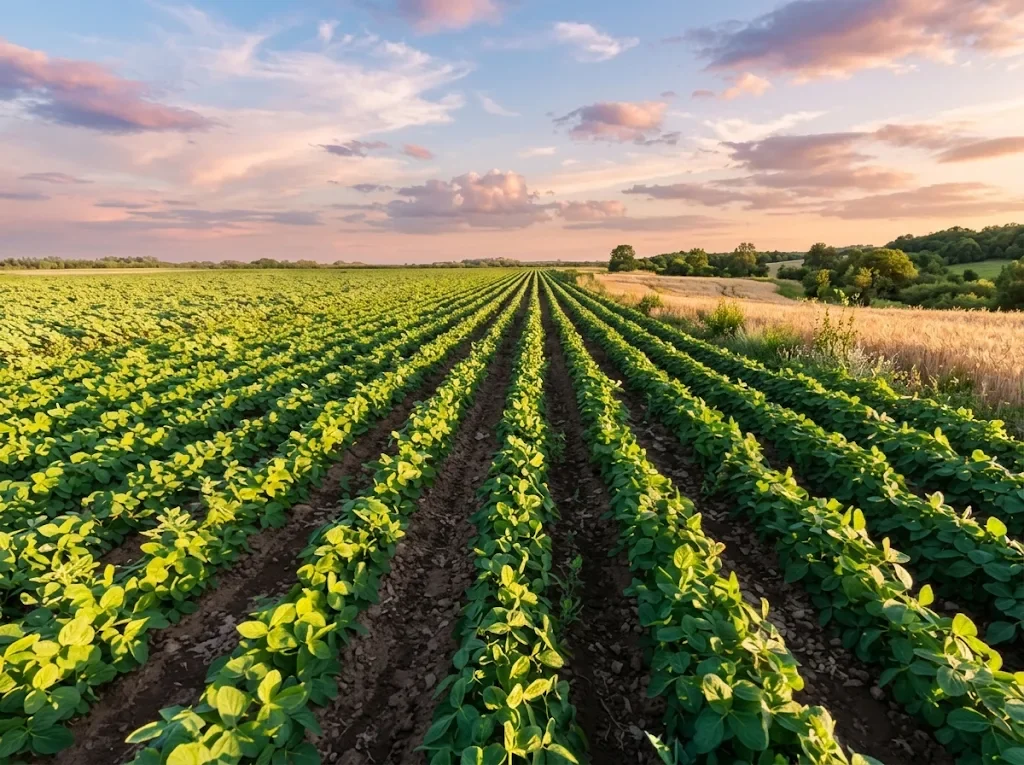 Figure 54. Northeast: Irrigation water applied by crop, 2023 (thousand acre-feet). Source: USDA IWMS (A6)
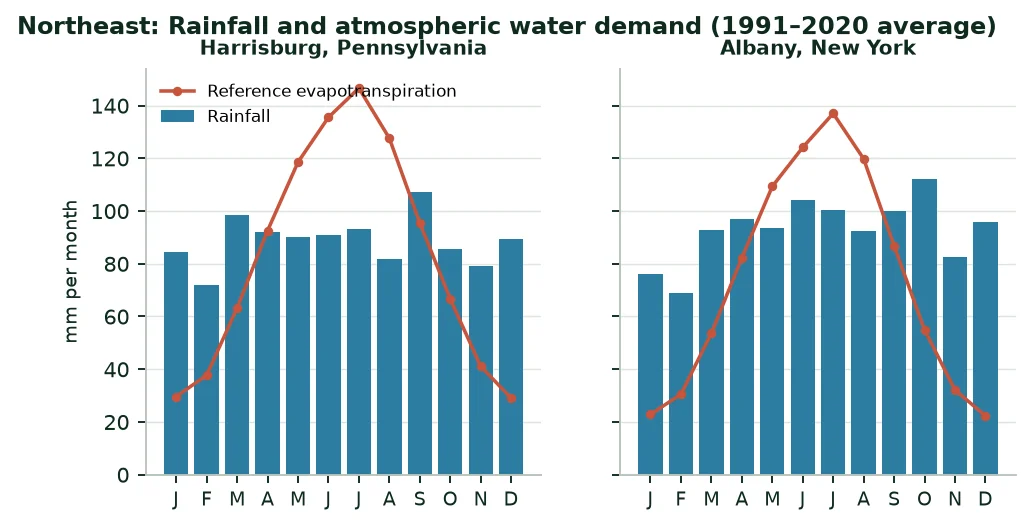
Crops that receive the most water: Corn for grain; nursery and horticulture; vegetables and melons (excluding potatoes). First source of saving in the central scenario: Corn for grain (14,211 acre-feet per year). With a summer deficit of 114 mm on average at its two stations, the region is among the least exposed in the country.
12. Limits and points to complete
Annex A. Sources and confidence levels
List of sources
Ref. | Source | Publisher or author | Vintage | Level | Link or reference |
|---|---|---|---|---|---|
A1 | World Development Indicators (WDI) | World Bank | 2021–2025 | A | api.worldbank.org |
A2 | Crop production (QCL) | FAO, FAOSTAT | 2023 | A | fao.org/faostat |
A3 | Trade in agricultural products (TCL) | FAO, FAOSTAT | 2021–2024 | A | fao.org/faostat |
A4 | Land use (RL) | FAO, FAOSTAT | 2010–2023 | A | fao.org/faostat |
A5 | Fertilisers by nutrient (RFN) | FAO, FAOSTAT | 2010–2024 | A | fao.org/faostat |
A6 | 2023 Irrigation and Water Management Survey; 2022 Census of Agriculture | USDA, National Agricultural Statistics Service | 2022–2023 | A | nass.usda.gov |
A7 | Value of agricultural production (QV) | FAO, FAOSTAT | 2023 | A | fao.org/faostat |
A8 | Farm production regions | USDA, Economic Research Service | — | A | ers.usda.gov |
A9 | Water-level and recoverable water in storage changes, High Plains aquifer, predevelopment to 2019 (SIR 2023-5143) | US Geological Survey | 2023 | A | pubs.usgs.gov |
A10 | Colorado River shortage declaration for 2022; Arizona fact sheet | Bureau of Reclamation; Arizona Department of Water Resources | 2021 | A | usbr.gov; azwater.gov |
A11 | PVGIS 5.2, monthly radiation | European Commission, JRC | 2005–2020 | A | re.jrc.ec.europa.eu/pvg_tools |
A12 | ERA5-Land reanalysis, daily rainfall and evapotranspiration | European Centre (ECMWF), via Open-Meteo | 1991–2020 | B | open-meteo.com |
A13 | Commodity Price Data (Pink Sheet) | World Bank | 2019–2024 | A | worldbank.org/commodities |
A14 | Fifth National Climate Assessment, chapter 2 | US Global Change Research Program | 2023 | A | nca5.globalchange.gov |
A15 | Administrative boundaries | Natural Earth (public domain) | Version 5 | A | naturalearthdata.com |
A20 | Date palms, Dubai | ICBA | 2020–2021 | B | Green Solutions website, trials |
A21 | Watermelons, Hermosillo (Mexico) | Green Solutions | 2023 | C | Green Solutions website, trials |
A22 | Maize, Konya (Turkey) | Green Solutions, D.I.S. and TIGEM | 2025 | C | Green Solutions website, trials |
A23 | Potatoes, Bloemfontein (South Africa) | Afrinest Farm Group | 2025–2026 | C | Green Solutions website, trials |
A24 | Soybean, Shandong (China) | Shandong Institute of Soil and Fertiliser | Undated | B | Green Solutions website, trials |
A25 | ECOFERT® certificate | SOHISCERT | Current | A | Green Solutions website |
A26 | Claimed performance, doses and uses | Green Solutions | 2026 | C | Green Solutions website |
A27 | Calculations in this dossier | Author of the dossier | — | — | Annex B |
A28 | Photographs | NASA, USDA and Wikimedia Commons contributors | — | — | Public domain or CC0, commons.wikimedia.org |
Annex B. Calculation method
Radiation. Sum of the monthly horizontal radiation values from PVGIS, divided by the number of years, at each of the twenty stations.
Rainfall and evapotranspiration. 1991–2020 averages of the daily ERA5-Land values at each station; summer deficit = reference evapotranspiration minus rainfall, June to August.
Irrigation water. Water applied in the open from all sources in 2023 (USDA IWMS, table 7): 80,937,415 acre-feet nationally, and the same figure for each state.
Water by crop. Irrigated acres harvested × average acre-feet applied per acre, for each crop and each state (table 39). Vegetables = all vegetables minus potatoes. When a state's water per acre is withheld, the national value for the crop is used. Water not itemised = state total minus the sum of the crops.
Water saved. Water of the crop × water saving of the scenario.
Yield gain. Irrigated acres × 0.405 × national yield 2023 (FAOSTAT) × gain of the scenario.
Value created. Water saved in acre-feet × value of water ($54.22, $94.48 or $150) + yield gain × implicit 2023 price (value of production ÷ production).
Scenarios. Cautious: 25% of the trial effect. Central: 50%. Strong: Published effect. Crops without a trial: 5%, 10% and 20% water saving, without yield gain.
Regions. Sum of the states of each USDA farm production region; Alaska and Hawaii are counted in the Pacific region.
Fertiliser spending. Nitrogen ÷ 0.46 × urea price + phosphate ÷ 0.46 × TSP price + potash ÷ 0.60 × potassium chloride price, at World Bank international prices. It is a lower bound.
General limits. One coefficient per crop; national yields and prices; no product cost is included in the calculations of the dossier.
Tell us about your field
Crop, irrigation method, soil type, and the water volume you apply today. We come back with the matching combination of technologies, the dosing, and the trials already run in comparable conditions.
A first conversation commits you to nothing.
Tell us about your fieldcontact@green-solutions-group.com · Green Solutions Groupe AIM SA, 46, route de la Condémine, 1475 Forel, Switzerland
Photo credits
- USDAgov — Public domain, « 20090914-USDA-OC-PSD-0003 Agriculture in the United States »
Photographs from Wikimedia Commons, reused under their stated licences.