MARKET DOSSIER
South Sudan
REPUBLIC OF SOUTH SUDAN
Sorghum, maize, cassava and vegetables in a country of floods and dry spells.
Where hydro-retention helps, and where drainage must come first.
Foreword
This dossier describes South Sudan from the angle of water, climate, fertilisers and crops. It is written for the ministries in charge of agriculture, water and trade, the regional directorates of agriculture, cooperatives and producer organisations. It answers three questions: Where is water short, for which crops, and in which regions? It then examines what our products can change, in rainfed as well as irrigated farming, and what that can mean for the country's external trade.
Reading the sources. Every figure refers to a source, named in the text and detailed in Annex A. Each source carries a confidence level:
Summary
The points below summarise the dossier. The figures come from public sources: The World Bank, FAO (FAOSTAT, AQUASTAT), South Sudanese public bodies (National Bureau of Statistics, Ministry of Agriculture and Food Security, revenue authority), PVGIS and NASA POWER. The production gains and water savings are scenarios, described in Annex B.
12.19 M Inhabitants in 2025 (World Bank) | 1.02 M ha Of sorghum harvested in 2024, the main crop | 19,000 ha Equipped for irrigation (2024) |
+825 t Of maize per 10,000 ha treated, central scenario | 54.3 Mm³ Of irrigation water saved a year, central scenario | 36 M$ Of agricultural exports in 2023 (FAOSTAT) |
Key figures
Key indicators for South Sudan
Indicator | Value | Year | Source (level) |
|---|---|---|---|
Population | 12.19 M | 2025 | World Bank (A1) |
GDP per capita | 1,080 $ | 2015 | World Bank (A1) |
Agriculture share of GDP | 10.4% | 2015 | World Bank (A1) |
Agricultural employment | 63.8% | 2023 | World Bank (A1) |
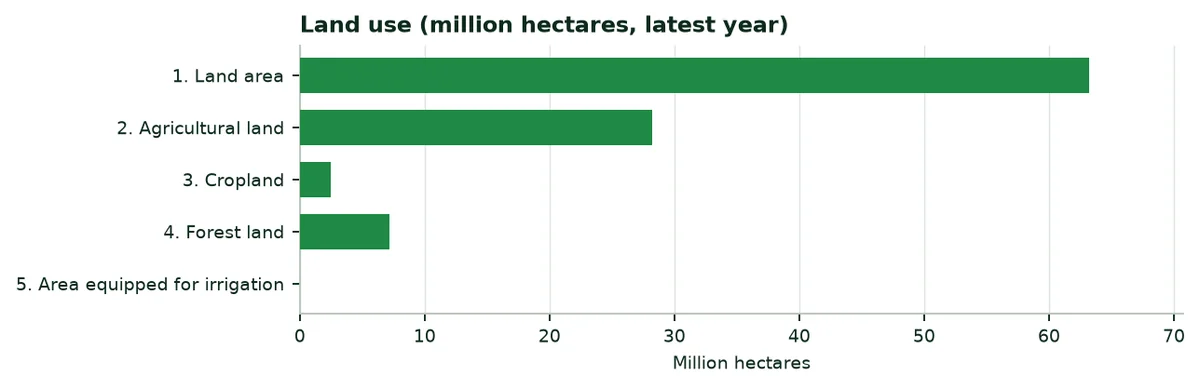
Cropland | 2,477,890 ha | 2024 | FAOSTAT (A6) |
Area equipped for irrigation | 19,000 ha | 2024 | FAOSTAT (A6) |
Harvested area: Sorghum | 1,018,687 ha | 2024 | FAOSTAT (A2) |
Agricultural exports | 36 M$ | 2023 | FAOSTAT (A4) |
Agricultural imports | 613 M$ | 2023 | FAOSTAT (A4) |
Mineral nitrogen, agricultural use | 206 t | 2024 | FAOSTAT (A5) |
Source: Table based on the sources indicated.
1. Green Solutions and our products
Green Solutions develops products for water, fertilisation and crop protection. Four families are of interest to this dossier. The yields cited are those published by the manufacturer or by the trials, with their confidence level.
Products covered by this dossier
Product | Claimed use | Published evidence (level) |
|---|---|---|
EVERGREEN® (water-retention polymer) | Holds rain or irrigation water as a gel, near the roots. | Trials on maize, potato, watermelon, date palm and soybean. Level B to C. |
ECOSORB® (water-retention polymer based on corn starch) | Same use; action lasting 2 to 3 years according to the website. | Soybean trial (China); laboratory acrylamide analysis. Level B to C. |
ECOFERT® (fertiliser) | Fertiliser certified by SOHISCERT and EU Bio, usable in organic farming. | Published certificate; potato trial combined with EVERGREEN®. Level A (certificate), C (results). |
Paulownia ALTIFOLIA® | Fast-growing tree for agroforestry. | Website figures; no trial in South Sudan. Level C. |
Water Vital®, NAPEMA® | Outside the scope of this dossier. | No independent source in the documents consulted. |
Source: Green Solutions website (product sheets and published trials), Annex A.
The indicative dose published on the website is 30 to 75 kg/ha.
2. South Sudan in figures
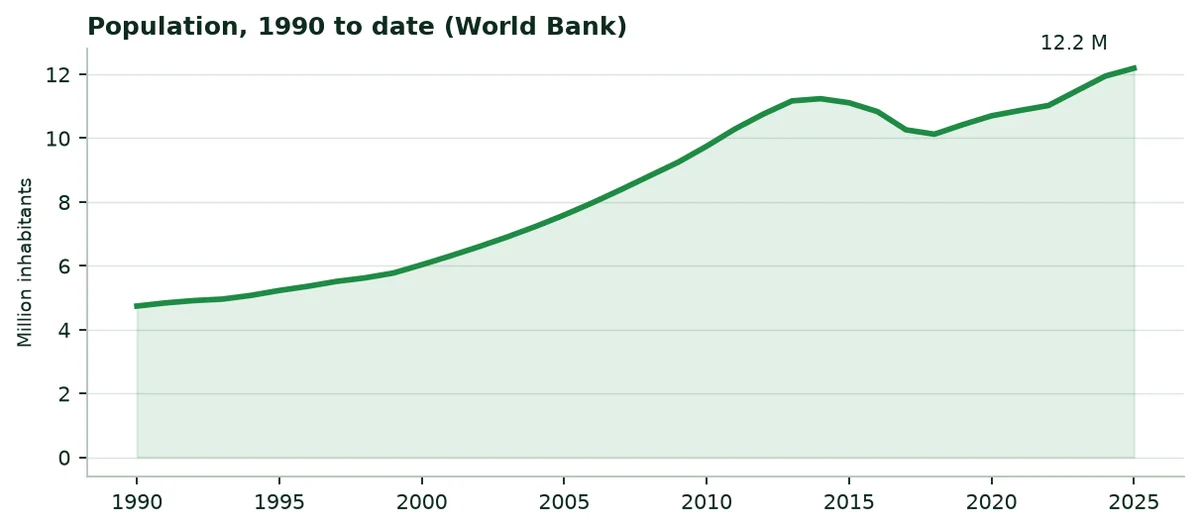
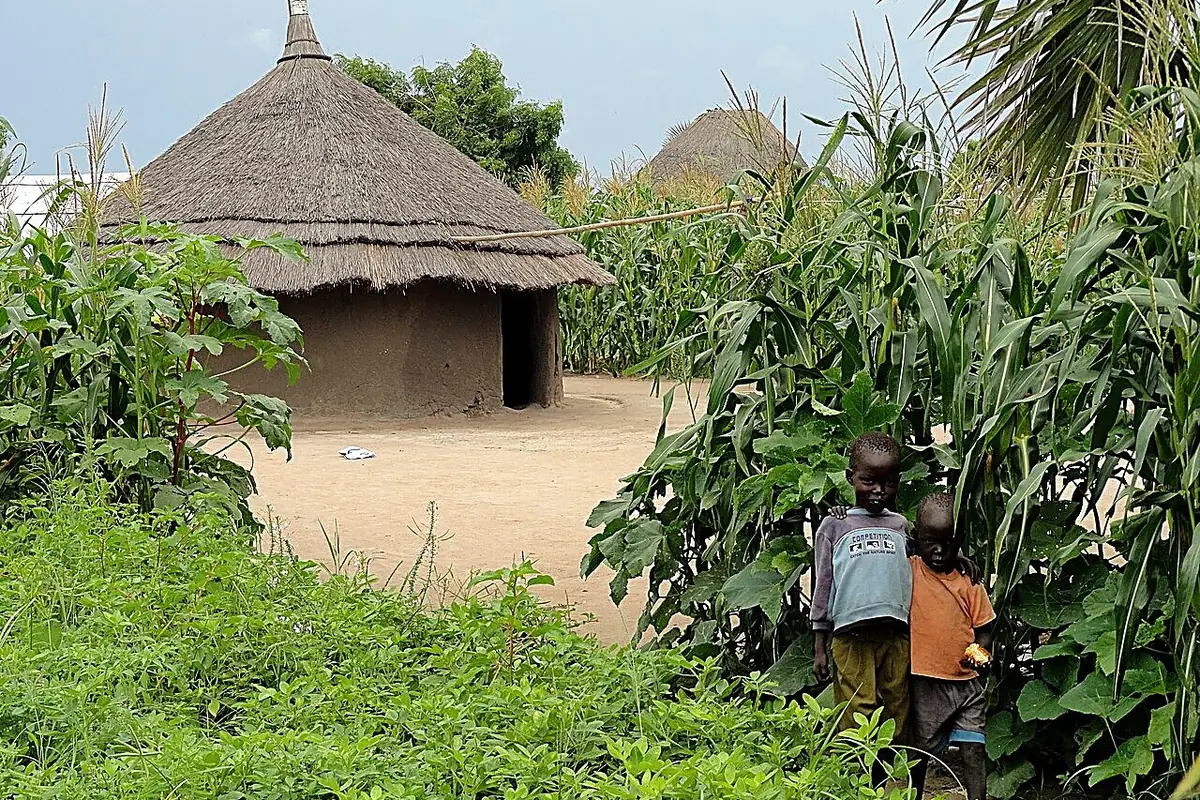
South Sudan had 12.19 million inhabitants in 2025, 78% of them in rural areas. Agriculture accounts for 10.4% of gross domestic product and employs 64% of the labour force. The country covers 631.9 thousand km², of which 45% is agricultural land. Undernourishment affects 19.1% of the population.
Agricultural and water indicators, latest year published
Indicator | Value | Year | Source |
|---|---|---|---|
Average cereal yield | 945 kg/ha | 2024 | World Bank (A1) |
Fertiliser use per hectare of arable land | 0.1 kg/ha | 2024 | World Bank (A1) |
Water withdrawals, agricultural share | 36.5% | 2022 | World Bank (A1) |
Internal freshwater resources | 26.0 km³ | 2022 | World Bank (A1) |
Internal resources per inhabitant | 2,359 m³ | 2022 | World Bank (A1) |
3. Sunshine, rainfall and climate change
3.1 Sunshine
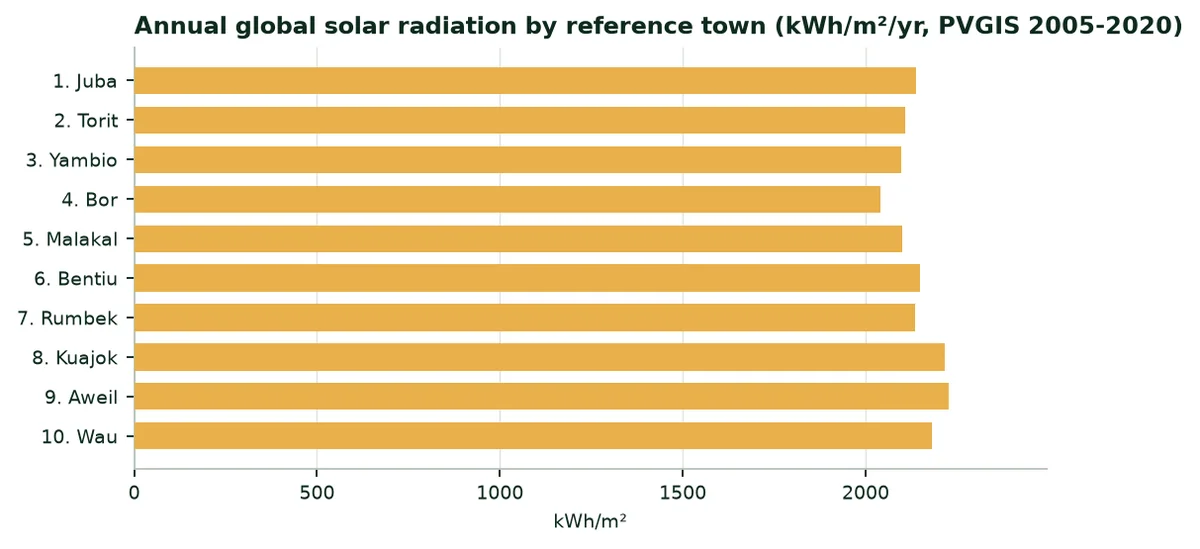
Global solar radiation reaches 2,042 to 2,227 kWh/m² a year depending on the region. Energy is not the limit: Water available at the right time makes the harvest.
3.2 Rainfall and evapotranspiration
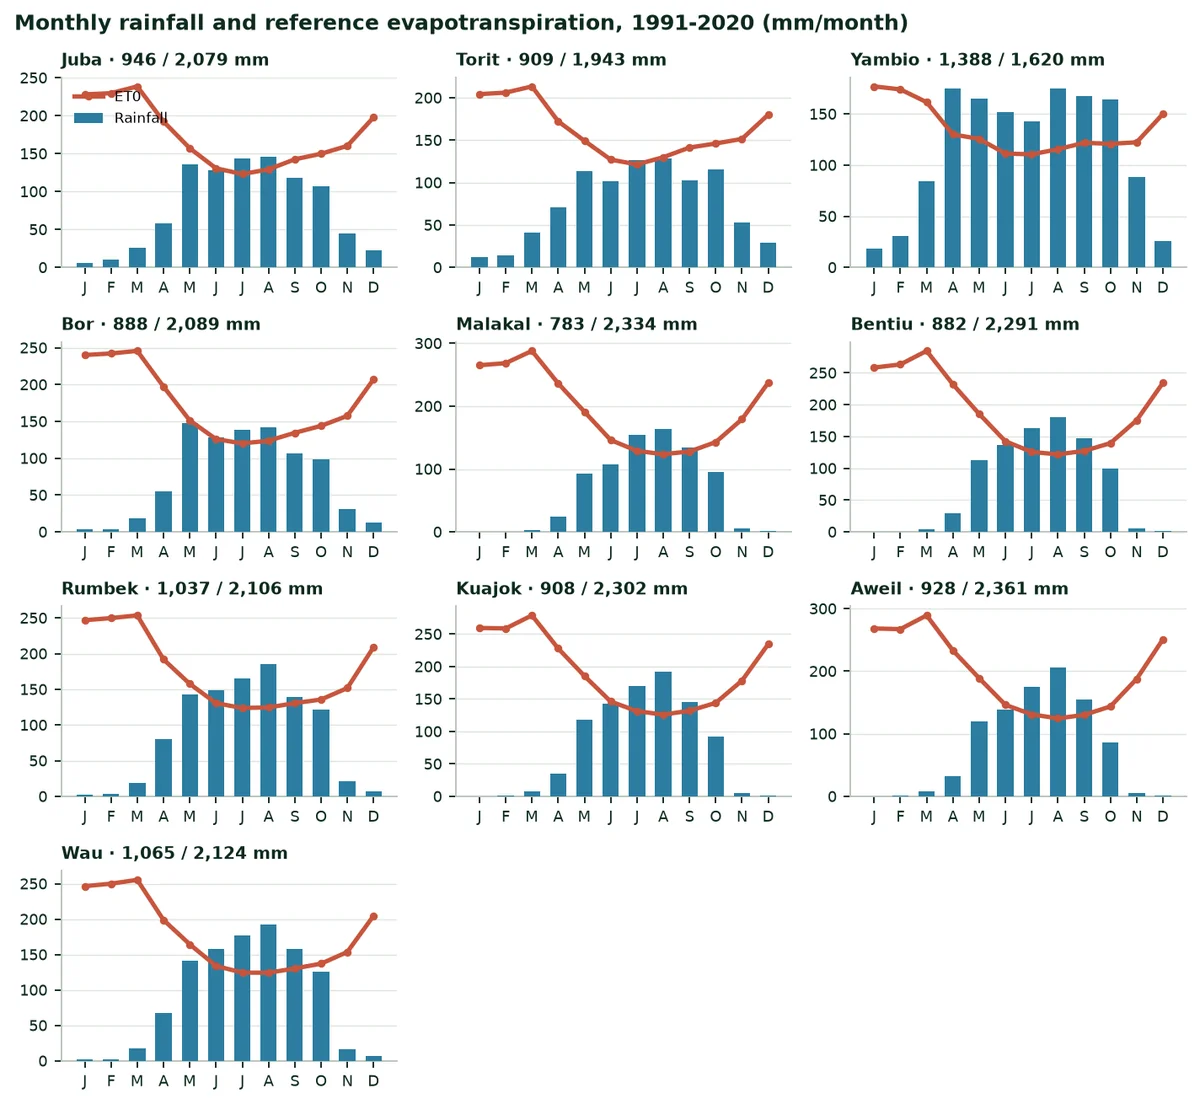
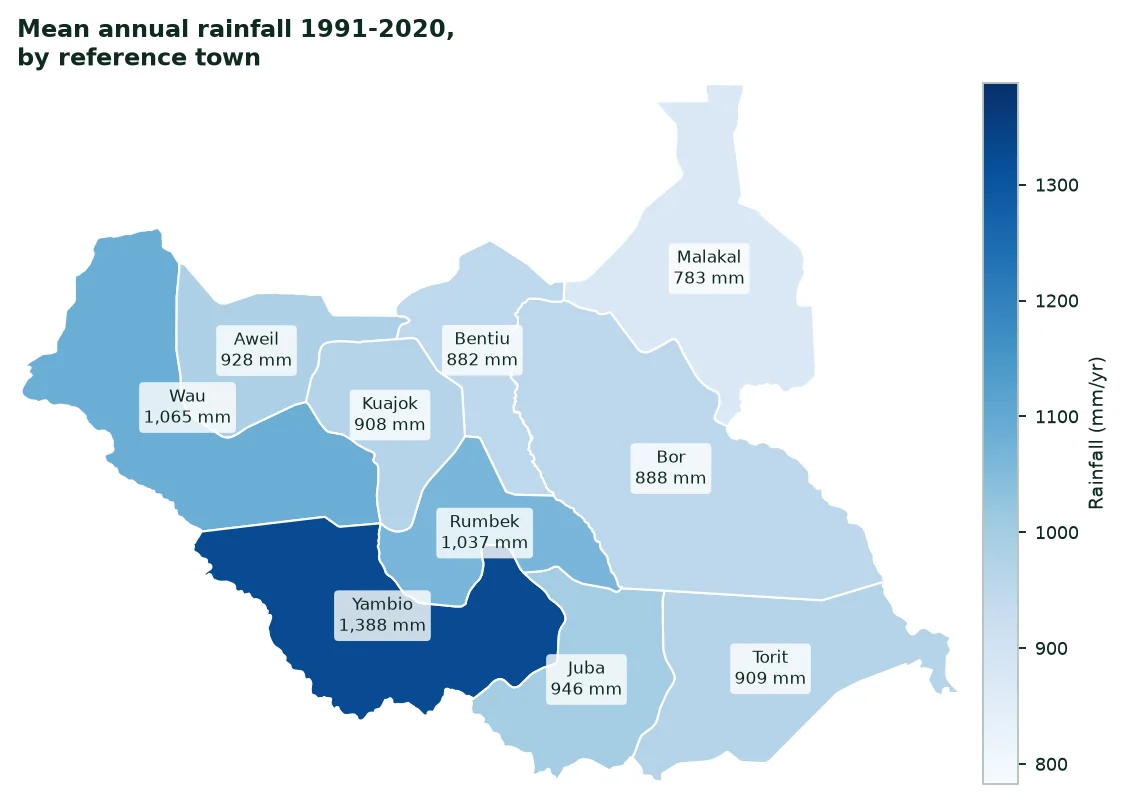
It rains 1,388 mm a year at Yambio, but only 783 mm at Malakal, where reference evapotranspiration reaches 2,334 mm. A single rainy season, from April to October, longer in the south-west (Equatoria) than in the north-east. From November to March, the dry season is hot and rainless.
Mean monthly rainfall, 1991-2020 (mm per month)
City | Jan | Feb | Mar | Apr | May | Jun | Jul | Aug | Sep | Oct | Nov | Dec |
|---|---|---|---|---|---|---|---|---|---|---|---|---|
Juba | 6 | 10 | 25 | 59 | 136 | 128 | 143 | 146 | 118 | 107 | 45 | 23 |
Torit | 13 | 14 | 41 | 71 | 114 | 101 | 126 | 129 | 103 | 116 | 53 | 29 |
Yambio | 18 | 30 | 84 | 175 | 165 | 152 | 143 | 175 | 167 | 164 | 88 | 26 |
Bor | 4 | 4 | 19 | 56 | 147 | 129 | 139 | 142 | 107 | 99 | 31 | 13 |
Malakal | 0 | 0 | 3 | 25 | 93 | 108 | 155 | 164 | 134 | 95 | 5 | 1 |
Bentiu | 0 | 0 | 4 | 29 | 113 | 136 | 164 | 181 | 148 | 100 | 5 | 1 |
Rumbek | 2 | 3 | 18 | 80 | 143 | 149 | 166 | 186 | 140 | 122 | 22 | 7 |
Kuajok | 0 | 1 | 8 | 35 | 118 | 142 | 170 | 192 | 145 | 92 | 5 | 1 |
Aweil | 0 | 1 | 8 | 32 | 120 | 139 | 175 | 206 | 154 | 86 | 6 | 1 |
Wau | 2 | 3 | 18 | 68 | 141 | 157 | 177 | 192 | 158 | 126 | 17 | 7 |
Source: NASA POWER (A9); author's calculation.
 |  |
|---|
3.3 Climate change
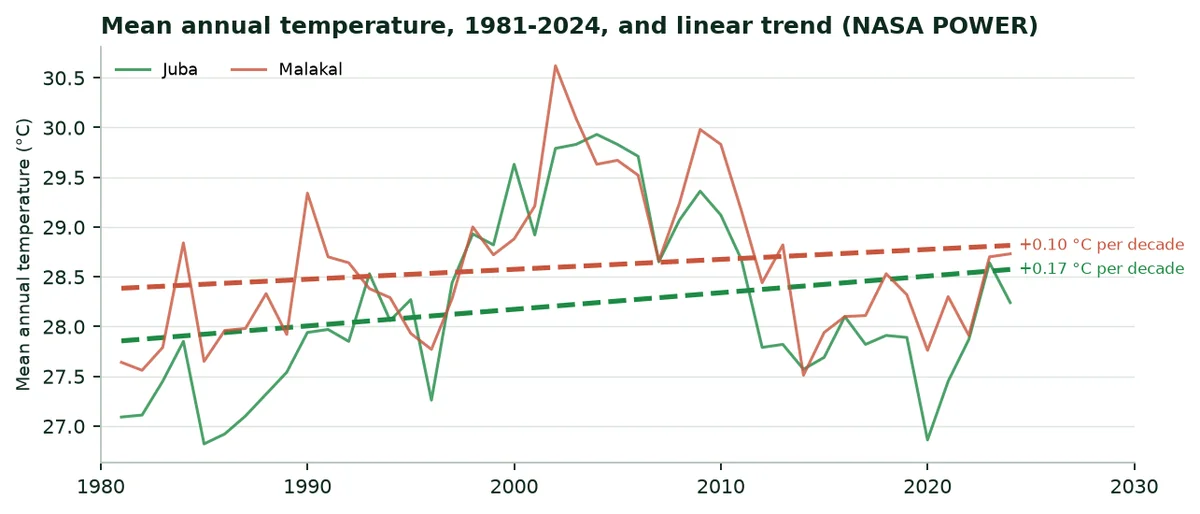
Mean annual temperature is rising. At Juba it went from 27.1 °C in 1981 to 28.2 °C in 2024, a trend of 0.17 °C per decade. At Malakal the trend is 0.10 °C per decade, from 27.6 °C to 28.7 °C. Warmer air dries the soil faster between two rains.
4. Water: Resources, irrigated areas, withdrawals
4.1 Resources and withdrawals
Total freshwater withdrawals are 658 million m³ a year (2022). Agriculture withdraws 36.5% of it, that is 240 Mm³. Internal resources are 26.0 km³ a year and water stress is 4.2%: The country has water, but little of it is mobilised for crops.
Freshwater: Withdrawals and resources
Indicator | Value | Year | Source |
|---|---|---|---|
Total withdrawals | 658 Mm³ | 2022 | World Bank (A1) |
Agricultural share | 36.5% | 2022 | World Bank (A1) |
Agricultural withdrawals | 240.0 Mm³ | 2022 | Calculated from A1 |
Area equipped for irrigation | 19,000 ha | 2024 | FAOSTAT (A6) |
Agricultural withdrawals per equipped hectare | 12,632 m³/ha | — | Calculation (Annex B) |
Water stress | 4.2% | 2022 | World Bank (A1) |
4.2 Irrigated areas
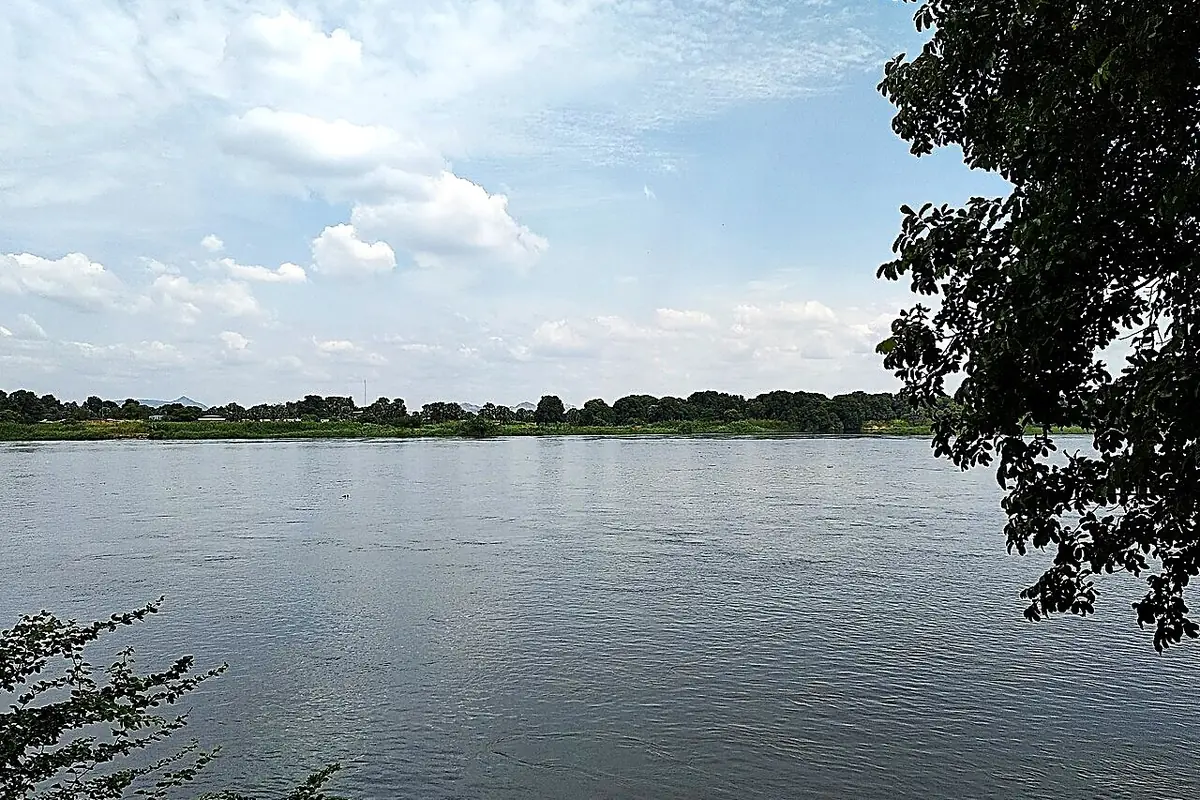
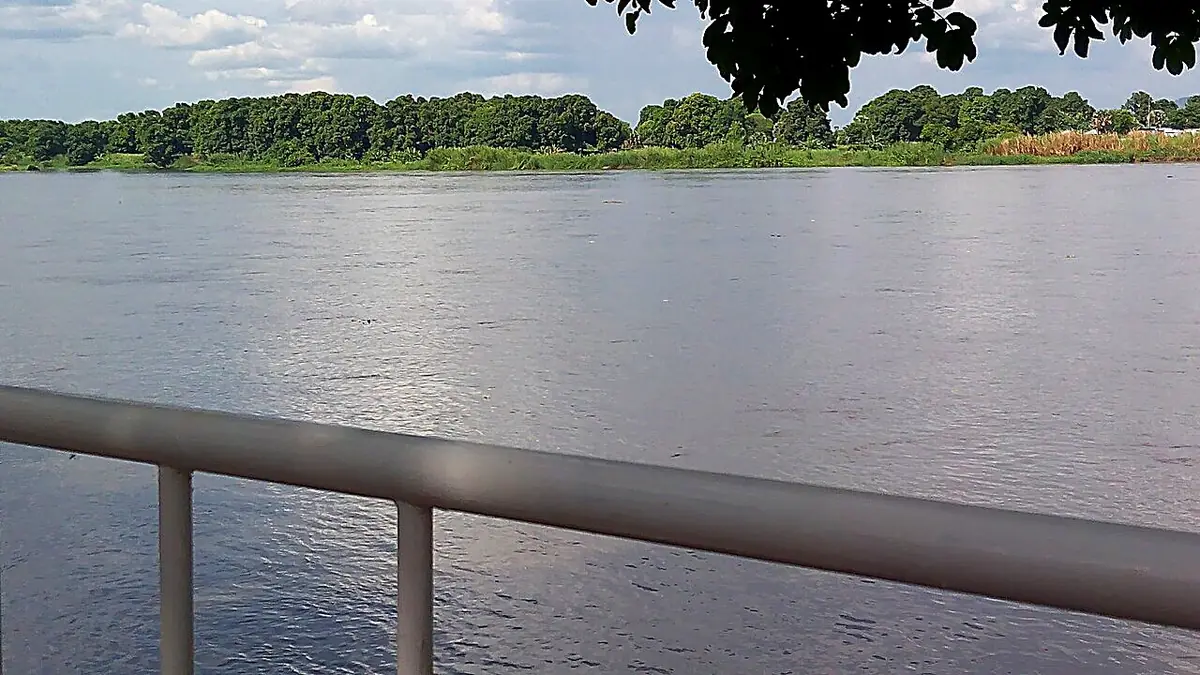
FAOSTAT counts 19,000 hectares equipped for irrigation in 2024. In 2024, the area equipped for irrigation is only 19,000 ha (A6), for nearly 2.5 million hectares of cropland. The Nile and its tributaries cross the country, but almost all farming depends on rain; the development plan lists irrigation as a priority (A13).
4.3 What the water saving represents
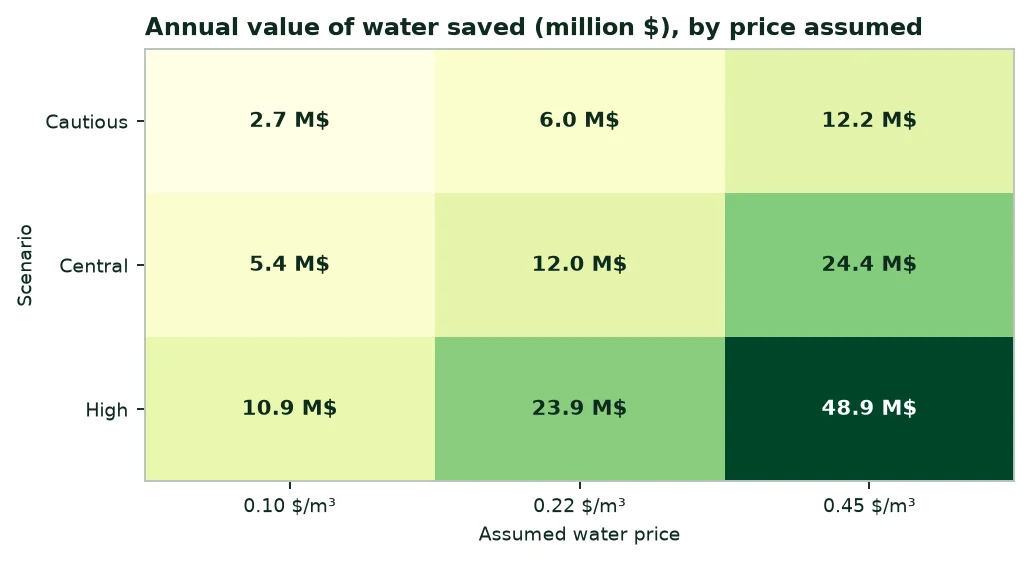
In the central scenario, the saving is 54.3 million m³ a year, or 22.6% of agricultural withdrawals. At 12,632 m³ per equipped hectare, this water would irrigate about 4,300 more hectares, or 22.6% of today's equipped area.
5. Fertilisers: Quantities, purchases, spending
5.1 Quantities used
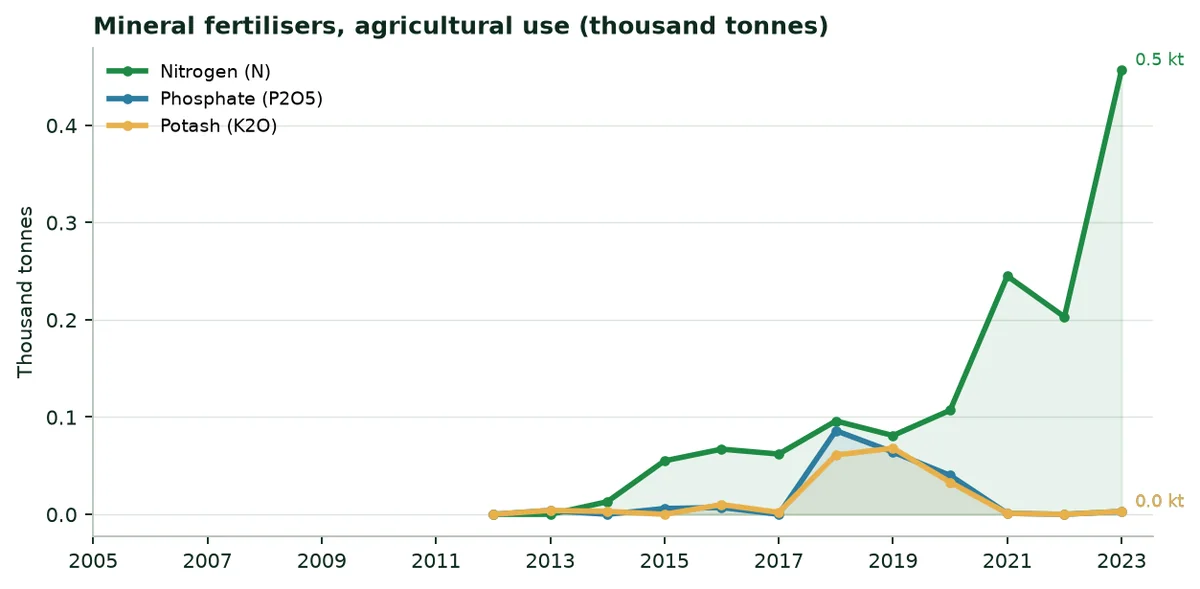
In 2024, agricultural use reaches 206 tonnes of nitrogen, 9 tonnes of phosphate (P2O5) and 8 tonnes of potash (K2O). The country produces no nitrogen fertiliser: It imported 206 tonnes of nitrogen in the same year. Per hectare of arable land, use is 0.1 kg per hectare.
5.2 Regulatory framework
No fertiliser registration regulation was found in the FAOLEX database; the development plan makes access to seeds and fertilisers a priority (A13). The classification of a water-retaining polymer is to be confirmed with the Ministry of Agriculture.
5.3 Indicative spending
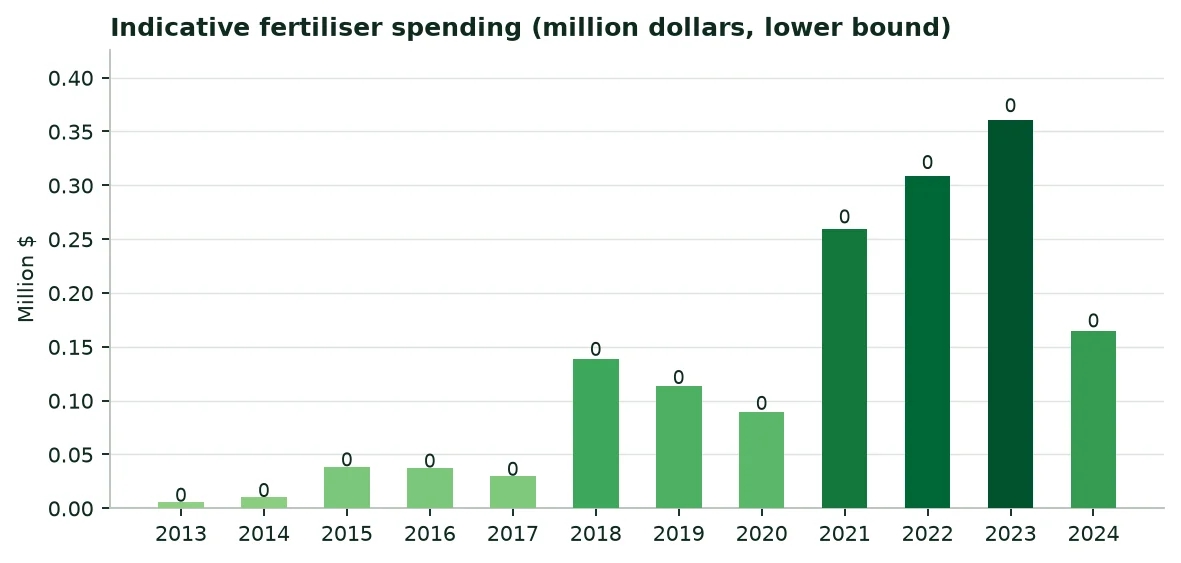
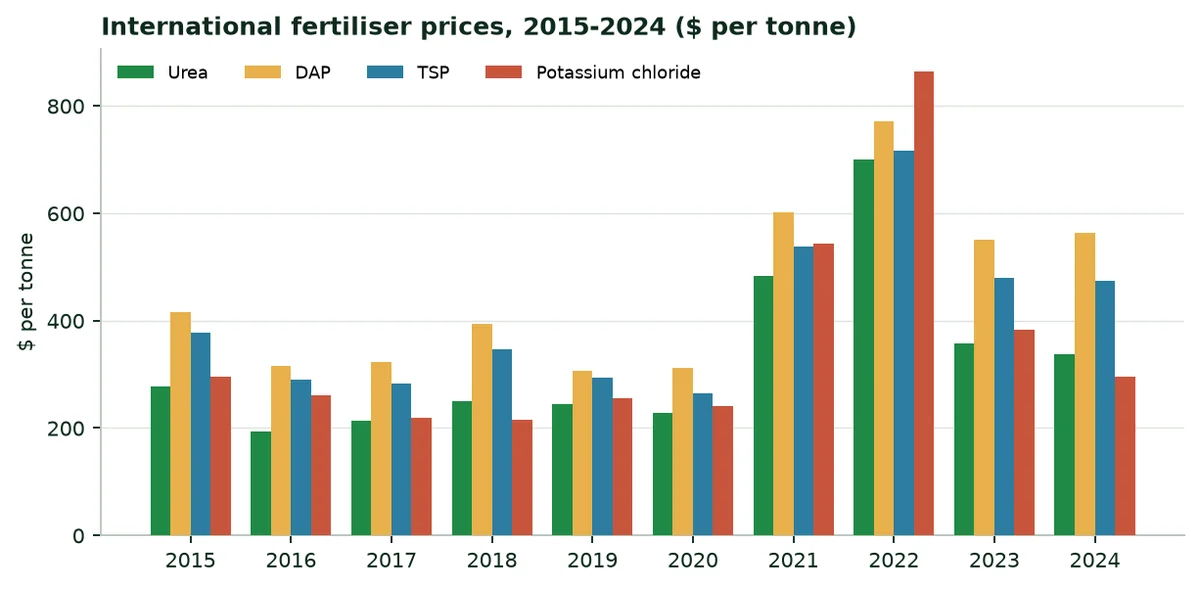
In 2024, the indicative minimum spending on mineral fertilisers reaches $0 million, at international fertiliser prices (calculation in Annex B, lower bound).
6. The regions at a glance
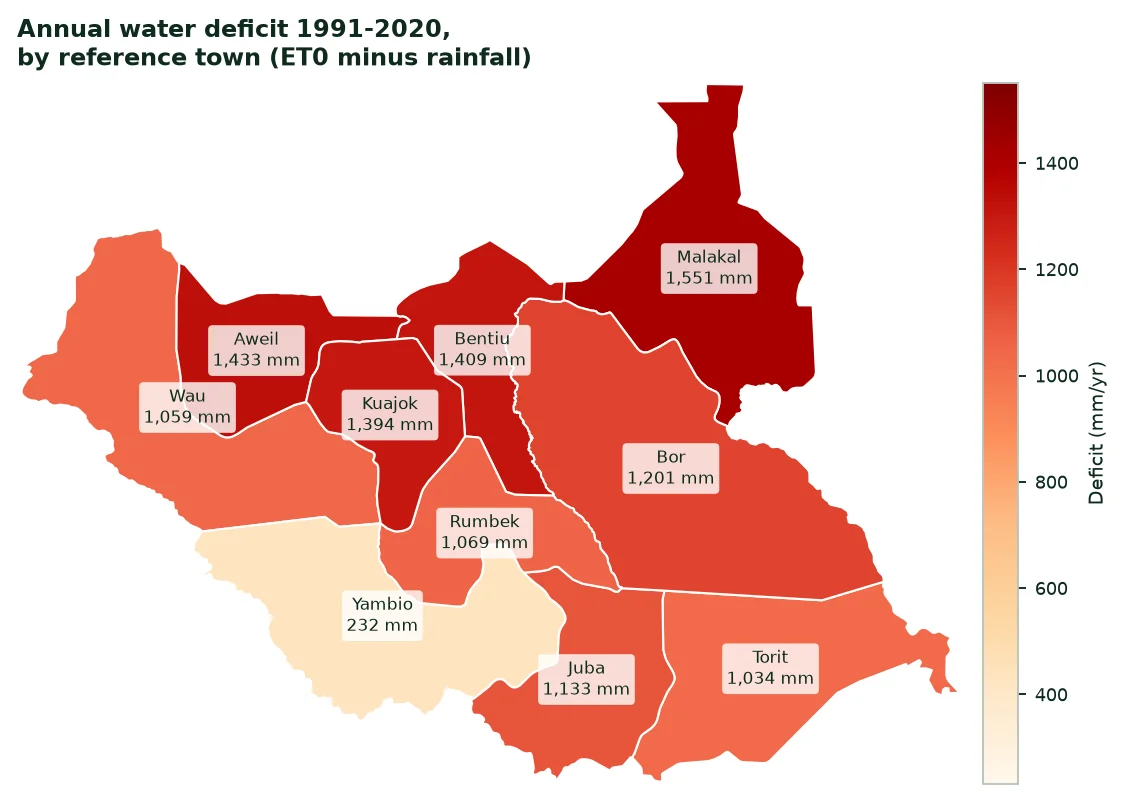
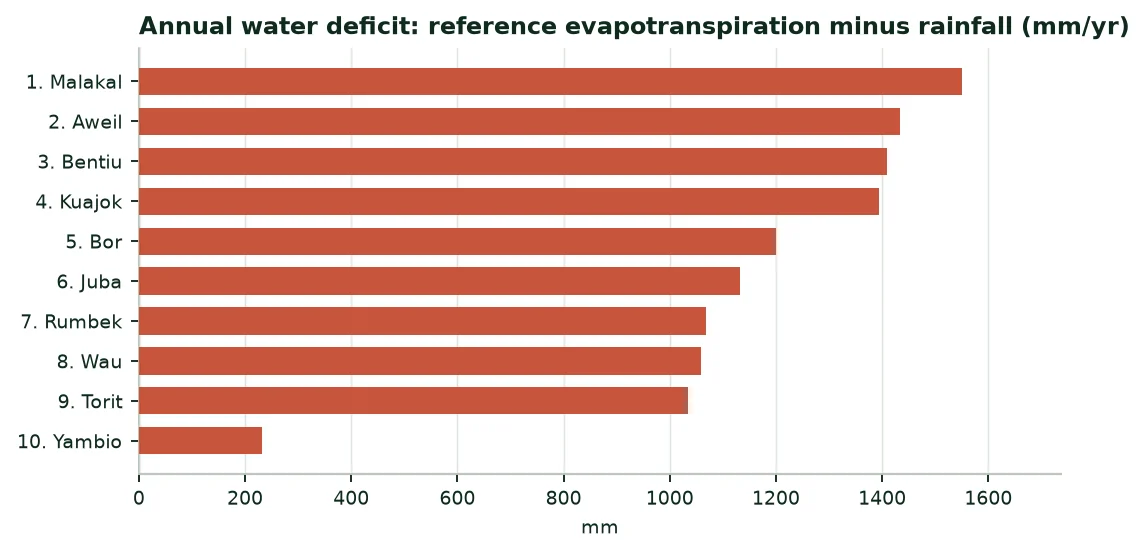
The table compares the ten states, each represented by its capital. Climate figures are 1991-2020 averages, except radiation (2005-2020).
Climate of the capitals, 1991-2020 means
Region (city) | Rainfall (mm/yr) | ET0 (mm/yr) | Deficit (mm/yr) | Radiation (kWh/m²/yr) | Temperature (°C) |
|---|---|---|---|---|---|
Central Equatoria (Juba) | 946 | 2,079 | 1,133 | 2,138 | 28.6 |
Eastern Equatoria (Torit) | 909 | 1,943 | 1,034 | 2,109 | 27.5 |
Western Equatoria (Yambio) | 1,388 | 1,620 | 232 | 2,096 | 24.9 |
Jonglei (Bor) | 888 | 2,089 | 1,201 | 2,042 | 28.8 |
Upper Nile (Malakal) | 783 | 2,334 | 1,551 | 2,101 | 28.8 |
Unity (Bentiu) | 882 | 2,291 | 1,409 | 2,149 | 28.9 |
Lakes (Rumbek) | 1,037 | 2,106 | 1,069 | 2,135 | 28.4 |
Warrap (Kuajok) | 908 | 2,302 | 1,394 | 2,215 | 28.7 |
Northern Bahr el Ghazal (Aweil) | 928 | 2,361 | 1,433 | 2,227 | 28.4 |
Western Bahr el Ghazal (Wau) | 1,065 | 2,124 | 1,059 | 2,182 | 27.9 |
Source: NASA POWER (A9); PVGIS (A8); author's calculation.
7. The twenty main crops: Three rankings
7.1 By harvested area
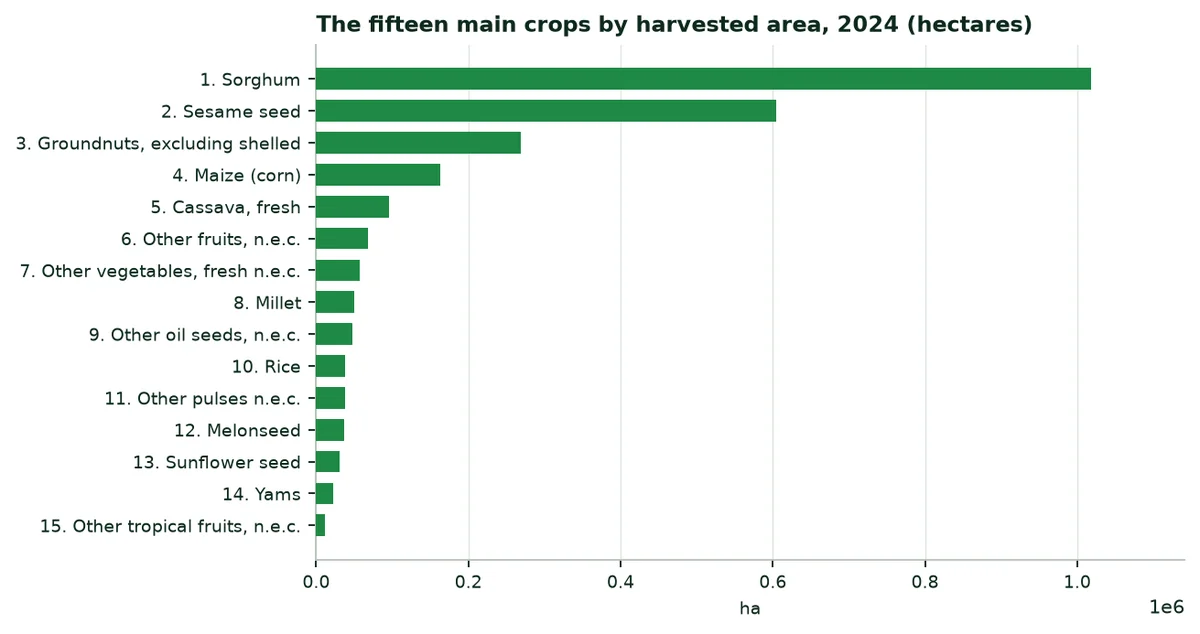
The ten main crops by area, 2024
Crop | Harvested area (ha) | Production (t) | Yield (t/ha) |
|---|---|---|---|
Sorghum | 1,018,687 | 960,000 | 0.94 |
Sesame seed | 604,865 | 175,612 | 0.29 |
Groundnuts, excluding shelled | 268,466 | 198,420 | 0.74 |
Maize (corn) | 162,707 | 157,000 | 0.96 |
Cassava, fresh | 95,885 | 1,709,494 | 17.83 |
Other fruits, n.e.c. | 68,384 | 399,657 | 5.84 |
Other vegetables, fresh n.e.c. | 56,979 | 435,735 | 7.65 |
Millet | 50,000 | 45,000 | 0.90 |
Other oil seeds, n.e.c. | 47,928 | 51,203 | 1.07 |
Rice | 38,453 | 38,000 | 0.99 |
Source: FAOSTAT (A2).
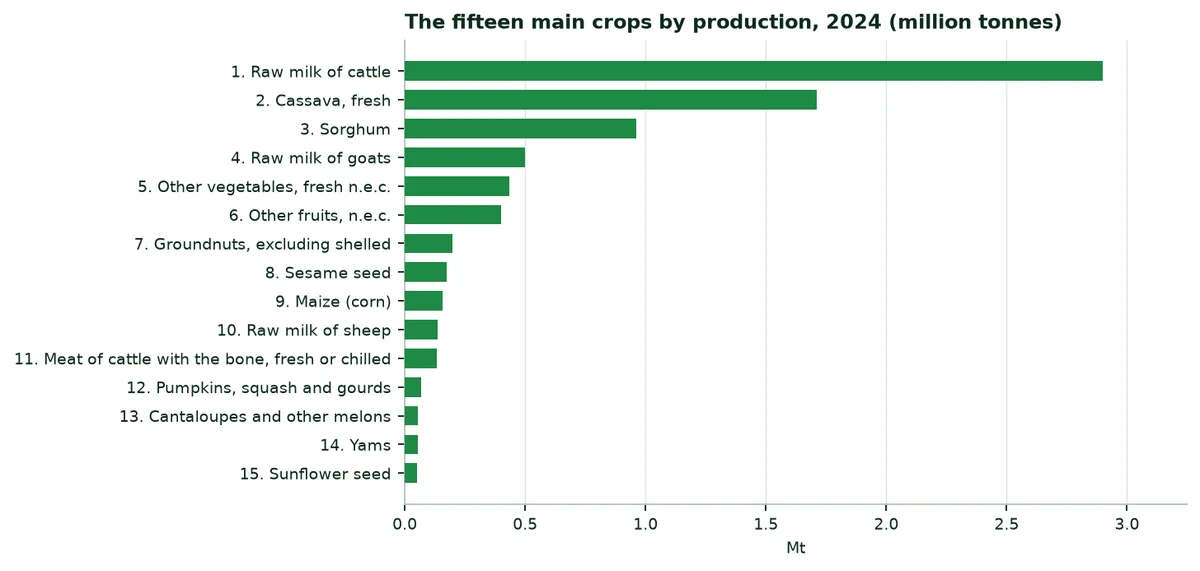
7.2 By production
7.3 By production value
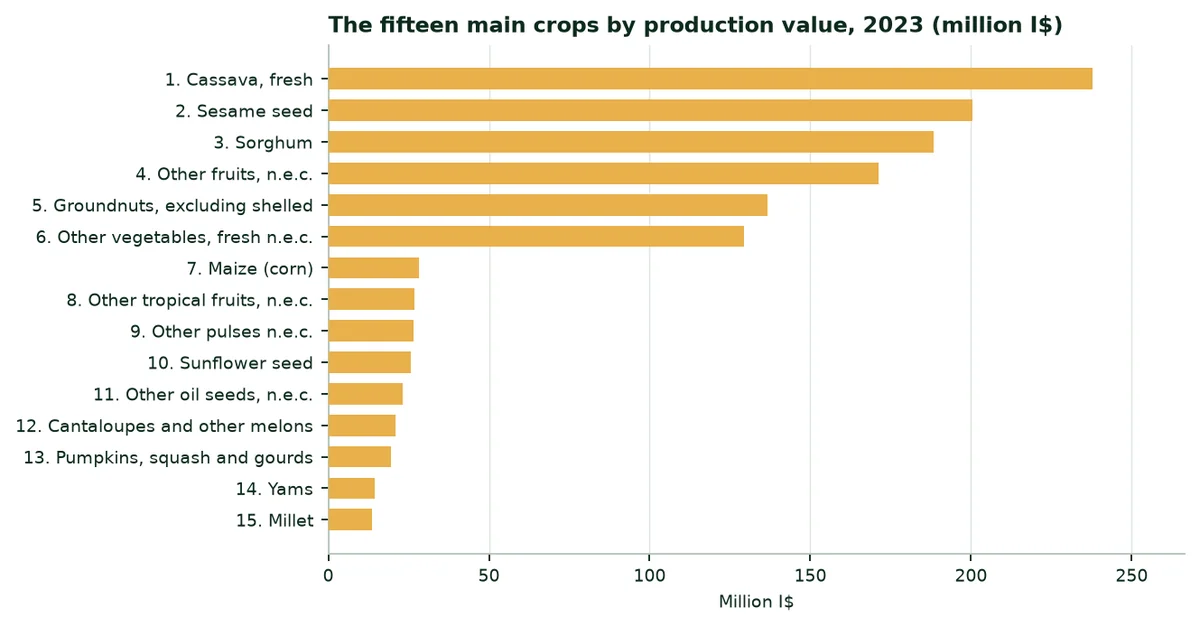
By production value, the three main crops are: Cassava, fresh, sesame seed and sorghum (FAOSTAT, 2023, constant international dollars).
8. Extrapolation by crop: Irrigation and rainfed crops
8.1 Method
8.2 Trials used as analogues
Trials cited and their use in the calculation
Trial | Crop | Water | Yield | Use in the calculation |
|---|---|---|---|---|
Maize, Türkiye (TIGEM, Konya, 2025) | Maize | -38.9% | +17.1% | Maize: Yield |
Soybean, China | Soybean | Assumption | +11.3% | Not used; cited for reference |
Watermelon, Mexico (2023) | Watermelon | -60.5% | +30.0% | Vegetables and melons: Water and yield |
Potato, South Africa (2025) | Potato | -52.0% | +31.4% | Not used; cited for reference |
Date palm, UAE (ICBA, 2021) | Palm | -82.0% | +20.0% | Not used; cited for reference |
Source: A14 to A18 (published trials and manufacturer's website, levels B and C).
No trial has yet been conducted in South Sudan: The figures below apply the trials cited to the country's average yields.
8.3 Rainfed crops: Maize
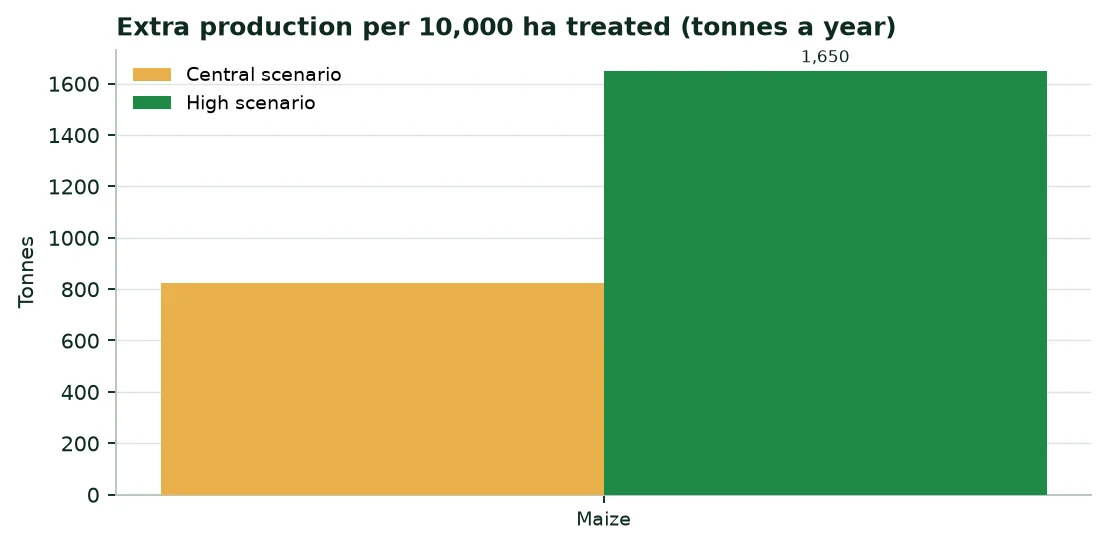
Average 2024 yields (FAOSTAT): Maize 0.96 t/ha. A water-retention polymer keeps the water of each rain near the roots and helps the crop through dry days during the season.
Extra production per 10,000 ha treated (tonnes a year)
Crop | Average yield (t/ha) | Cautious | Central | High |
|---|---|---|---|---|
Maize | 0.96 | 413 | 825 | 1,650 |
Source: FAOSTAT (A2); trials A14 to A18; author's calculation (Annex B).
8.4 Irrigation: Vegetables and melons and Rice
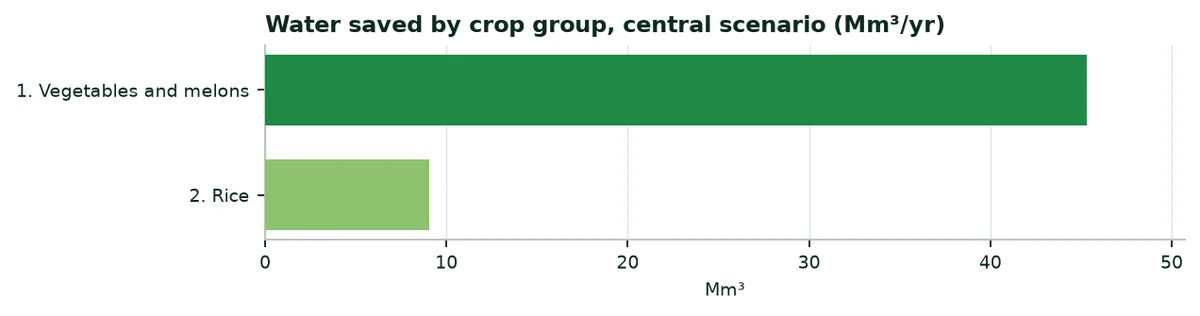
Equipped area assigned, trial used and water saved (central scenario)
Crop group | Equipped area (ha) | Share | Trial or assumption | Water saved (Mm³/yr) |
|---|---|---|---|---|
Vegetables and melons | 11,853 | 62.4% | Watermelon, Mexico (2023) | 45.3 |
Rice | 7,147 | 37.6% | Generic assumption, no trial | 9.0 |
Source: Author's calculation (Annex B).
Water saved, extra irrigable hectares and production gain, by scenario
Scenario | Water (Mm³/yr) | Extra hectares | Production (t/yr) |
|---|---|---|---|
Cautious | 27.2 | 2,150 | 7,798 |
Central | 54.3 | 4,300 | 15,595 |
High | 108.6 | 8,601 | 31,191 |
Source: Author's calculation (Annex B).
8.5 Reading the results
9. Potential benefits of our products
The table lists what the products may bring according to the documents available, with their confidence level and their limit.
Potential benefits, by situation
Benefit | Published figures | Source (level) | Limit |
|---|---|---|---|
Irrigation water saving | Date palm −82%; watermelon −60.5%; potato −52%; maize −38.9% | A14 to A18 (B, C) | One trial per crop; none in South Sudan |
Yield | Maize +17.1%; potato +31.4%; watermelon +30%; date palm +20%; soybean +11.2 to +11.4% | A14 to A18 (B, C) | Trials conducted under irrigation or in other climates |
Organic farming (ECOFERT®) | Certified by SOHISCERT and EU Bio | A21 (A) | Valid for the certified product |
Safety: Acrylamide (ECOSORB®) | Below 3.0 µg/g | A19 (B) | One laboratory, one date |
REACH compliance (EVERGREEN®) | ≤ 0.1% of substances of very high concern in 233 substances tested | A20 (B) | Screening, not an approval |
Agroforestry (Paulownia ALTIFOLIA®) | 13 to 15 m in 6 to 8 years (website) | A22 (C) | No trial in South Sudan |
Source: Annex A.
10. External trade: Exports, imports, importing
10.1 Overview, 2022 and 2023
Agricultural products and total merchandise trade (million $)
Indicator | 2022 | 2023 |
|---|---|---|
Agricultural exports (crops and livestock) | 22 | 36 |
Agricultural imports (crops and livestock) | 605 | 613 |
Exports, all merchandise | 873 | 833 |
Imports, all merchandise | 1,255 | 1,184 |
Source: FAOSTAT (A4).
FAOSTAT trade data for 2024 look incomplete (agricultural exports of 1 M$, against 36 M$ in 2023): This chapter therefore uses 2023.
10.2 Exports
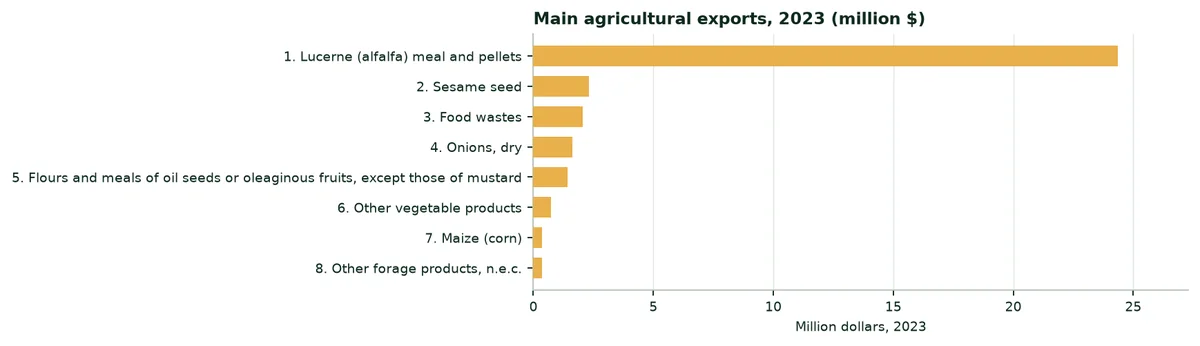
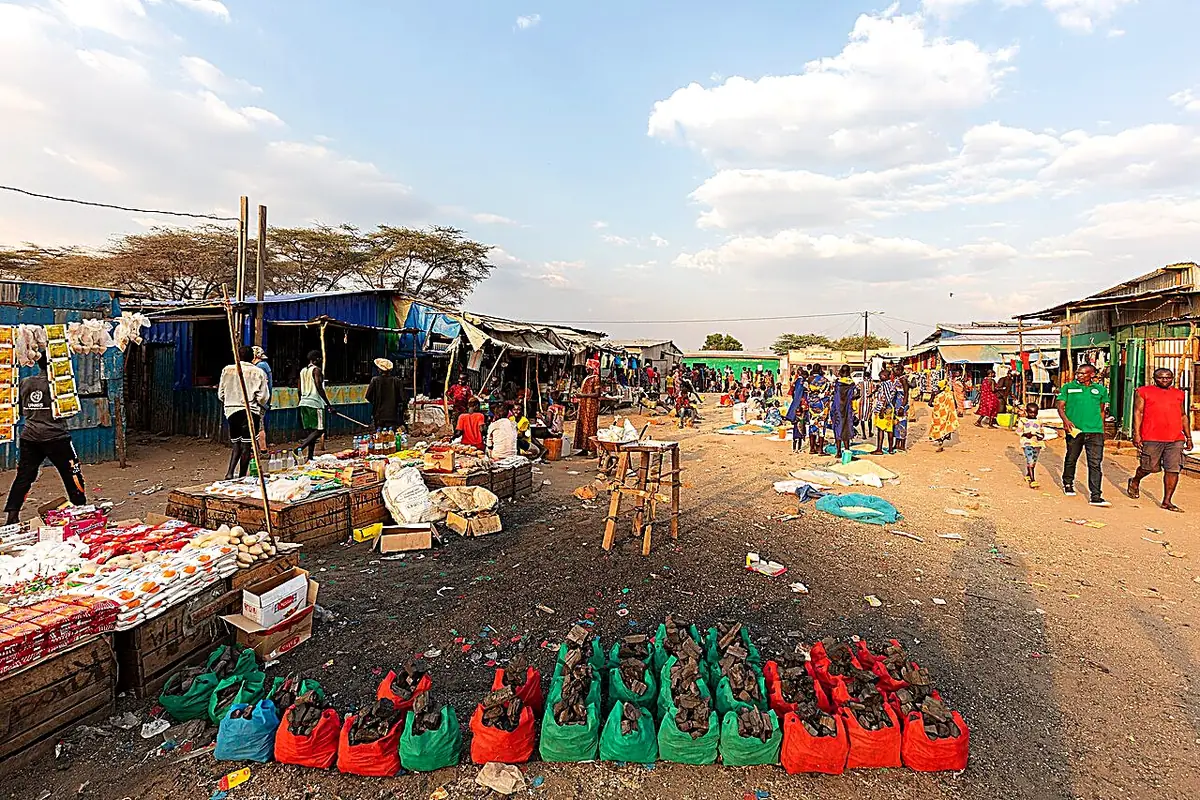
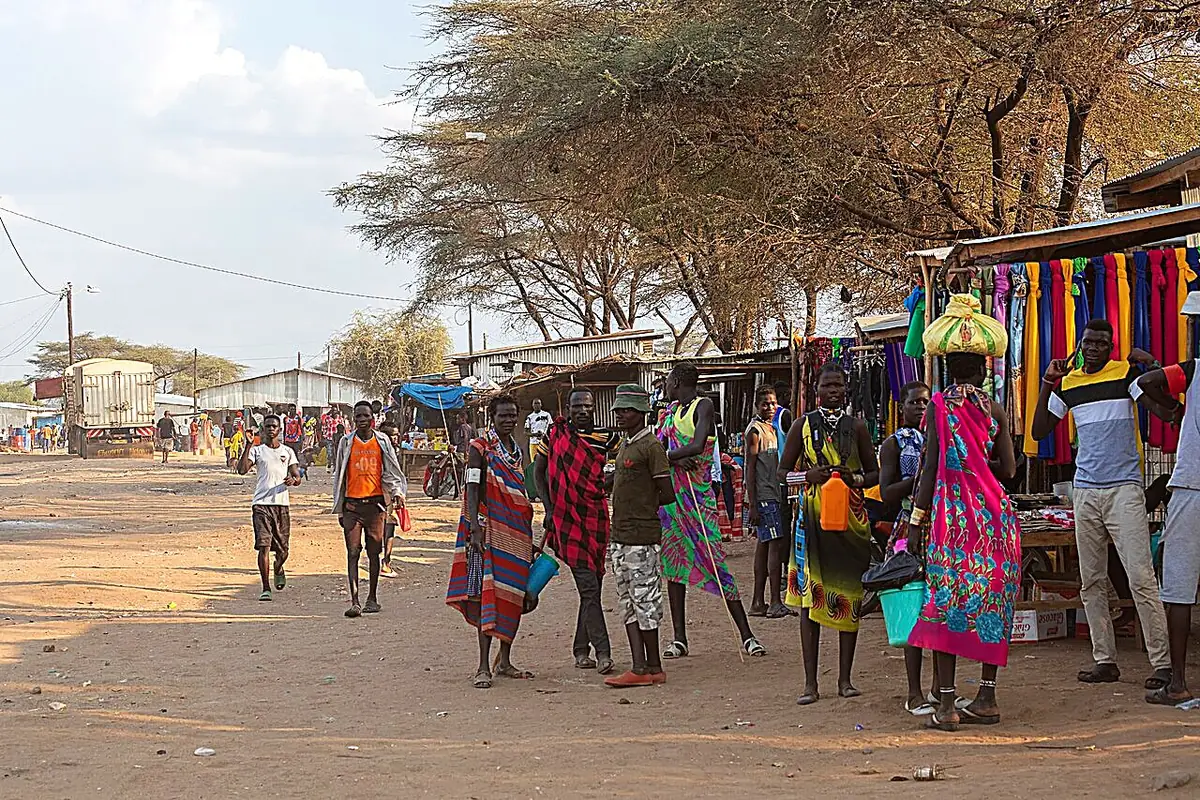
The three main farm products exported in 2023 are: Lucerne (alfalfa) meal and pellets ($24 million), sesame seed ($2 million) and food wastes ($2 million).
10.3 Imports
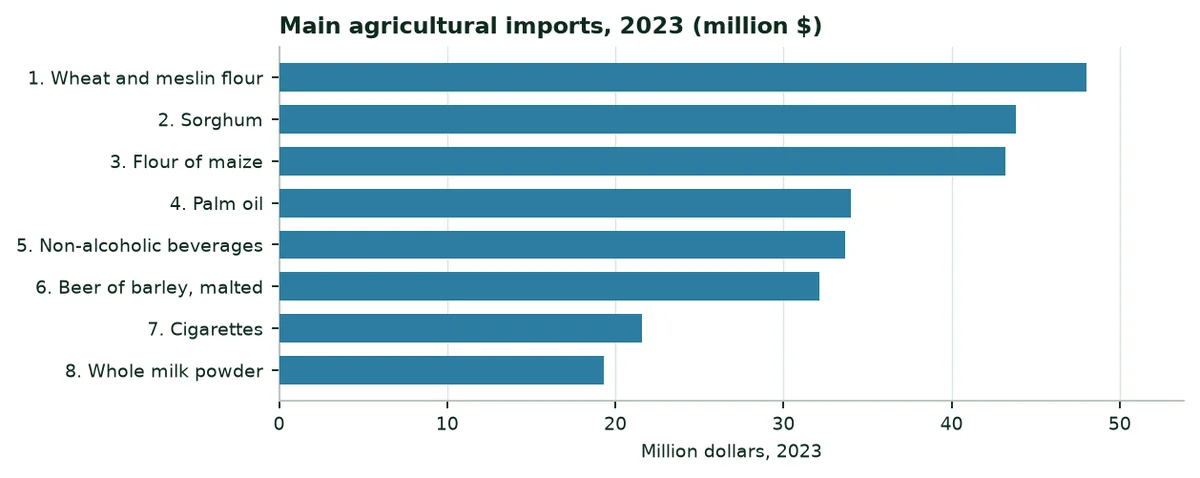
The main farm purchases are: Wheat and meslin flour ($48 million), sorghum ($44 million) and flour of maize ($43 million).
 |  |
|---|
10.4 Importing water-retention polymers into South Sudan
11. A study of each region
Each region is described through the city that represents it. The figures describe the climate; the water deficit (evapotranspiration minus rainfall) shows where water is most short. The description of crops is qualitative.
Central Equatoria (Juba)
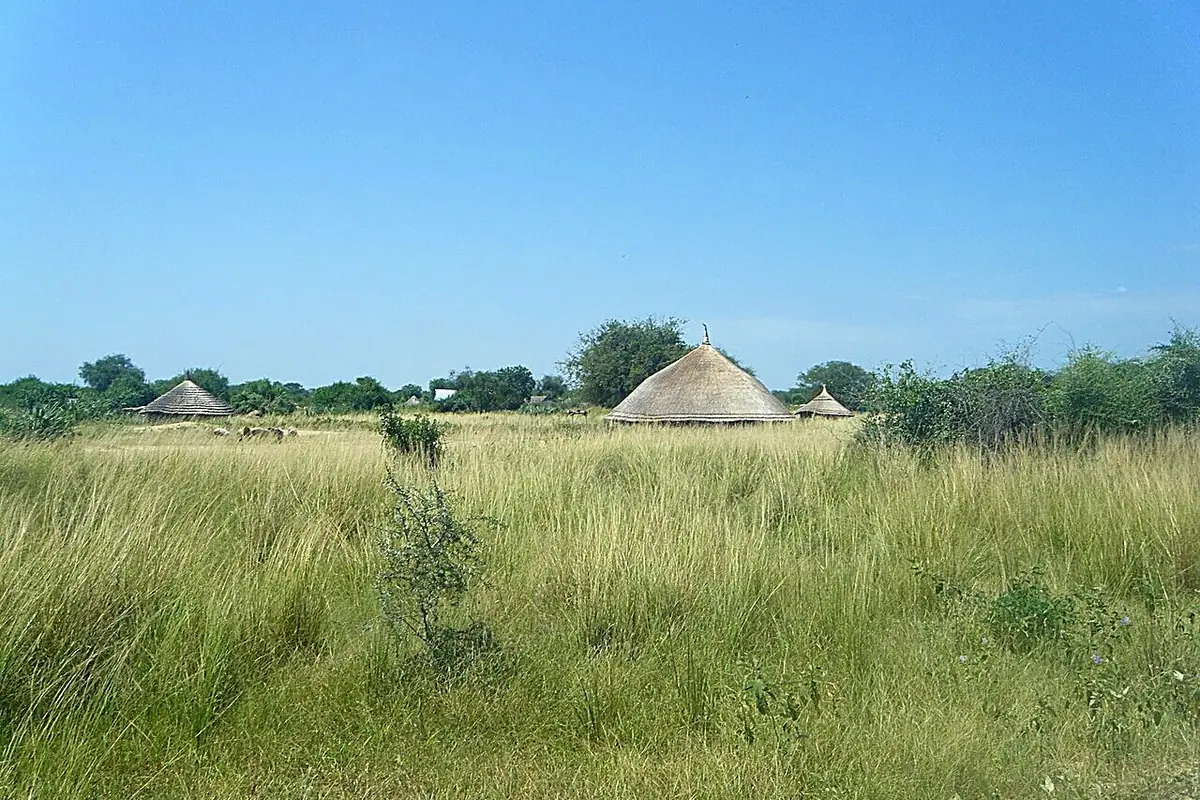
Central Equatoria: Sorghum, maize, cassava, groundnut and vegetables around the capital, along the White Nile.
Indicator | Value |
|---|---|
Annual rainfall, 1991-2020 | 946 mm |
Reference evapotranspiration | 2,079 mm |
Annual water deficit | 1,133 mm |
Months with less than 50 mm of rain | 5 |
Global solar radiation | 2,138 kWh/m² |
Mean temperature | 28.6 °C |
Source: NASA POWER (A9); PVGIS (A8); author's calculation.
Eastern Equatoria (Torit)
Eastern Equatoria: Sorghum and livestock on the dry plains, more varied crops on the slopes of the Imatong mountains.
Indicator | Value |
|---|---|
Annual rainfall, 1991-2020 | 909 mm |
Reference evapotranspiration | 1,943 mm |
Annual water deficit | 1,034 mm |
Months with less than 50 mm of rain | 4 |
Global solar radiation | 2,109 kWh/m² |
Mean temperature | 27.5 °C |
Source: NASA POWER (A9); PVGIS (A8); author's calculation.
Western Equatoria (Yambio)
Western Equatoria, the "green belt": Maize, cassava, groundnut, fruit and teak, under the longest rainy season.
Indicator | Value |
|---|---|
Annual rainfall, 1991-2020 | 1,388 mm |
Reference evapotranspiration | 1,620 mm |
Annual water deficit | 232 mm |
Months with less than 50 mm of rain | 3 |
Global solar radiation | 2,096 kWh/m² |
Mean temperature | 24.9 °C |
Source: NASA POWER (A9); PVGIS (A8); author's calculation.
Jonglei (Bor)
Jonglei: Sorghum and cattle, between Nile floods and the Sudd swamps; floods there often destroy harvests.
Indicator | Value |
|---|---|
Annual rainfall, 1991-2020 | 888 mm |
Reference evapotranspiration | 2,089 mm |
Annual water deficit | 1,201 mm |
Months with less than 50 mm of rain | 5 |
Global solar radiation | 2,042 kWh/m² |
Mean temperature | 28.8 °C |
Source: NASA POWER (A9); PVGIS (A8); author's calculation.
Upper Nile (Malakal)
Upper Nile: Sorghum and former irrigation schemes on the Nile, livestock and fishing.
Indicator | Value |
|---|---|
Annual rainfall, 1991-2020 | 783 mm |
Reference evapotranspiration | 2,334 mm |
Annual water deficit | 1,551 mm |
Months with less than 50 mm of rain | 6 |
Global solar radiation | 2,101 kWh/m² |
Mean temperature | 28.8 °C |
Source: NASA POWER (A9); PVGIS (A8); author's calculation.
Unity (Bentiu)
Unity: Sorghum, livestock and fishing on a floodplain, hit by floods in recent years.
Indicator | Value |
|---|---|
Annual rainfall, 1991-2020 | 882 mm |
Reference evapotranspiration | 2,291 mm |
Annual water deficit | 1,409 mm |
Months with less than 50 mm of rain | 6 |
Global solar radiation | 2,149 kWh/m² |
Mean temperature | 28.9 °C |
Source: NASA POWER (A9); PVGIS (A8); author's calculation.
Lakes (Rumbek)
Lakes: Sorghum, groundnut, sesame and large cattle herds.
Indicator | Value |
|---|---|
Annual rainfall, 1991-2020 | 1,037 mm |
Reference evapotranspiration | 2,106 mm |
Annual water deficit | 1,069 mm |
Months with less than 50 mm of rain | 5 |
Global solar radiation | 2,135 kWh/m² |
Mean temperature | 28.4 °C |
Source: NASA POWER (A9); PVGIS (A8); author's calculation.
Warrap (Kuajok)
Warrap: Sorghum, groundnut and livestock, on clay soils that waterlog in the rainy season.
Indicator | Value |
|---|---|
Annual rainfall, 1991-2020 | 908 mm |
Reference evapotranspiration | 2,302 mm |
Annual water deficit | 1,394 mm |
Months with less than 50 mm of rain | 6 |
Global solar radiation | 2,215 kWh/m² |
Mean temperature | 28.7 °C |
Source: NASA POWER (A9); PVGIS (A8); author's calculation.
Northern Bahr el Ghazal (Aweil)
Northern Bahr el Ghazal: Sorghum, groundnut and lowland rice, with the former Aweil rice scheme.
Indicator | Value |
|---|---|
Annual rainfall, 1991-2020 | 928 mm |
Reference evapotranspiration | 2,361 mm |
Annual water deficit | 1,433 mm |
Months with less than 50 mm of rain | 6 |
Global solar radiation | 2,227 kWh/m² |
Mean temperature | 28.4 °C |
Source: NASA POWER (A9); PVGIS (A8); author's calculation.
Western Bahr el Ghazal (Wau)
Western Bahr el Ghazal: Sorghum, cassava, groundnut and sesame, between wooded savannah and plains.
Indicator | Value |
|---|---|
Annual rainfall, 1991-2020 | 1,065 mm |
Reference evapotranspiration | 2,124 mm |
Annual water deficit | 1,059 mm |
Months with less than 50 mm of rain | 5 |
Global solar radiation | 2,182 kWh/m² |
Mean temperature | 27.9 °C |
Source: NASA POWER (A9); PVGIS (A8); author's calculation.
Annex A. Sources and confidence levels
Ref. | Source | Level |
|---|---|---|
A1 | World Bank, World Development Indicators (WDI), South Sudan | A |
A2 | FAOSTAT, crops and livestock (QCL), areas, production, 2014-2024 | A |
A3 | FAOSTAT, value of production (QV), constant 2014-2016 I$, 2019-2024 | A |
A4 | FAOSTAT, trade in crops and livestock products, 2018-2023 | A |
A5 | FAOSTAT, mineral fertilisers, agricultural use, production and imports, 2005-2023 | A |
A6 | FAOSTAT, land use, areas equipped for irrigation, organic farming | A |
A7 | World Bank, Pink Sheet (world prices of urea, DAP, TSP and potassium chloride) | A |
A8 | PVGIS (European Commission Joint Research Centre), radiation, 2005-2020 | B |
A9 | NASA POWER (NASA Langley Research Center), daily data: Rainfall, temperature, humidity, wind and radiation, 1981-2024; reference evapotranspiration calculated by the author with FAO-56 (Penman-Monteith) | B |
A10 | Natural Earth, first-level administrative boundaries and country outline | B |
A11 | World Bank, WITS (UNCTAD TRAINS database), East African Community common external tariff, subheading 3906.90, 2023 (Kenya, Uganda, Rwanda; no line for South Sudan) | A |
A12 | National Policy and Strategy on EAC Implementation (South Sudan), as held in FAO's FAOLEX database: Commitment to implement the customs union | B |
A13 | South Sudan Development Plan, as held in FAO's FAOLEX database: Access to inputs (seeds, fertilisers) and irrigation development | B |
A14 | Soybean trial, China (yield), manufacturer's website | C |
A15 | Date palm trial, UAE (ICBA, 2021), manufacturer's website | B |
A16 | Watermelon trial, Mexico (2023), manufacturer's website | C |
A17 | Potato trial, South Africa (2025), manufacturer's website | C |
A18 | Maize trial, Türkiye (TIGEM, Konya, 2025), manufacturer's website | B |
A19 | ECOSORB® acrylamide analysis (Polymex laboratory, 2024) | B |
A20 | EVERGREEN® REACH / SVHC screening (SGS, 2023) | B |
A21 | ECOFERT® certificate (SOHISCERT, EU Bio) | A |
A22 | Paulownia ALTIFOLIA® sheet figures (website) | C |
Annex B. Calculation method
1. Agricultural water. Total withdrawals (658 Mm³, 2022) × agricultural share (36.47%) = 240.0 Mm³.
2. Irrigation. The equipped area (19,000 ha) and agricultural water are shared between irrigated groups (vegetables and melons and rice) in proportion to their harvested areas (102,230 ha), without exceeding each group's harvested area. Our sources have no irrigation statistic by crop. Other crops are treated as rainfed and receive no irrigation water in the calculation. The equipped area is much smaller than the harvested area of irrigable crops (vegetables, rice): It is shared among them pro rata, and the rest of their area is rainfed. Maize is treated as rainfed: Its yield gain is given for 10,000 ha treated. Sorghum, the first crop, has no trial: No yield gain is attributed to it.
3. Scenarios. Water saved = group water × trial effect: A quarter (cautious), half (central), all of it (high). Without a trial: 5, 10 and 20%.
4. Extra hectares. Water saved ÷ water per equipped hectare (12,632 m³/ha).
5. Rainfed crops. Gain per 10,000 ha = 10,000 × average 2024 yield (production ÷ harvested area, FAOSTAT) × trial effect on yield (maize 17.1%), with the same quarter, half and whole.
6. Value of water. Three assumed prices (0.10; 0.22 and 0.45 $/m³); no national tariff was adopted.
7. Fertilisers. Minimum spending = nitrogen ÷ 0.46 × urea price + phosphate ÷ 0.46 × TSP price + potash ÷ 0.60 × potassium chloride price (A7).
8. Climate. Rainfall, reference evapotranspiration (FAO-56) and temperature: 1991-2020 means of the NASA POWER grid cell containing each city; radiation: PVGIS, 2005-2020. Temperature trends are linear regressions over 1981-2024. NASA POWER combines reanalyses and satellite data on a grid of about 50 km: Two nearby cities can share the same cell, and its rainfall can differ from local station records. On the maps, each state is coloured according to the value of its capital. The Abyei, Pibor and Ruweng administrative areas are not distinguished in the Natural Earth boundaries.
9. Trade. Totals are those of the FAOSTAT crops and livestock line; products are listed one by one, without aggregates. Rice amounts add husked rice, broken rice and milled rice.
Annex C. Photo credits
File (Wikimedia Commons) | Author | Licence |
|---|---|---|
Keliko Women at work.jpg | Eawisdom | CC0 |
Traditional dinka homestead.jpg | Jayyeass | CC BY-SA 4.0 |
House with sorghum in the foreground.jpg | Mr leroy playpus | CC BY 4.0 |
MAJESTIC VIEW OF WHITE NILE , JUBA, SOUTH SUDAN.jpg | Umar sheriff habibullah | CC BY-SA 4.0 |
Nile River in Juba.jpg | Rigan123 | CC BY-SA 4.0 |
Adior Village.jpg | Odokonyeromari | CC BY-SA 4.0 |
Campamento de ganado de la tribu Mundari, Terekeka, Sudán del Sur, 202 | Diego Delso | CC BY-SA 4.0 |
Nyamor Nwat, Lankien, South Sudan (16715638768).jpg | Oxfam East Africa | CC BY 2.0 |
Campamento de ganado de la tribu Mundari, Terekeka, Sudán del Sur, 202 | Diego Delso | CC BY-SA 4.0 |
Kapoeta, Sudán del Sur, 2024-01-25, DD 53.jpg | Diego Delso | CC BY-SA 4.0 |
Kapoeta, Sudán del Sur, 2024-01-25, DD 46.jpg | Diego Delso | CC BY-SA 4.0 |
Landscape with thatch roofs and tall grass.jpg | Mr leroy playpus | CC BY 4.0 |
A fishing community relaxing in their hut in South Sudan.jpg | Lomoraronald | CC BY-SA 4.0 |
Source: Photos published on Wikimedia Commons, colour-adjusted and sharpened, used under their licence.
 |  Green Solutions contact@green-solutions-group.com green-solutions-group.com |
|---|
Tell us about your plot
Crop, drainage, soil type and how you water today. We come back with the matching combination of technologies, the dosing, and the trials already run in comparable situations.
A first conversation commits you to nothing.
Tell us about your plotcontact@green-solutions-group.com · Green Solutions Groupe AIM SA, 46, route de la Condémine, 1475 Forel, Switzerland
Photo credits
- Vetiverman — CC BY-SA 4.0, « Harvested grain in Mundri »
- Lomoraronald — CC BY-SA 4.0, « Women cool off after clearing the farm in South Sudan »
- Kabang Bladina Gideon — CC BY-SA 4.0, « A banana plantation »
- Oxfam East Africa — CC BY 2.0, « Small-scale farmers increase production (7536268172) »
Photographs from Wikimedia Commons, reused under their stated licences.