MARKET DOSSIER
Oman
SULTANATE OF OMAN
Dates, vegetables and fodder grown on shrinking aquifers and under 100 mm of rain.
What hydro-retention changes when every cubic metre is pumped.
Foreword
This dossier describes the Sultanate of Oman from the angle of irrigation water, climate, fertilisers and crops. It is intended for the authorities responsible for agriculture and water resources, and for the economic players of the sector. It answers three questions: Where is water used, for which crops, and with what reserves? It then examines what our products can change, and what that may be worth.
Reading the sources. Every figure refers to a source, named in the text and detailed in Annex A. Each source carries a confidence level:
What this dossier does not do. It does not turn a trial carried out elsewhere into an Omani result. Water savings and yield gains by crop are scenarios, built from the trials cited.
What remains to be completed. Cultivated area and irrigation volumes by governorate, and the water use of date palms and fodder under Omani conditions. Section 11 gives the details.
Summary
The seven points below summarise the dossier. The key figures come from public sources (FAO, World Bank, National Centre for Statistics and Information, PVGIS). Water savings are scenarios, described in Annex B.
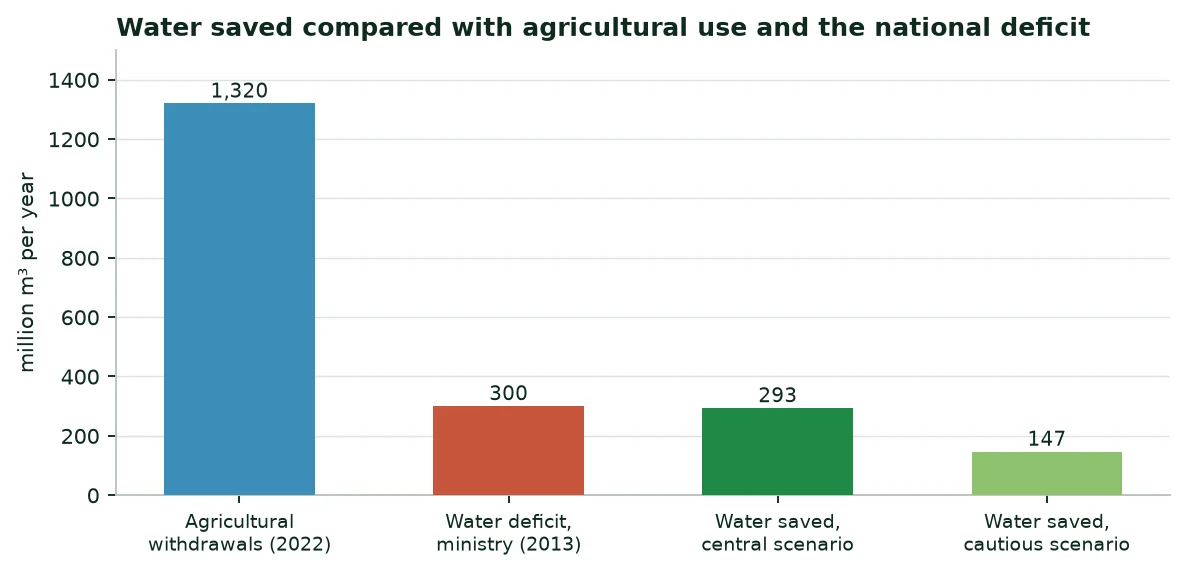
1,320 Mm³ Of water withdrawn each year for agriculture, 81% of all withdrawals (World Bank, 2022). | 117% Of internal renewable water resources withdrawn each year (2022): Oman uses more water than it renews. | 293 Mm³ Of water saved per year in the central scenario, 22% of agricultural water. |
377,066 t Of dates produced in 2022 (NCSI), from about 9.1 million date palms (ministry, 2023). | 4.12 bn$ Of agricultural imports in 2024, against 969 M$ of exports (FAOSTAT). | 12,821 t Of nitrogen used by Omani agriculture in 2024, while Oman produced 1.64 Mt of nitrogen (FAOSTAT). |
Key figures
Key indicators for Oman
Indicator | Value | Year | Source (level) |
|---|---|---|---|
Agricultural water withdrawals | 1,320 million m³ | 2022 | World Bank (A1, A) |
Withdrawals / internal renewable resources | 116.7% | 2022 | World Bank (A1, A) |
Area actually irrigated | 107,100 ha | 2023 | FAOSTAT (A4, A) |
Solar radiation (main towns) | 2,104 to 2,307 kWh/m²/year | 2005–2020 | PVGIS (A11, A) |
Rainfall (main towns) | 22 to 158 mm/year | 1991–2020 | ERA5-Land (A12, B) |
Date production | 377,066 t | 2022 | NCSI (A8, A) |
Potential water saving (central) | 293 million m³/year | Scenario | Calculation (Annex B) |
Source: See the « Source » column; levels explained in the foreword.
1. Green Solutions and our products
Green Solutions develops products for water, fertilisation and crop protection. Four families concern this dossier. The performances cited are those published by the manufacturer or by the trials, with their confidence level.
Products covered by this dossier
Product | Claimed use | Published evidence | Level |
|---|---|---|---|
EVERGREEN® (water retainer) | Holds rain or irrigation water as a gel, close to the roots | Trials on maize, potato, watermelon, date palm, soybean (sections 8 and 9) | B to C |
ECOSORB® (water retainer based on maize starch) | Same use; effect lasts 2 to 3 years according to the website | Soybean trial (China); laboratory acrylamide analysis | B to C |
ECOFERT® (fertiliser) | Fertiliser certified by SOHISCERT and EU Organic | Published certificate; potato trial combined with EVERGREEN | A (certificate), C (results) |
Paulownia ALTIFOLIA® | Fast-growing tree for agroforestry | Website figures; no trial in Oman | C |
Water Vital®, NAPEMA® | Outside the scope of this dossier | No independent source in the documents consulted | — |
Source: Green Solutions website (product sheets and published trials), Annex A, sources A20 to A27.
A market-gardening training institute in France is among our pilot trials with ECOSORB® and ECOFERT®. It is a field reference, not statistical evidence (level C).
The indicative dose published on the website is 30 to 75 kg/ha.
2. Oman in figures
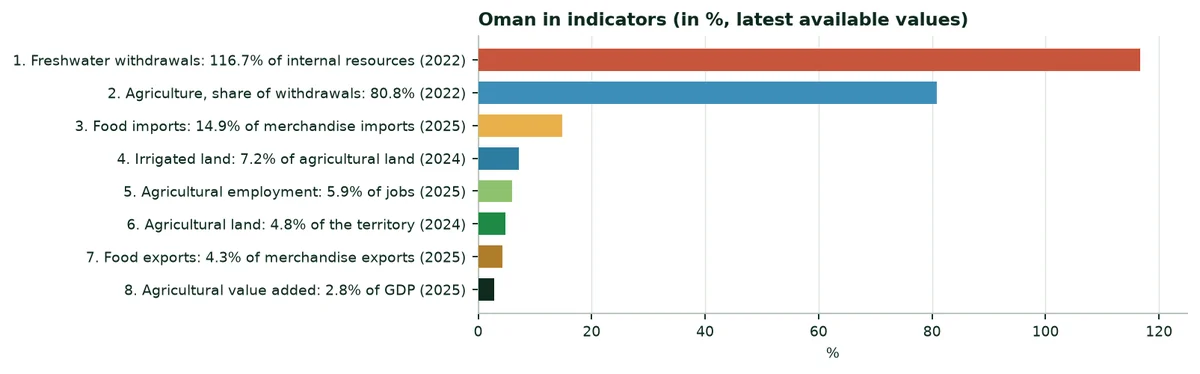
Oman has about 5.49 million inhabitants (2025) on 309,500 km², and an economy of 109.6 billion dollars (2025). Agriculture accounts for 2.8% of gross domestic product and 5.9% of jobs. Cropland covers only 129,180 ha, less than half a percent of the territory, and all of it is irrigated.
National benchmarks
Indicator | Value | Year | Source |
|---|---|---|---|
Population | 5.49 million inhabitants | 2025 | World Bank (A1) |
Gross domestic product | 109.6 billion current US$ | 2025 | World Bank (A1) |
GDP per capita | 19,947 US$ | 2025 | World Bank (A1) |
Agricultural value added | 2.8% of GDP | 2025 | World Bank (A1) |
Agricultural employment | 5.9% of jobs | 2025 | World Bank (A1) |
Agricultural land (mostly rangeland) | 4.8% of the territory | 2024 | World Bank (A1) |
Cropland (arable land and permanent crops) | 129,180 ha | 2024 | FAOSTAT (A4) |
Area equipped for irrigation | 123,030 ha | 2024 | FAOSTAT (A4) |
Area actually irrigated | 107,100 ha | 2024 | FAOSTAT (A4) |
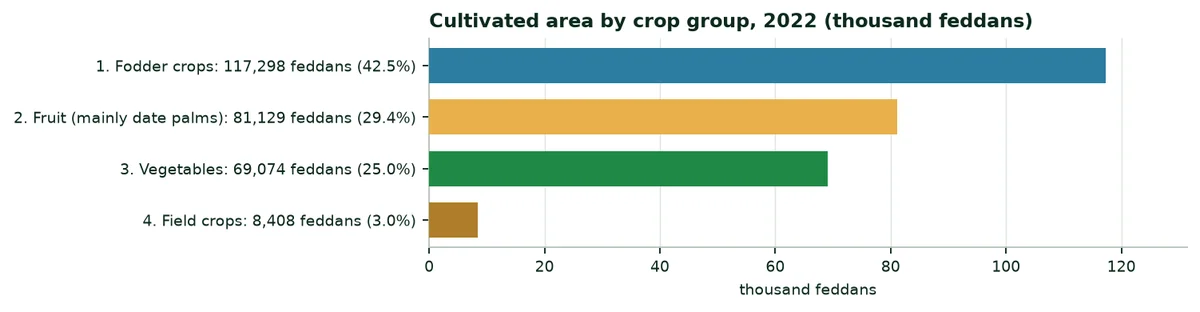
Cultivated area (national statistics) | 275,909 feddans, about 115,882 ha | 2022 | NCSI (A7) |
Fertiliser used | 341 kg/ha of arable land | 2024 | World Bank (A1) |
Freshwater withdrawals | 116.7% of internal resources | 2022 | World Bank (A1) |
Internal water resources | 296 m³ per person per year | 2022 | World Bank (A1) |
Average precipitation | 125 mm per year | 2022 | World Bank (A1) |
Food exports | 4.3% of merchandise exports | 2025 | World Bank (A1) |
Food imports | 14.9% of merchandise imports | 2025 | World Bank (A1) |
Source: World Bank, WDI database (A1); FAOSTAT (A4); National Centre for Statistics and Information (A7).
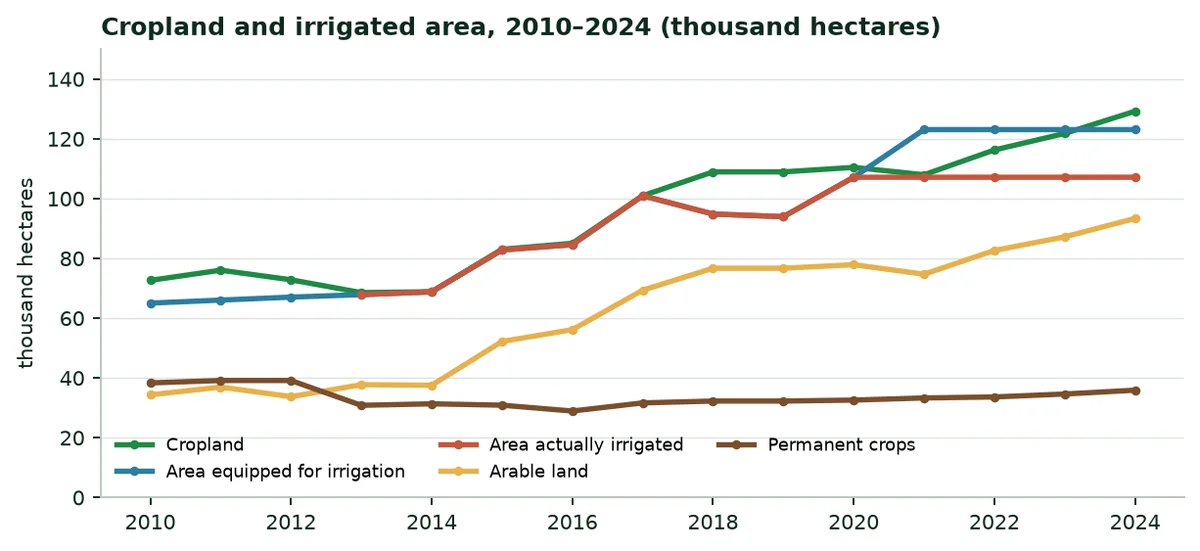
Cropland grew from 72.6 thousand hectares in 2010 to 129.2 thousand in 2024 according to FAOSTAT, mainly through arable land. The area equipped for irrigation follows the same path: Every new hectare is a new demand on groundwater.
3. Sunshine, rainfall and climate change
3.1 Sunshine
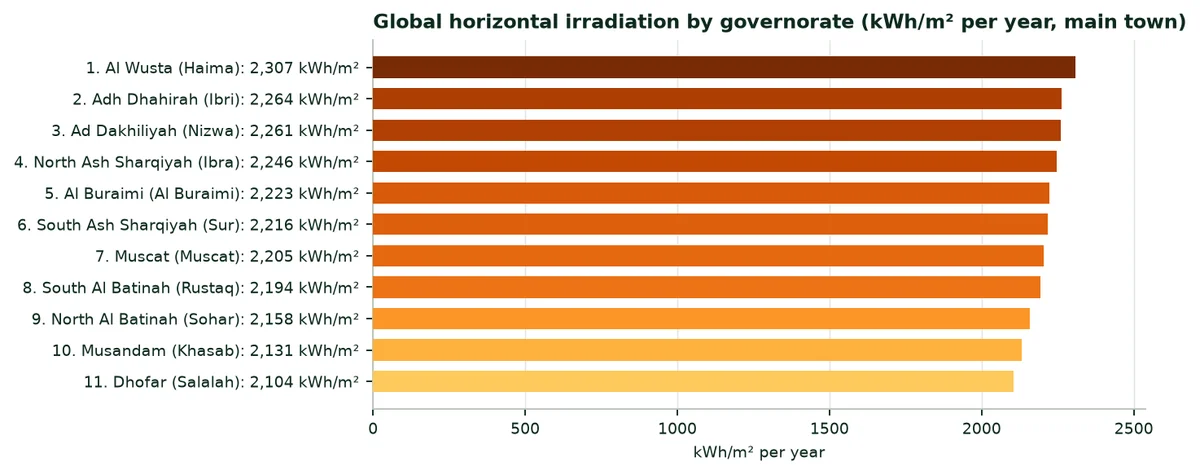
Global horizontal irradiation ranges from 2,104 kWh/m² per year at Salalah to 2,307 kWh/m² at Haima (Al Wusta). The whole country receives very strong sunshine: It favours photosynthesis, but also evaporation from soils and crops. The values are those of the main town of each governorate.
3.2 Rainfall
Rainfall benchmarks
Benchmark | Value | Period | Source (level) |
|---|---|---|---|
Average precipitation, country | 125 mm per year | 2022 | World Bank (A1, A) |
Wettest main town (Khasab, Musandam) | 158 mm per year | 1991–2020 | ERA5-Land (A12, B) |
Driest main town (Haima, Al Wusta) | 22 mm per year | 1991–2020 | ERA5-Land (A12, B) |
Reference evapotranspiration, Nizwa | 2,026 mm per year | 1991–2020 | ERA5-Land (A12, B) |
Reference evapotranspiration, Sohar | 2,020 mm per year | 1991–2020 | ERA5-Land (A12, B) |
Source: See the « Source » column.
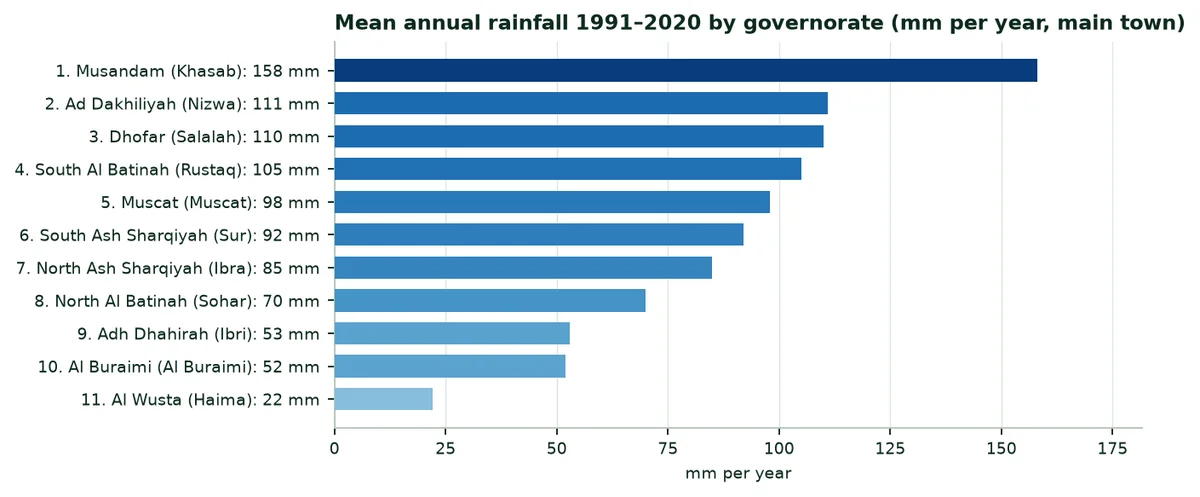
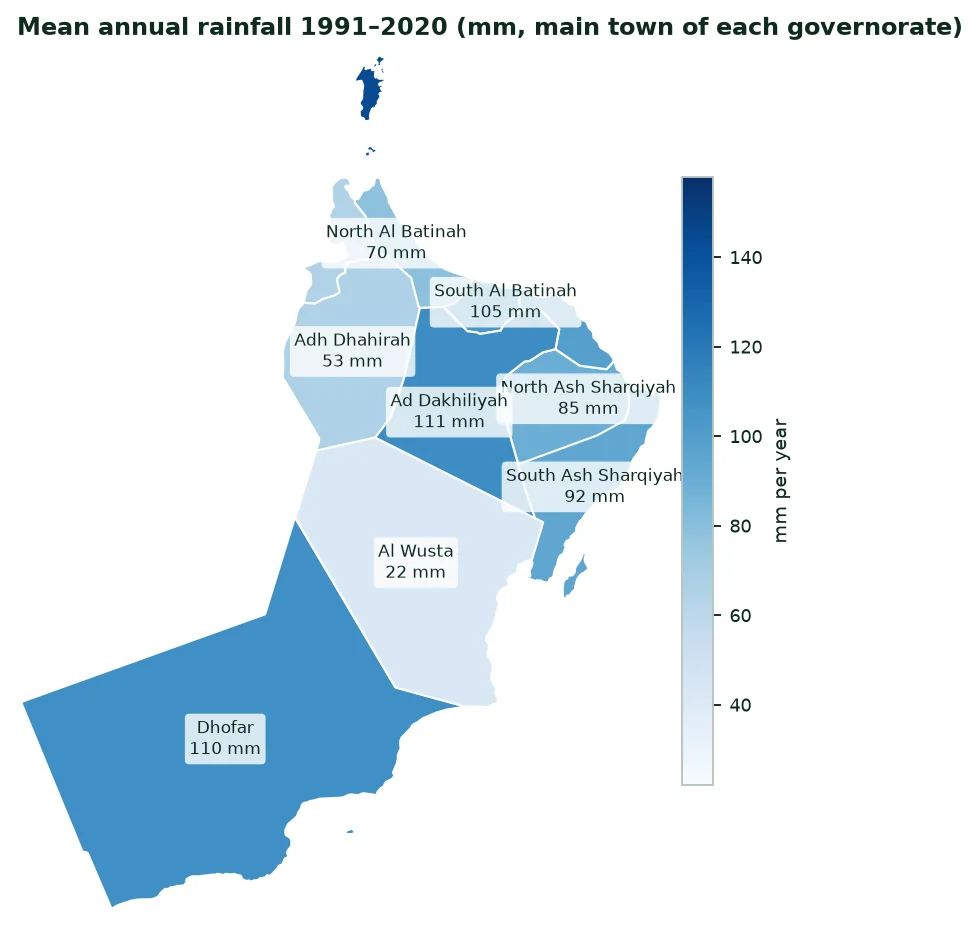
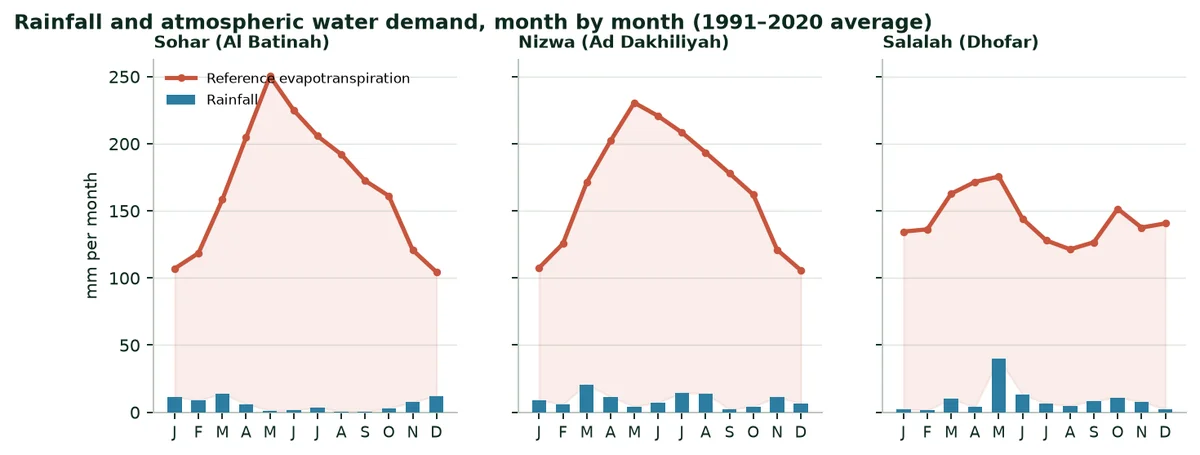
In every month and every region, the atmosphere demands far more water than the rain provides: 100 to 250 mm per month against a few millimetres. The gap is filled by irrigation. Each cubic metre kept in the root zone, instead of evaporating or draining deep, reduces the water that must be pumped.
3.3 Climate change
Climate models cited in 2025 by the Carnegie Endowment foresee a temperature rise of 2 to 4 °C by 2050 in Oman, with more irregular and reduced rainfall. Most of the territory already receives less than 100 mm per year. Oman's environmental policy is framed by its nationally determined contribution and its National Strategy for Adaptation and Mitigation to Climate Change (2020–2040).
Climate risks for agriculture
Risk | What is observed or projected | Source (level) |
|---|---|---|
Higher temperatures | +2 to +4 °C by 2050 | Carnegie Endowment, 2025 (A18, B) |
Rainfall | More irregular and lower | Carnegie Endowment, 2025 (A18, B) |
Soil and aquifer salinity | Seawater advancing into the Al Batinah coastal aquifers | Sultan Qaboos University studies (A15, A16, B) |
Decline of aflaj | About a quarter of the 4,198 aflaj recorded are no longer active | Ministry figures reported by the press, 2025 (A17, C) |
Extreme events | Cyclones and flash floods (Gonu 2007, Shaheen 2021) | Public record |
Source: See the « Source » column.
4. Irrigation water: Volumes, prices, investment, scarcity
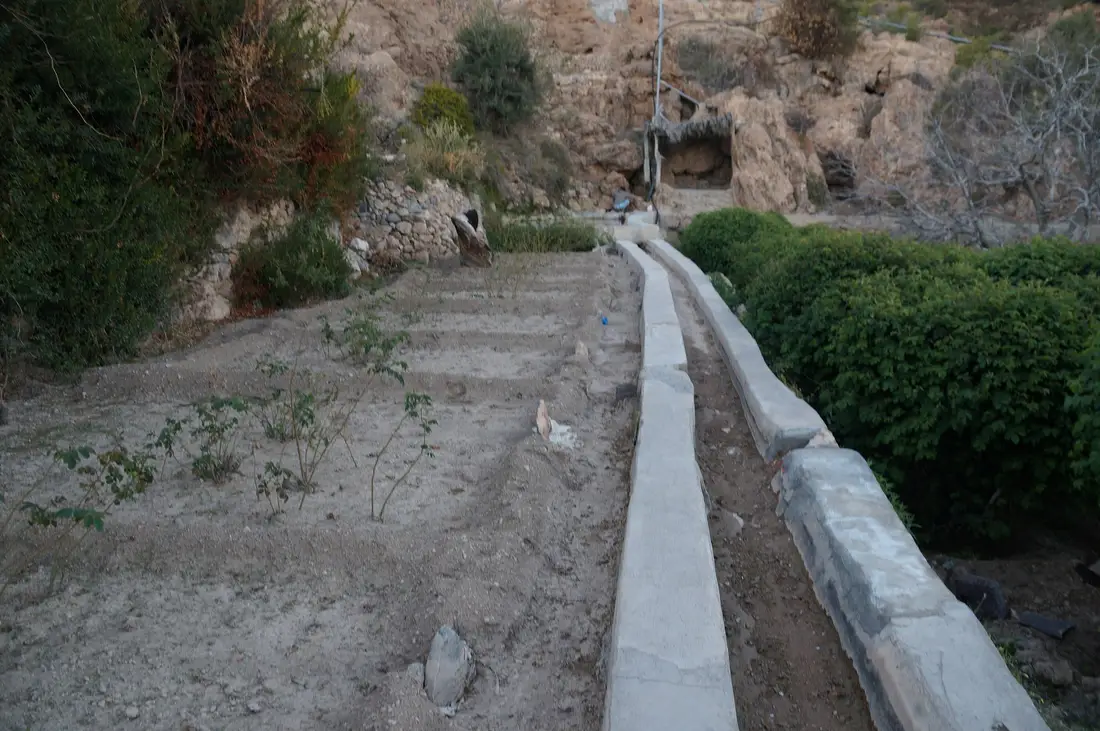
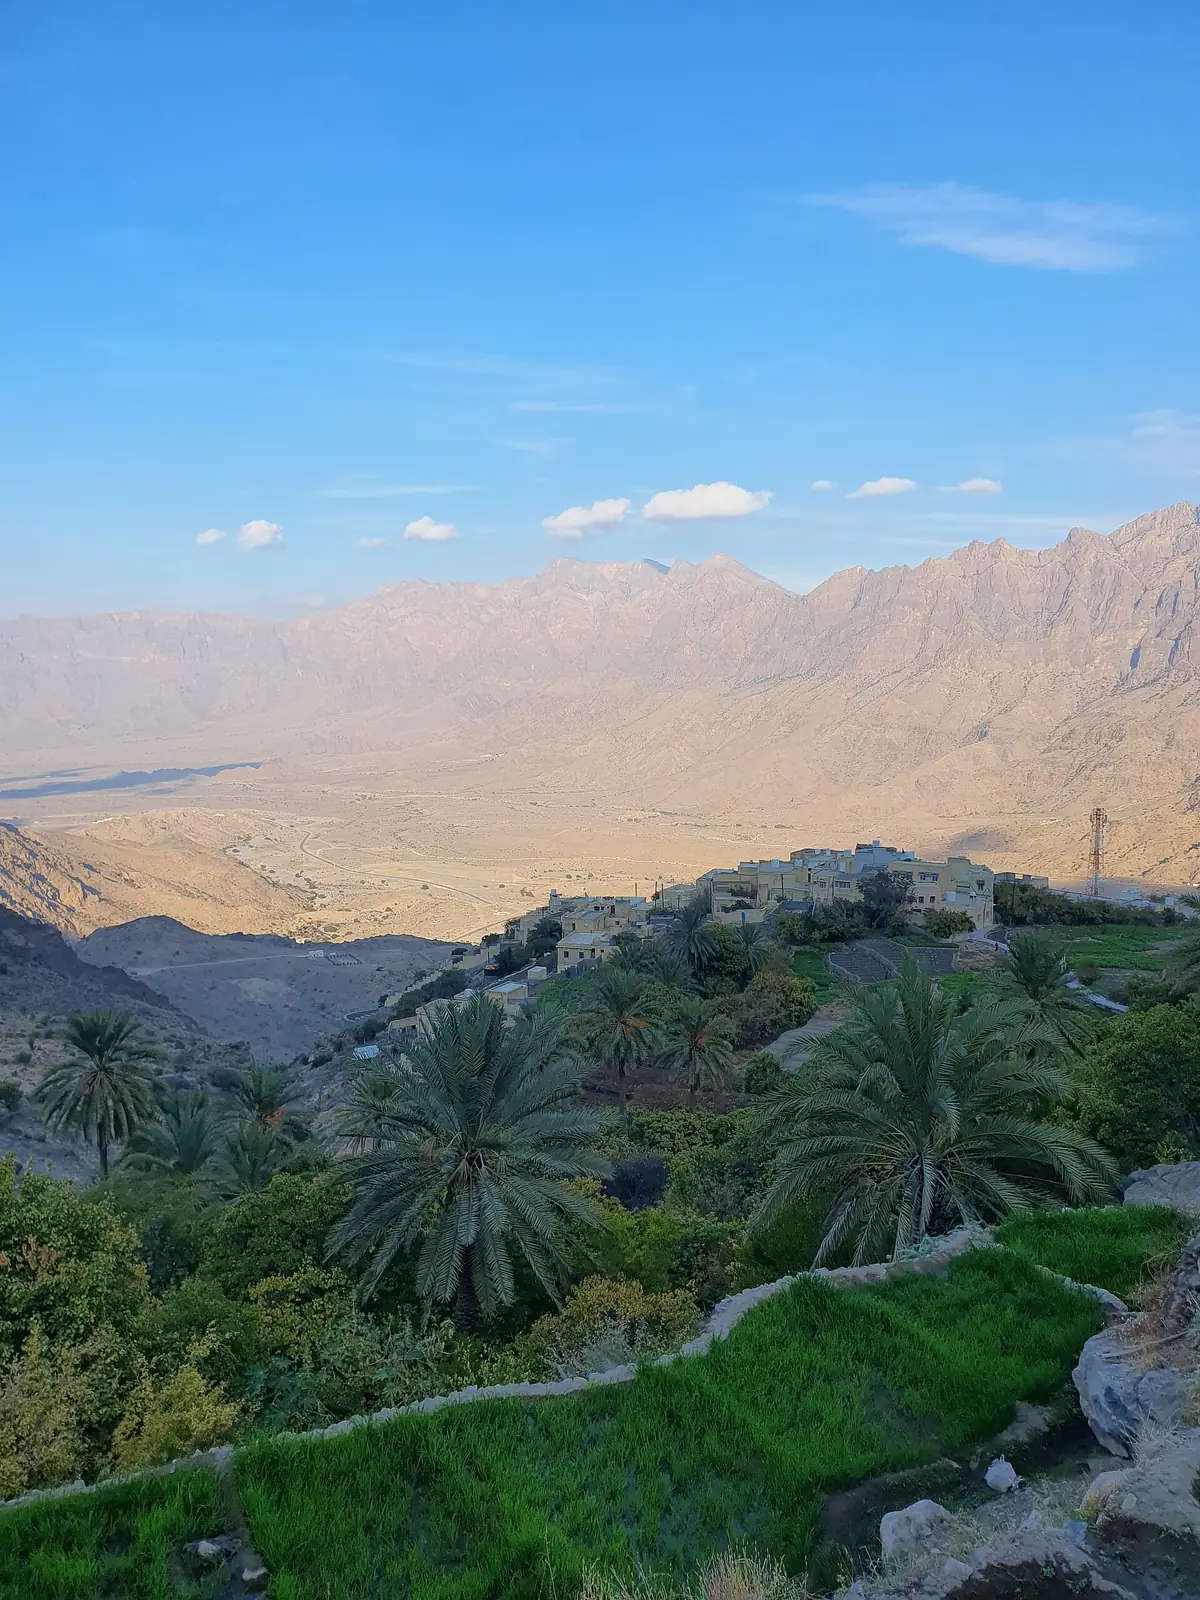
Agriculture is by far the main water user in Oman. Most irrigation water is groundwater, pumped from wells or carried by aflaj, the traditional channels that bring water from aquifers and springs to the villages. Surface water is rare and comes in short floods.
4.1 Volumes withdrawn
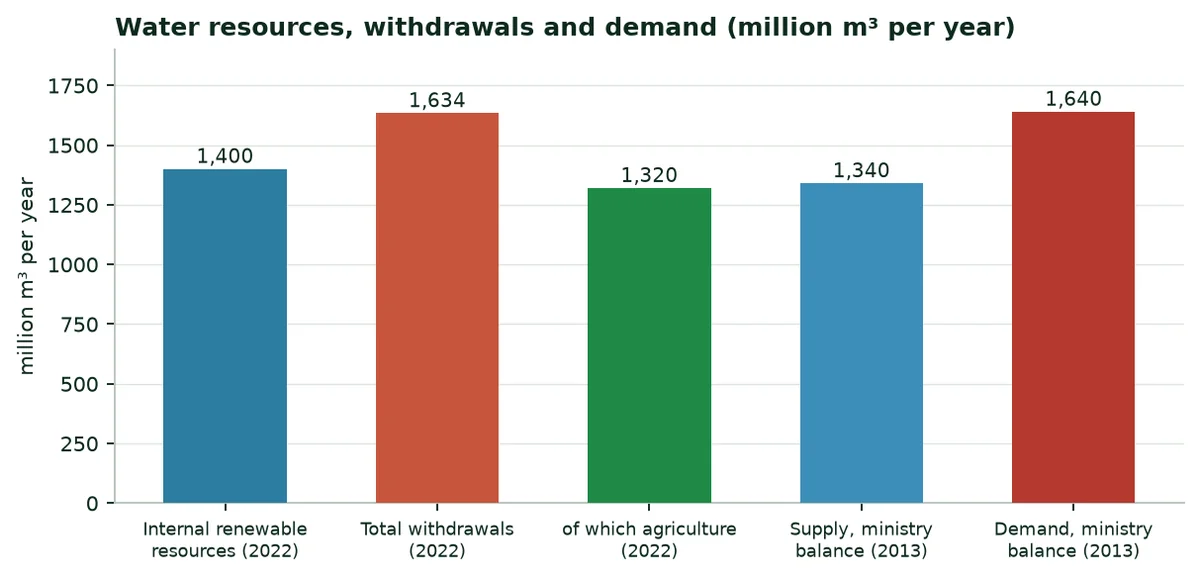
Water volumes, in million m³ per year
Estimate | Agriculture | Total | Source (level) |
|---|---|---|---|
Withdrawals 2022 | 1,320 (81%) | 1,634 | World Bank and AQUASTAT (A1, A) |
Internal renewable resources 2022 | — | 1,400 | World Bank and AQUASTAT (A1, A) |
Ministry water balance 2013, supply | — | ≈ 1,340 | Ministry presentation (A14, B) |
Ministry water balance 2013, demand | 83 to 92 % of conventional resources | ≈ 1,640 | Ministry presentation (A14, B) |
Water supplied by active aflaj | Irrigation and villages | ≈ 552 | Press, 2025 (A17, C) |
Source: See the « Source » column.
According to the ministry, abstraction exceeds natural recharge by 25 to 30 %. The deficit, about 300 Mm³ per year in 2013, is met by drawing down aquifers. On the Al Batinah coast, the falling water table lets seawater move inland: A 2022 model of Wadi Al Jizi projects a further advance of 0.8 km by 2040 if pumping continues at the current rate (A16, level B).
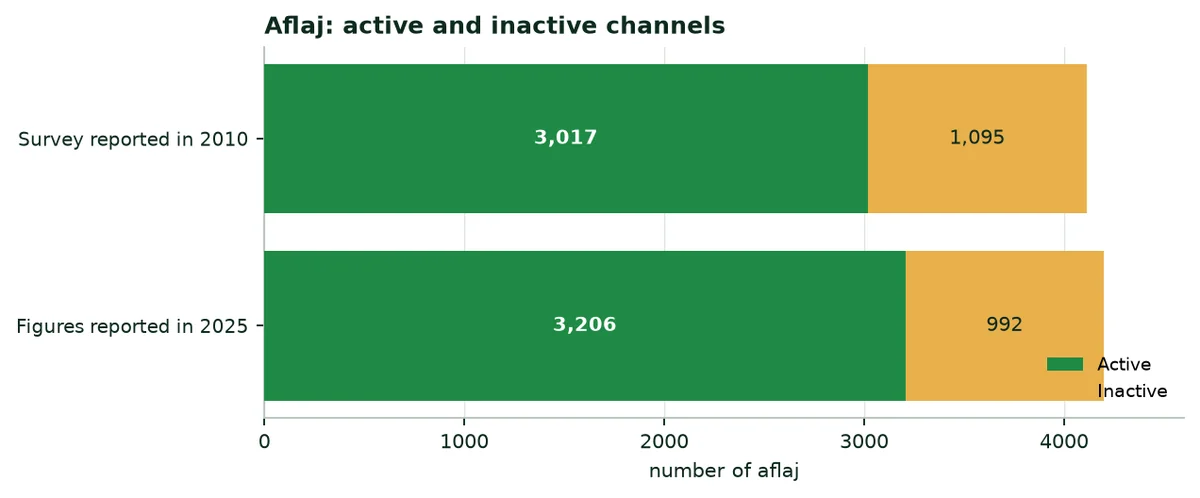
Between the two counts, the number of aflaj recorded rose from 4,112 to 4,198 and the number of active aflaj from 3,017 to 3,206. About a quarter of the aflaj still carry no water. Where a falaj weakens, farms turn to wells, which adds to the pressure on aquifers.
4.2 Irrigated area and water per hectare
Divided by the 115,882 ha cultivated in 2022, the 1,320 Mm³ of agricultural water represent about 11,391 m³ per hectare per year. Date palms and fodder use more than this average, vegetables less: The dossier keeps the average, which understates the weight of date palms.
Irrigation benchmarks
Benchmark | Value | Year | Source (level) |
|---|---|---|---|
Area equipped for irrigation | 123,030 ha | 2024 | FAOSTAT (A4, A) |
Area actually irrigated | 107,100 ha | 2024 | FAOSTAT (A4, A) |
Cultivated area (crop groups) | 275,909 feddans, 115,882 ha | 2022 | NCSI (A7, A) |
Water per cultivated hectare (calculation) | 11,391 m³ | 2022 | Calculation: A1 ÷ A7 |
Share of the equipped area in Al Batinah | 57 % | 1993 | FAO country profile (A4, A) |
Source: See the « Source » column.
4.3 Water prices
No price for agricultural water was found in the sources consulted: Farms pump groundwater from their own wells, and aflaj water is shared by traditional rights. The real cost of a cubic metre is the cost of pumping, and, at the margin, the cost of the desalinated water that cities increasingly use instead of groundwater.
Reference prices for water
Reference | Price | Context | Source (level) |
|---|---|---|---|
Agricultural groundwater | No tariff found | Pumped from private wells | Sources consulted |
Desalinated water, production | About 0.4 OMR per m³ (≈ 1.04 $) | Comparison in a ministry presentation | Ministry presentation (A14, B) |
Barka I plant, variable charge | 0.050 OMR per m³, plus a capacity charge | Bulk supply tariff, 2009 | Nama PWP (A13b, A) |
Source: See the « Source » column.
To value the water saved, the dossier therefore uses three reference values: 0.25, 0.50 and 1.00 US dollar per m³. The highest is close to the cost of desalinated water. They are assumptions, not official tariffs.
4.4 Public investment
Water and agriculture programmes
Programme | Purpose | Period | Source (level) |
|---|---|---|---|
Recharge dams | Capture flash floods to recharge aquifers; new dams announced in North Ash Sharqiyah in 2024 | Ongoing | Press (A17, C) |
Aflaj maintenance | Repair and protection of aflaj; 34 aflaj maintained in one recent programme | Ongoing | Press (A17, C) |
Relocating fodder | Phase out Rhodes grass in the Al Batinah and Salalah plains, develop the Najd | Since the 2000s | Sultan Qaboos University (A15, B) |
Land for reclamation | 5.5 million feddans identified as suitable for agriculture | 2023 | Ministry annual report (A10, B) |
Oman Vision 2040 | Food security and diversification of the economy | 2021–2040 | Ministry annual report (A10, B) |
Source: See the « Source » column.
4.5 Scarcity and salinity
Scarcity in Oman is structural rather than seasonal: Aquifers are over-drawn every year. The visible signs are salinity in coastal wells, falling flows in aflaj, and abandoned farms on the Al Batinah coast. Reducing the water applied per tree or per plant, without losing yield, is one of the few levers that act at the farm itself.
5. Fertilisers: Quantities, prices, spending
5.1 Quantities used
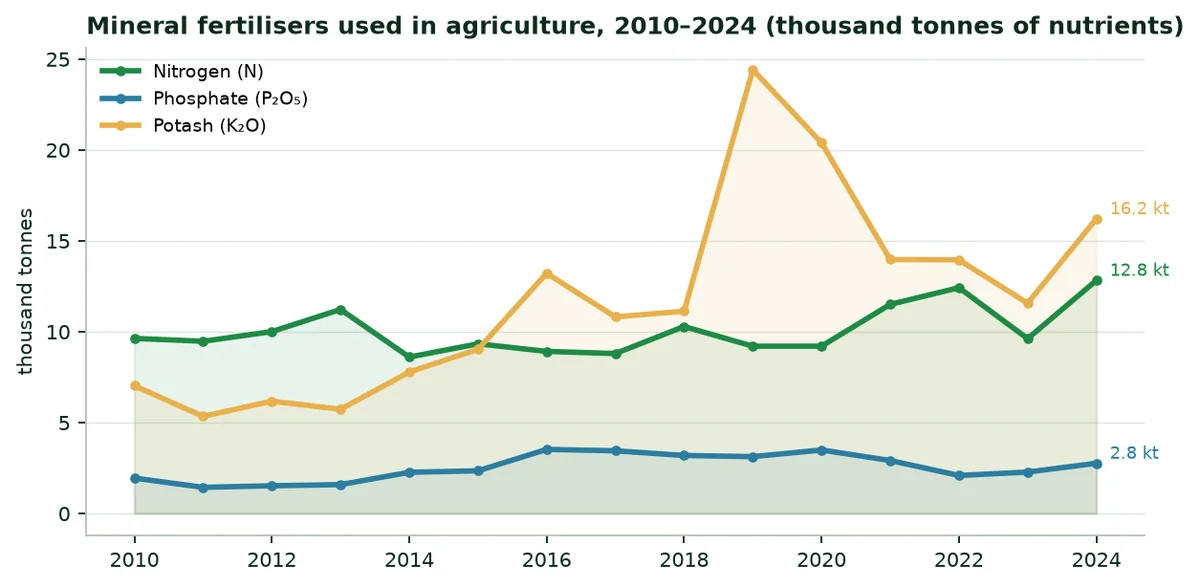
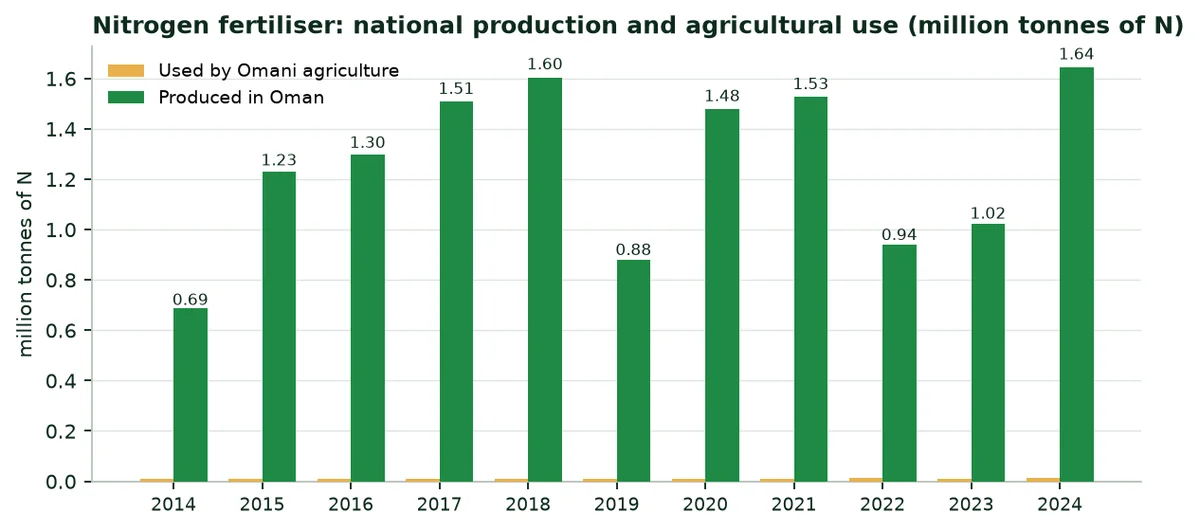
Omani agriculture used 12,821 t of nitrogen (N), 2,760 t of phosphate (P₂O₅) and 16,210 t of potash (K₂O) in 2024. Oman is at the same time a large producer of nitrogen fertiliser: 1.64 million tonnes of N in 2024, almost all exported (1.64 Mt). Phosphate and potash are imported.
Fertilisers used, in tonnes of nutrients
Year | Nitrogen (N) | Phosphate (P₂O₅) | Potash (K₂O) | N produced |
|---|---|---|---|---|
2019 | 9,200 | 3,124 | 24,410 | 881,002 |
2020 | 9,200 | 3,491 | 20,393 | 1,479,934 |
2021 | 11,500 | 2,911 | 13,969 | 1,526,672 |
2022 | 12,420 | 2,088 | 13,951 | 939,335 |
2023 | 9,615 | 2,277 | 11,568 | 1,022,814 |
2024 | 12,821 | 2,760 | 16,210 | 1,642,943 |
Source: FAOSTAT (A5).
5.2 Prices
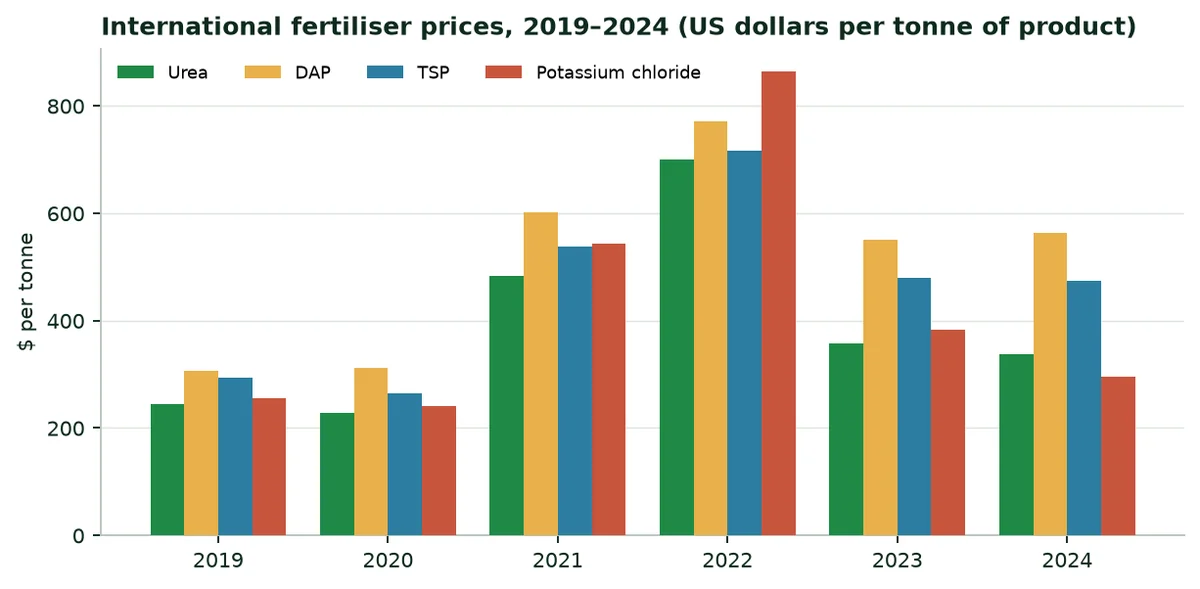
International fertiliser prices doubled in 2021–2022, then fell back. In 2024, urea was worth 338 dollars per tonne and potassium chloride 295 dollars. Prices paid by Omani farmers, including transport and margins, are higher.
International prices, in US dollars per tonne
Year | Urea | DAP | TSP | Potassium chloride |
|---|---|---|---|---|
2019 | 245 | 306 | 294 | 256 |
2020 | 229 | 312 | 265 | 241 |
2021 | 483 | 601 | 538 | 543 |
2022 | 700 | 772 | 716 | 863 |
2023 | 358 | 550 | 480 | 383 |
2024 | 338 | 564 | 475 | 295 |
Source: World Bank (A13), annual averages.
5.3 Indicative spending
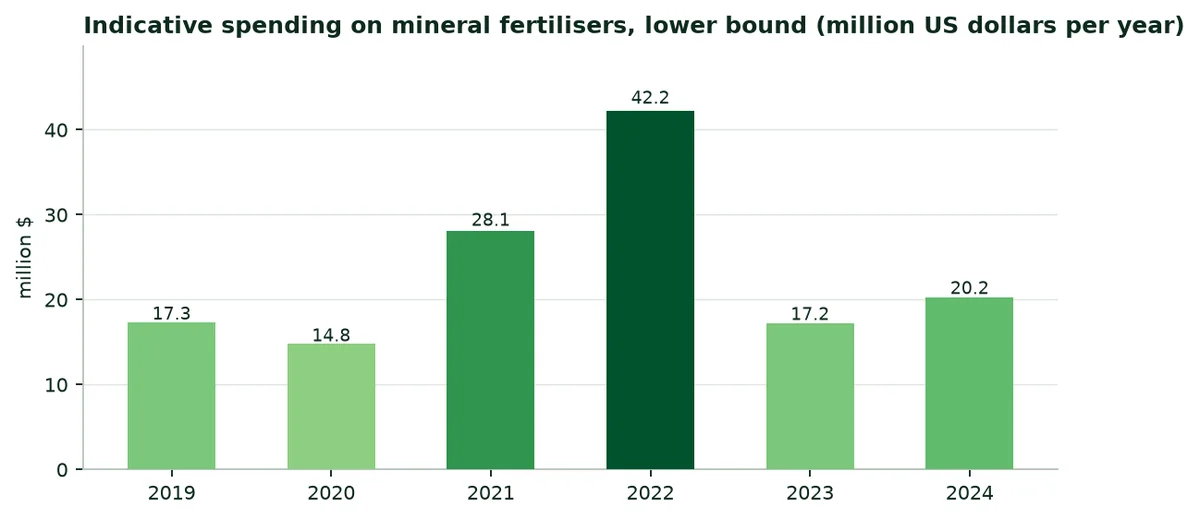
 Converted into urea, triple superphosphate and potassium chloride, the nutrients used represent spending of at least 20.2 million dollars in 2024, and 42.2 million in 2022, the year of the price peak.
6. By governorate
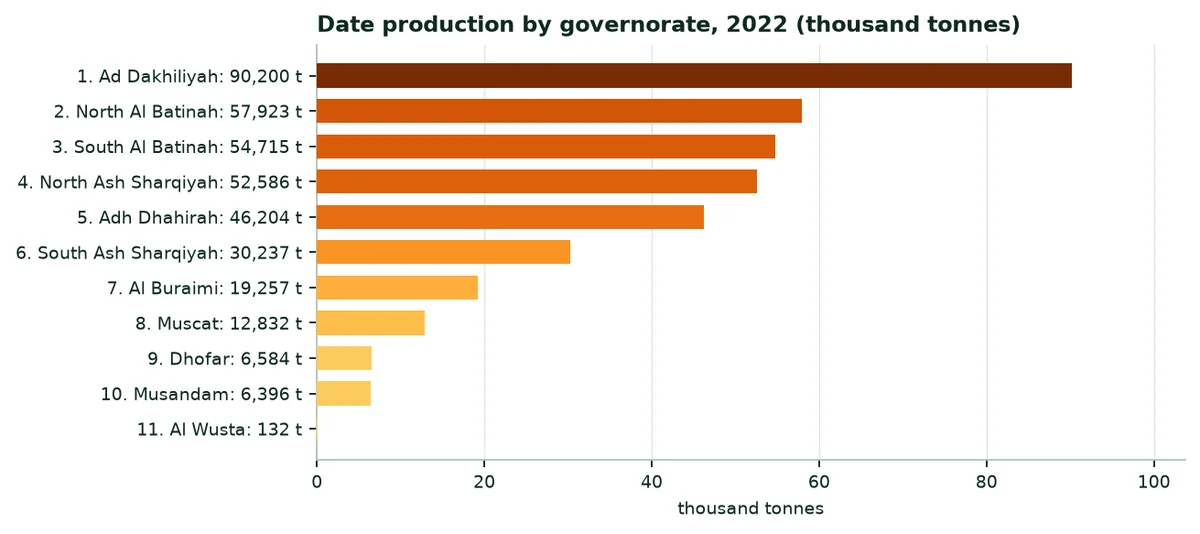
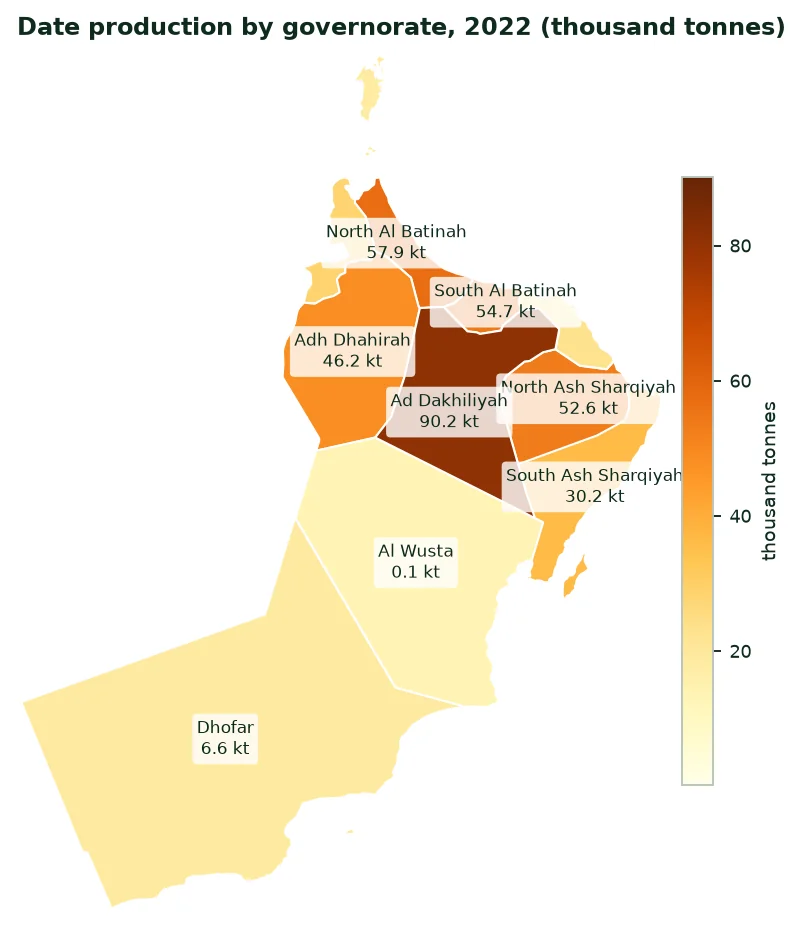
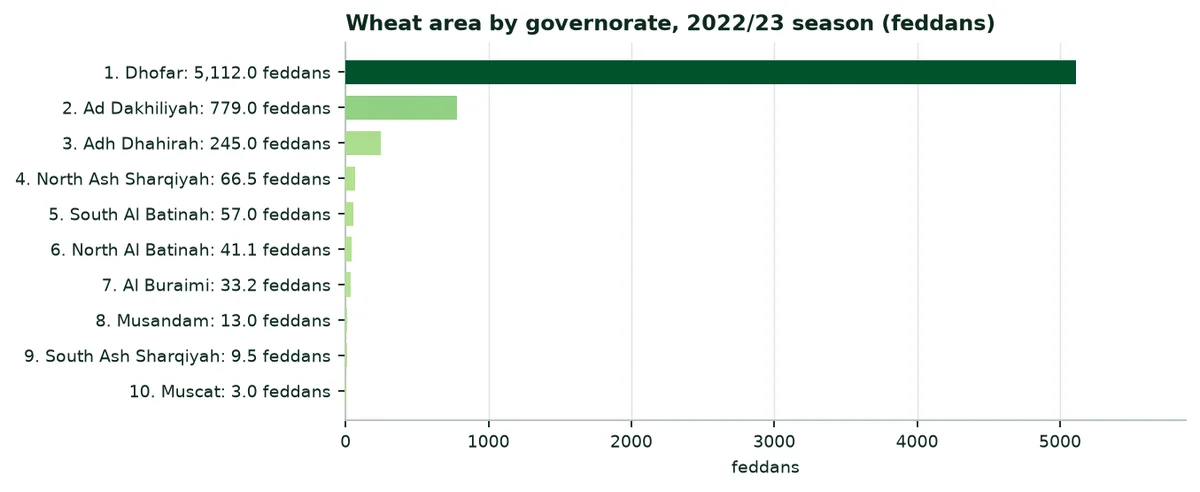
The cultivated area by governorate is not published in the sources consulted after the 2012–2013 agricultural census, when North and South Al Batinah held about 37 % of the cultivated area. Date production and the wheat area are published by governorate and show where agriculture weighs most.
Climate, dates and wheat by governorate
Governorate | Main town | Radiation (kWh/m²/yr) | Rainfall (mm/yr) | Dates 2022 (t) | Share of dates | Wheat 2022/23 (feddans) |
|---|---|---|---|---|---|---|
Ad Dakhiliyah | Nizwa | 2,261 | 111 | 90,200 | 23.9% | 779.0 |
North Al Batinah | Sohar | 2,158 | 70 | 57,923 | 15.4% | 41.1 |
South Al Batinah | Rustaq | 2,194 | 105 | 54,715 | 14.5% | 57.0 |
North Ash Sharqiyah | Ibra | 2,246 | 85 | 52,586 | 13.9% | 66.5 |
Adh Dhahirah | Ibri | 2,264 | 53 | 46,204 | 12.3% | 245.0 |
South Ash Sharqiyah | Sur | 2,216 | 92 | 30,237 | 8.0% | 9.5 |
Al Buraimi | Al Buraimi | 2,223 | 52 | 19,257 | 5.1% | 33.2 |
Muscat | Muscat | 2,205 | 98 | 12,832 | 3.4% | 3.0 |
Dhofar | Salalah | 2,104 | 110 | 6,584 | 1.7% | 5,112.0 |
Musandam | Khasab | 2,131 | 158 | 6,396 | 1.7% | 13.0 |
Al Wusta | Haima | 2,307 | 22 | 132 | 0.0% | — |
Oman | — | — | — | 377,066 | 100.0% | 6,359.4 |
Source: PVGIS (A11); ERA5-Land (A12); NCSI (A8); Ministry of Agriculture, Fisheries and Water Resources (A9).
7. The twenty main crops: Three rankings
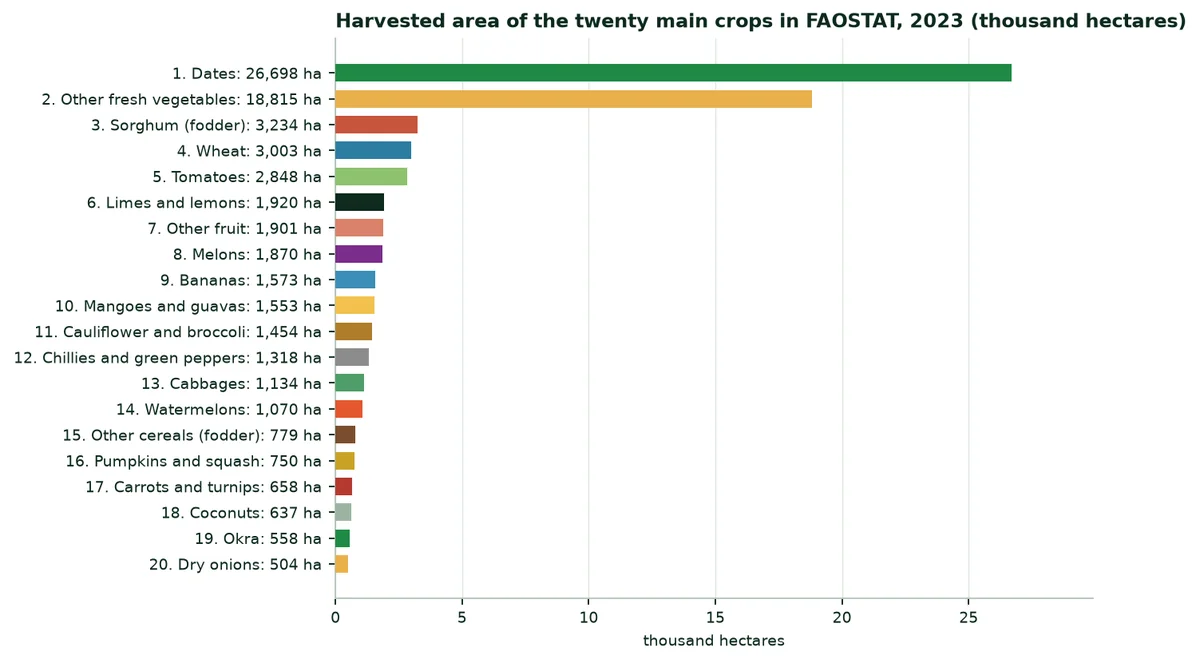
Three rankings complement each other: Area, production and value. Because all crops in Oman are irrigated, the area ranking also gives the irrigated area; the dossier therefore adds a ranking by production. FAOSTAT does not cover fodder crops, which national statistics place first.
7.1 By area
Twenty main crops by harvested area (2023)
Rank | Crop | Area (ha) | Production (t) | Yield (t/ha) |
|---|---|---|---|---|
1 | Dates | 26,698 | 394,946 | 14.8 |
2 | Other fresh vegetables | 18,815 | 446,181 | 23.7 |
3 | Sorghum (fodder) | 3,234 | 182,373 | 56.4 |
4 | Wheat | 3,003 | 7,892 | 2.6 |
5 | Tomatoes | 2,848 | 225,488 | 79.2 |
6 | Limes and lemons | 1,920 | 9,189 | 4.8 |
7 | Other fruit | 1,901 | 41,698 | 21.9 |
8 | Melons | 1,870 | 49,943 | 26.7 |
9 | Bananas | 1,573 | 18,432 | 11.7 |
10 | Mangoes and guavas | 1,553 | 16,149 | 10.4 |
11 | Cauliflower and broccoli | 1,454 | 31,041 | 21.3 |
12 | Chillies and green peppers | 1,318 | 166,943 | 126.7 |
13 | Cabbages | 1,134 | 43,300 | 38.2 |
14 | Watermelons | 1,070 | 41,445 | 38.7 |
15 | Other cereals (fodder) | 779 | 31,738 | 40.7 |
16 | Pumpkins and squash | 750 | 19,467 | 26.0 |
17 | Carrots and turnips | 658 | 30,322 | 46.1 |
18 | Coconuts | 637 | 6,733 | 10.6 |
19 | Okra | 558 | 7,567 | 13.6 |
20 | Dry onions | 504 | 17,197 | 34.1 |
Source: FAOSTAT, crop production 2023 (A2); aggregates excluded. Sorghum and « other cereals » are grown as green fodder.
7.2 By production
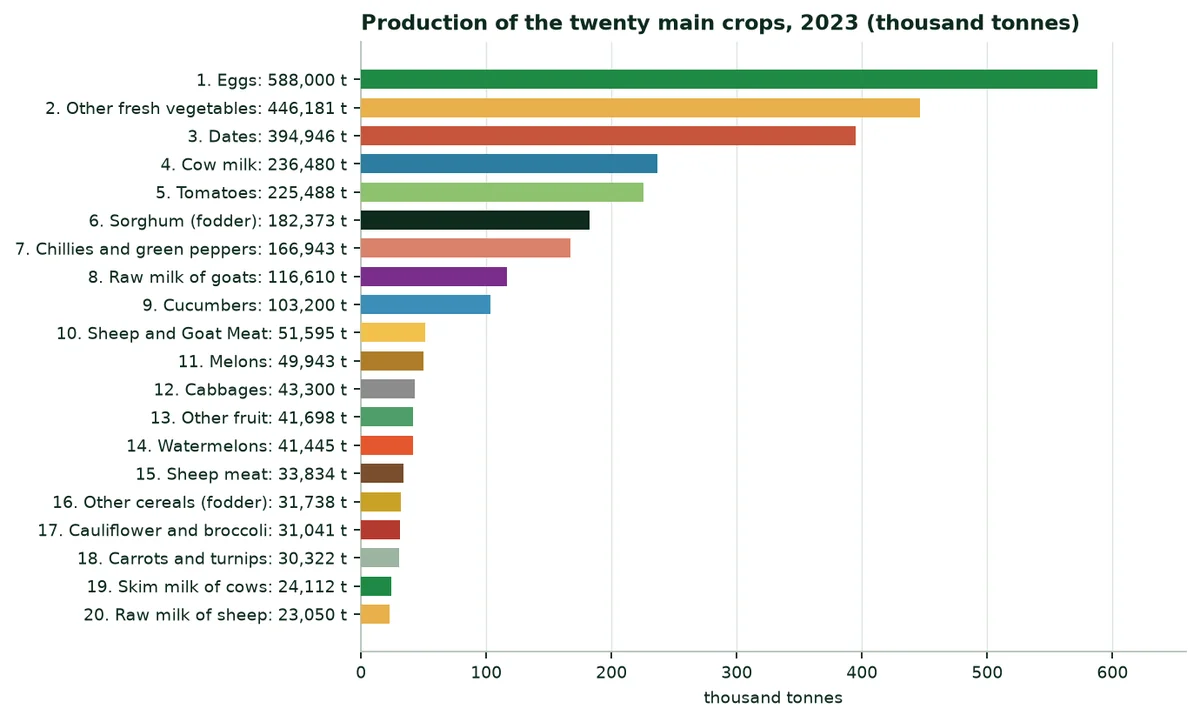
In tonnes, dates come first (394,946 t in 2023 according to FAOSTAT), followed by fresh vegetables, tomatoes, green fodder sorghum and peppers. Vegetables yield high tonnages on small areas, often in greenhouses.
7.3 By value of production
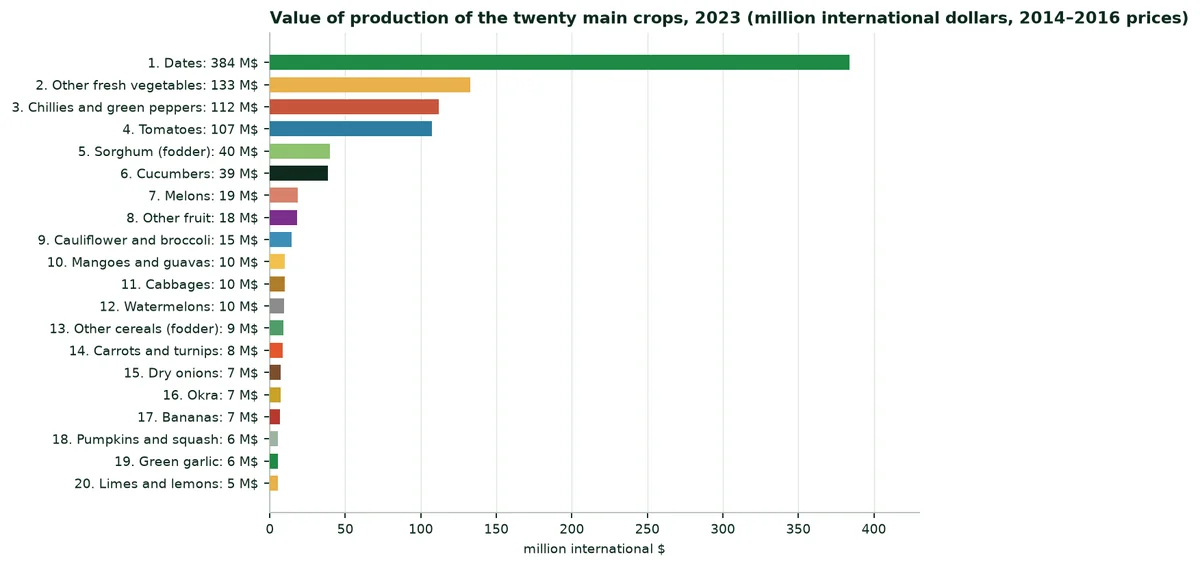
In value, dates come first by a wide margin, with 40% of the value of all crops, followed by vegetables, peppers and tomatoes. The total reaches 0.97 billion international dollars in 2023 (constant 2014–2016 prices).
Value of production by crop (2023, constant 2014–2016 prices)
Rank | Crop | Value (million international $) | Share of crops |
|---|---|---|---|
1 | Dates | 383.9 | 39.7% |
2 | Other fresh vegetables | 132.6 | 13.7% |
3 | Chillies and green peppers | 112.0 | 11.6% |
4 | Tomatoes | 107.4 | 11.1% |
5 | Sorghum (fodder) | 39.6 | 4.1% |
6 | Cucumbers | 38.6 | 4.0% |
7 | Melons | 18.7 | 1.9% |
8 | Other fruit | 17.9 | 1.8% |
9 | Cauliflower and broccoli | 14.6 | 1.5% |
10 | Mangoes and guavas | 10.1 | 1.1% |
11 | Cabbages | 9.9 | 1.0% |
12 | Watermelons | 9.6 | 1.0% |
13 | Other cereals (fodder) | 9.2 | 1.0% |
14 | Carrots and turnips | 8.4 | 0.9% |
15 | Dry onions | 7.2 | 0.7% |
16 | Okra | 7.2 | 0.7% |
17 | Bananas | 6.6 | 0.7% |
18 | Pumpkins and squash | 5.6 | 0.6% |
19 | Green garlic | 5.5 | 0.6% |
20 | Limes and lemons | 5.3 | 0.6% |
Source: FAOSTAT, value of agricultural production (A3).
8. Extrapolation by crop and water savings
8.1 Method
8.2 Trials used as analogues
Trials cited and their use in the calculation
Trial | Published water saving | Published yield gain | Use in this dossier | Level |
|---|---|---|---|---|
Date palm, UAE (ICBA, 2020–2021) | −82 % | +20 % | Date palms | B |
Watermelon, Mexico (2023) | −60.5 % | +30 % | Vegetables and melons | C |
Soybean, China (Shandong) | Not measured | +11.2 to 11.4 % | Yield of field crops | B |
Maize, Turkey (TIGEM, 2025) | −39 % | +17.1 % | Not used (little grain maize in Oman) | C |
Potato, South Africa (2025–2026) | −52 % | +31.4 % | Not used separately (included in vegetables) | C |
Source: Trials published on the Green Solutions website (A20 to A24).
The ICBA trial is the most relevant for Oman: 27 date palms about eight years old, in sandy and saline soil at Dubai, a climate with about 50 mm of rain per year. EVERGREEN was mixed into the top 50 cm of soil; irrigation was driven by soil-moisture probes. The treated trees used 82 % less irrigation water over the season, showed no sign of stress, and gave 20 % more dates at the 300 g dose.
8.3 Parameters by crop group
Water saving and yield gain used, by scenario (cautious / central / strong)
Group | Analogue | Water | Yield |
|---|---|---|---|
Date palms | Date palm, UAE (ICBA, 2020-2021) | 20.5% / 41.0% / 82.0% | 5.0% / 10.0% / 20.0% |
Fodder crops (Rhodes grass, alfalfa, fodder sorghum) | Generic assumption, no trial | 5.0% / 10.0% / 20.0% | — |
Other fruit (limes, bananas, mangoes…) | Generic assumption, no trial | 5.0% / 10.0% / 20.0% | — |
Vegetables and melons | Watermelon, Mexico (2023) | 15.1% / 30.2% / 60.5% | 7.5% / 15.0% / 30.0% |
Field crops (wheat, barley…) | Water: Generic assumption; yield: Soybean, China | 5.0% / 10.0% / 20.0% | 2.8% / 5.7% / 11.3% |
Source: Author's calculation (Annex B).
8.4 National results
293 Mm³ Of water saved per year in the central scenario (22% of agricultural water). | 147 to 586 Million m³ per year, from the cautious to the strong scenario. | 207,000 t Of additional production in the central scenario (vegetables, dates, field crops). |
Water saved and value per year, by scenario and value of water
Scenario | Water saved (Mm³/yr) | Share of agricultural water | Water at 0.25 $ (M$) | Water at 0.50 $ (M$) | Water at 1.00 $ (M$) | Yield (M$) |
|---|---|---|---|---|---|---|
Cautious | 147 | 11.1% | 36.6 | 73.3 | 146.6 | 52.1 |
Central | 293 | 22.2% | 73.3 | 146.6 | 293.2 | 104.2 |
Strong | 586 | 44.4% | 146.6 | 293.2 | 586.4 | 208.4 |
Source: Author's calculation (Annex B).
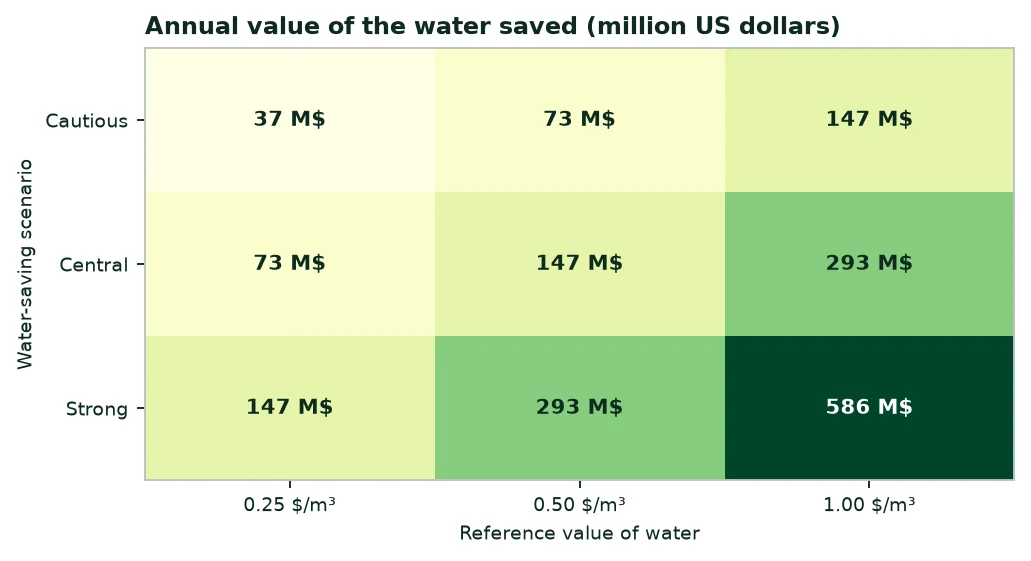
In the central scenario, the total value reaches about 251 million dollars per year: 147 million for water at 0.50 $/m³, and 104 million for the yield gain.
8.5 Water saved by crop (central scenario)
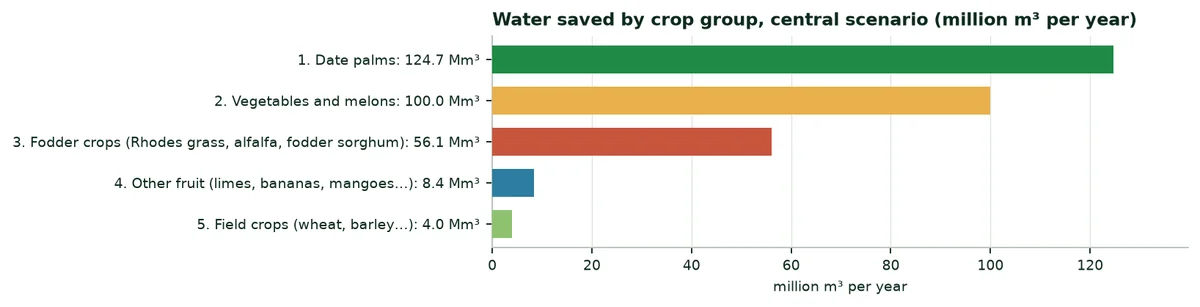
Water saved by crop group (central scenario)
Group | Share of cultivated area | Water used (Mm³/yr) | Water saved (Mm³/yr) | Yield gain (t) |
|---|---|---|---|---|
Date palms | 23.0% | 304 | 124.7 | 39,495 |
Vegetables and melons | 25.0% | 330 | 100.0 | 166,687 |
Fodder crops (Rhodes grass, alfalfa, fodder sorghum) | 42.5% | 561 | 56.1 | — |
Other fruit (limes, bananas, mangoes…) | 6.4% | 84 | 8.4 | — |
Field crops (wheat, barley…) | 3.0% | 40 | 4.0 | 524 |
Source: Author's calculation (Annex B).
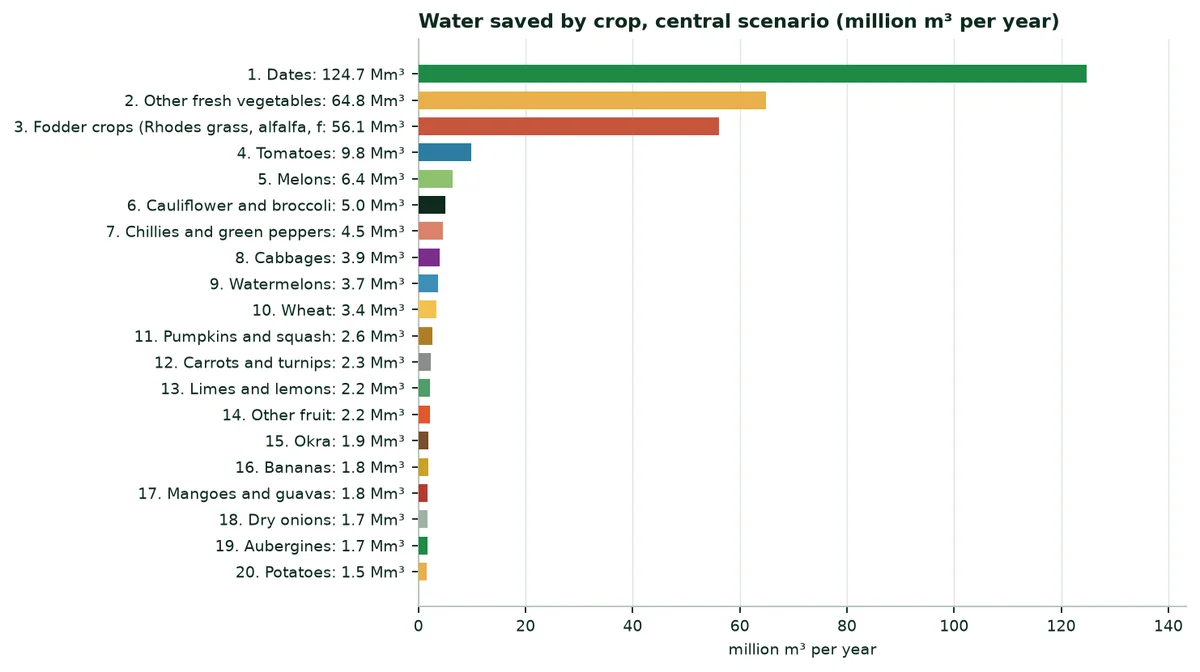
The same calculation, crop by crop, uses the FAOSTAT 2023 areas and the NCSI fodder area. Because the two sources differ slightly, the total differs a little from the total by group.
Water saved by crop, central scenario (twenty first crops)
Rank | Crop | Area (ha) | Water used (Mm³/yr) | Saving rate | Water saved (Mm³/yr) | Analogue |
|---|---|---|---|---|---|---|
1 | Dates | 26,698 | 304.1 | 41.0% | 124.7 | Date palm, UAE |
2 | Other fresh vegetables | 18,815 | 214.3 | 30.2% | 64.8 | Watermelon, Mexico |
3 | Fodder crops (Rhodes grass, alfalfa, fodder sorghum) | 49,265 | 561.2 | 10.0% | 56.1 | Generic |
4 | Tomatoes | 2,848 | 32.4 | 30.2% | 9.8 | Watermelon, Mexico |
5 | Melons | 1,870 | 21.3 | 30.2% | 6.4 | Watermelon, Mexico |
6 | Cauliflower and broccoli | 1,454 | 16.6 | 30.2% | 5.0 | Watermelon, Mexico |
7 | Chillies and green peppers | 1,318 | 15.0 | 30.2% | 4.5 | Watermelon, Mexico |
8 | Cabbages | 1,134 | 12.9 | 30.2% | 3.9 | Watermelon, Mexico |
9 | Watermelons | 1,070 | 12.2 | 30.2% | 3.7 | Watermelon, Mexico |
10 | Wheat | 3,003 | 34.2 | 10.0% | 3.4 | Generic (yield: Soybean) |
11 | Pumpkins and squash | 750 | 8.5 | 30.2% | 2.6 | Watermelon, Mexico |
12 | Carrots and turnips | 658 | 7.5 | 30.2% | 2.3 | Watermelon, Mexico |
13 | Limes and lemons | 1,920 | 21.9 | 10.0% | 2.2 | Generic |
14 | Other fruit | 1,901 | 21.7 | 10.0% | 2.2 | Generic |
15 | Okra | 558 | 6.4 | 30.2% | 1.9 | Watermelon, Mexico |
16 | Bananas | 1,573 | 17.9 | 10.0% | 1.8 | Generic |
17 | Mangoes and guavas | 1,553 | 17.7 | 10.0% | 1.8 | Generic |
18 | Dry onions | 504 | 5.7 | 30.2% | 1.7 | Watermelon, Mexico |
19 | Aubergines | 480 | 5.5 | 30.2% | 1.7 | Watermelon, Mexico |
20 | Potatoes | 438 | 5.0 | 30.2% | 1.5 | Watermelon, Mexico |
Source: FAOSTAT 2023 (A2); NCSI 2022 for fodder (A7); author's calculation (Annex B).
8.6 Reading the results
9. Potential benefits of our products
The table matches each expected benefit with what has been published, its source and its limit. It contains no yield promise.
Benefits, evidence and limits
Benefit | What is published | Source (level) | Limit |
|---|---|---|---|
Less irrigation water | −82 % (date palm), −60.5 % (watermelon), −52 % (potato), −39 % (maize) | Green Solutions and ICBA trials (A20 to A24, B to C) | Trials outside Oman, often on a single plot |
Yield maintained or increased | +20 % (date palm), +30 % (watermelon), +31.4 % (potato), +17.1 % (maize), +11 % (soybean) | Same trials (B to C) | No statistical replication for most |
Resistance to heat and drought | Date palms without visible stress with watering once a week | ICBA (A20, B) | One season, one site |
Sandy and saline soils | Trial carried out in sandy, saline soil | ICBA (A20, B) | To be confirmed on Omani soils |
Fewer fertiliser losses | Higher nutrient levels in the root zone (date palm) | ICBA (A20, B) | Not quantified as fertiliser saved |
Organic fertilisation | ECOFERT® certified by SOHISCERT and EU Organic | Certificate (A25, A) | Agronomic effect not isolated |
Source: See the « Source » column.
10. External trade: Exports and imports
10.1 Overview, 2024
Agricultural trade of Oman
Indicator | 2023 | 2024 | Change |
|---|---|---|---|
Agricultural exports (M$) | 1,720 | 969 | -43.7% |
Agricultural imports (M$) | 4,630 | 4,117 | -11.1% |
Agricultural balance (M$) | -2,909 | -3,148 | — |
Share of merchandise exports | — | 1.5% | — |
Share of merchandise imports | — | 9.5% | — |
Source: FAOSTAT, trade in agricultural products (A6); sub-totals excluded.
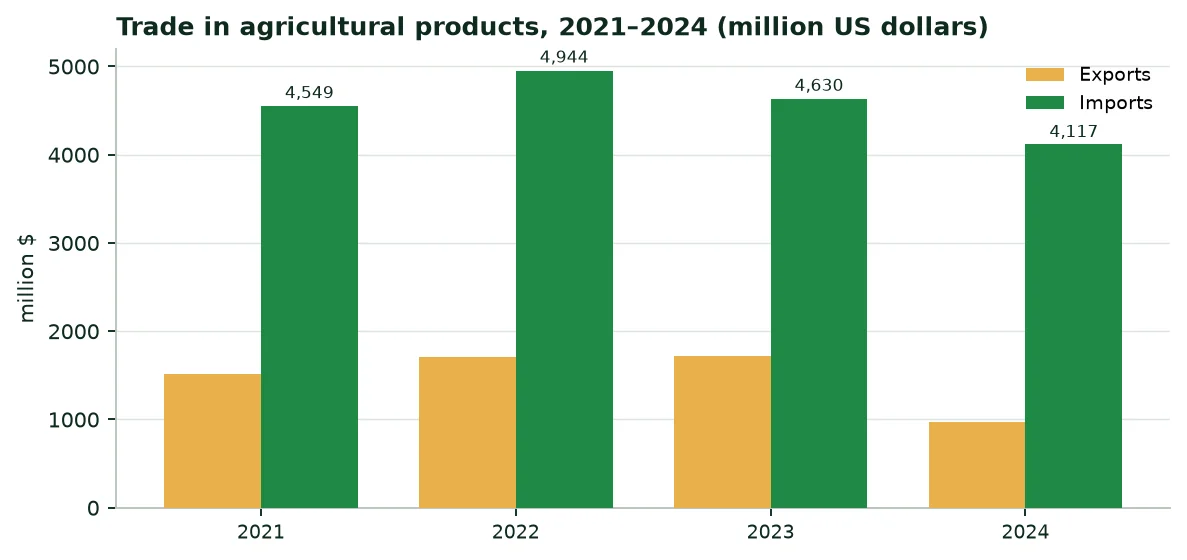
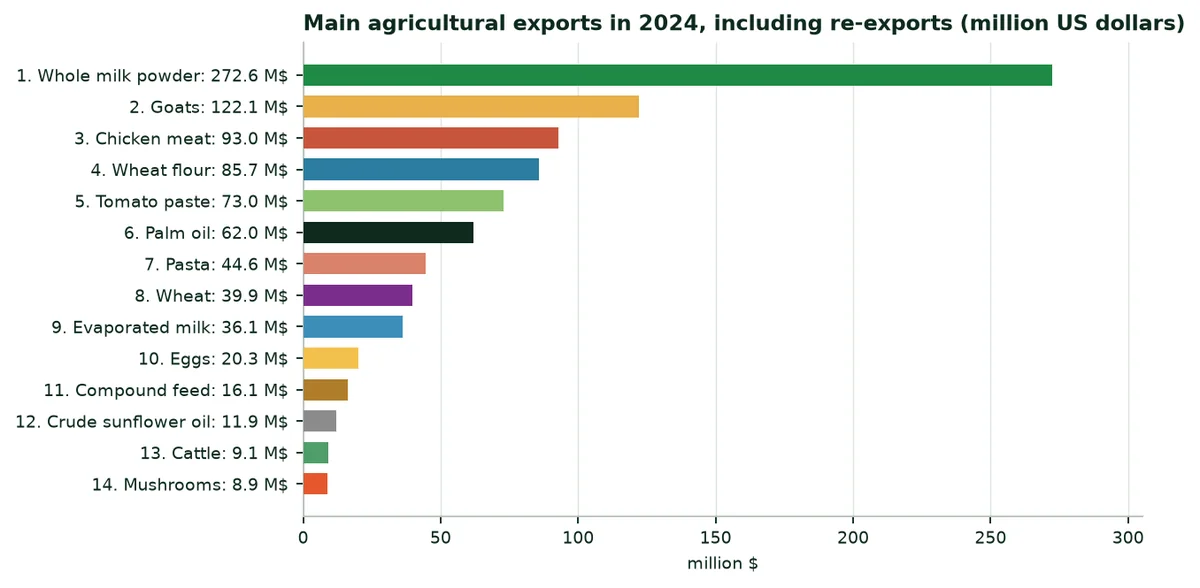
Oman imports about 4.2 times more agricultural products than it exports. Part of the exports are re-exports of processed goods (milk powder, flour, pasta, palm oil) through Omani ports.
10.2 Exports
10.3 Imports
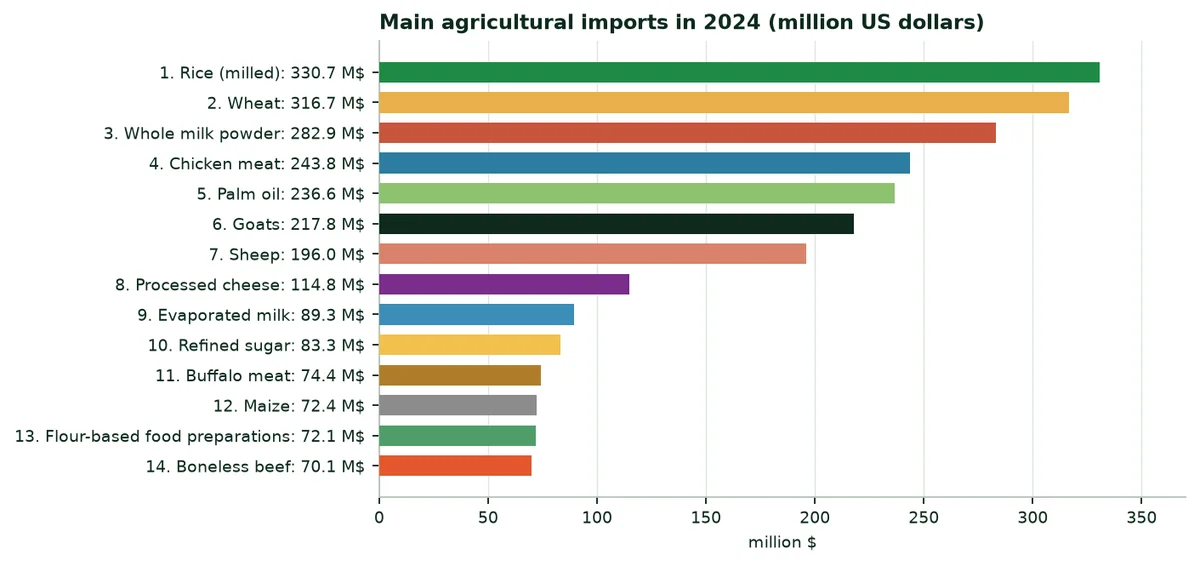
Imports of cereals and staple foods, 2024
Product | Volume 2023 (t) | Volume 2024 (t) | Value 2024 (M$) |
|---|---|---|---|
Wheat | 1,021,020 | 897,798 | 316.7 |
Rice (milled) | 176,366 | 324,761 | 330.7 |
Maize | 234,497 | 289,369 | 72.4 |
Barley | 98,541 | 115,607 | 33.3 |
Potatoes | 76,759 | 121,577 | 45.5 |
Dry onions | 66,371 | 44,435 | 23.3 |
Tomatoes | 47,895 | 59,391 | 29.6 |
Dates | 16,506 | 11,005 | 16.5 |
Source: FAOSTAT (A6).
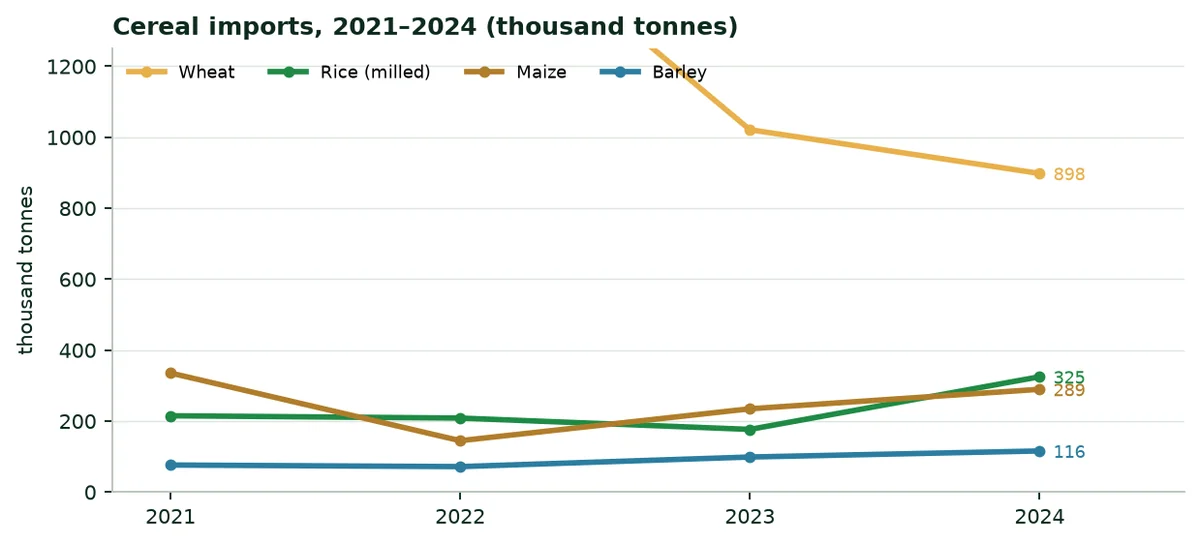
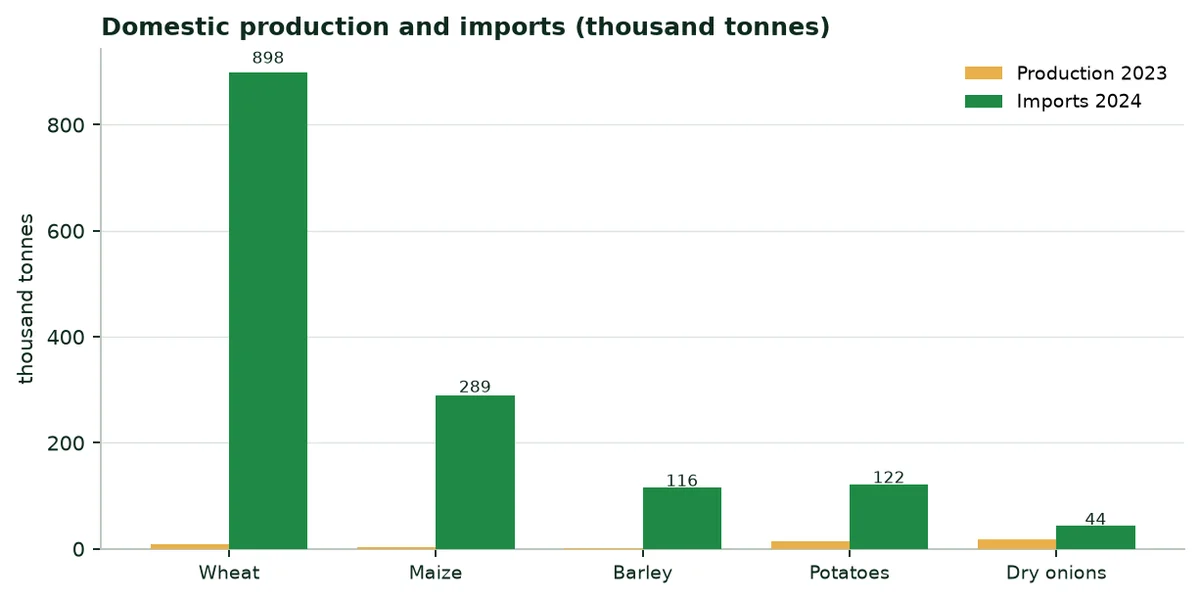
Wheat imports fell from 1,021 thousand tonnes in 2023 to 898 thousand in 2024, while rice imports rose to 325 thousand tonnes. Oman grows almost none of these cereals: Its food security in staples rests on imports, and its own water is best used for high-value crops that it grows well.
10.4 Water and imports
Imported wheat (898 thousand tonnes in 2024) is more than a hundred times domestic production. Oman also imports 122 thousand tonnes of potatoes and 59 thousand tonnes of tomatoes, crops that it grows but in insufficient quantity. Each cubic metre saved on existing farms can be used to grow more of these products locally.
10.5 Dates
Oman produced 377,066 t of dates in 2022 (NCSI). According to FAOSTAT, it exported 4,557 t and imported 11,005 t in 2024: Most of the harvest is consumed locally or used for processing and animal feed. Higher yields per tree with less water would serve both food security and export ambitions.
11. Limits and points to complete
Annex A. Sources and confidence levels
List of sources
Ref. | Source | Publisher or author | Year | Level | Link or reference |
|---|---|---|---|---|---|
A1 | World Development Indicators (WDI) | World Bank | 2022–2025 | A | api.worldbank.org |
A2 | Crop production (QCL) | FAO, FAOSTAT | 2023 | A | fao.org/faostat |
A3 | Value of agricultural production (QV) | FAO, FAOSTAT | 2023 | A | fao.org/faostat |
A4 | Land use (RL); FAO country profile | FAO | 1993–2024 | A | fao.org/faostat |
A5 | Fertilisers by nutrient (RFN) | FAO, FAOSTAT | 2010–2024 | A | fao.org/faostat |
A6 | Trade in agricultural products (TCL) | FAO, FAOSTAT | 2023–2024 | A | fao.org/faostat |
A7 | Cultivated area by crop group | NCSI, reported by Times of Oman | 2022 | A | timesofoman.com |
A8 | Date production by governorate | NCSI, reported by the Oman News Agency | 2022 | A | omanobserver.om |
A9 | Wheat season by governorate | Ministry of Agriculture, Fisheries and Water Resources | 2022–2023 | A | timesofoman.com |
A10 | Annual report 2023 (areas, palms, land, workers) | Ministry, reported by Oman Observer | 2023 | B | omanobserver.om |
A11 | PVGIS 5.2, monthly radiation | European Commission, JRC | 2005–2020 | A | re.jrc.ec.europa.eu/pvg_tools |
A12 | ERA5-Land reanalysis, daily rainfall and evapotranspiration | ECMWF, via Open-Meteo | 1991–2020 | B | open-meteo.com |
A13 | Commodity Price Data (Pink Sheet) | World Bank | 2019–2024 | A | worldbank.org/commodities |
A13b | Bulk supply tariff, Barka I | Nama Power and Water Procurement | 2009 | A | omanpwp.om |
A14 | Water balance 2013 and desalination cost | Ministry presentation | 2013 | B | Ministry document |
A15 | Rhodes grass, groundwater and seawater intrusion | Sultan Qaboos University (Zekri and others) | 2007–2014 | B | Scientific articles |
A16 | Seawater intrusion model, Wadi Al Jizi | Scientific article | 2022 | B | Scientific article |
A17 | Aflaj, dams and maintenance programmes | Oman Observer, Muscat Daily, Times of Oman | 2010–2025 | C | Press |
A18 | Reforming for resilience in Oman | Carnegie Endowment for International Peace | 2025 | B | carnegieendowment.org |
A19 | Administrative boundaries | Natural Earth (public domain) | Version 5 | A | naturalearthdata.com |
A20 | Date palms, Dubai | ICBA | 2020–2021 | B | Green Solutions website, trials |
A21 | Watermelons, Hermosillo (Mexico) | Green Solutions | 2023 | C | Green Solutions website, trials |
A22 | Maize, Konya (Turkey) | Green Solutions, D.I.S. and TIGEM | 2025 | C | Green Solutions website, trials |
A23 | Potatoes, Bloemfontein (South Africa) | Afrinest Farm Group | 2025–2026 | C | Green Solutions website, trials |
A24 | Soybean, Shandong (China) | Shandong Soil and Fertiliser Institute | Undated | B | Green Solutions website, trials |
A25 | ECOFERT® certificate | SOHISCERT | Current | A | Green Solutions website |
A26 | Claimed performance, doses and uses | Green Solutions | 2026 | C | Green Solutions website |
A27 | Calculations in this dossier | Author of the dossier | — | — | Annex B |
Annex B. Calculation method
Radiation. Sum of the 192 monthly values of horizontal radiation from PVGIS, divided by the number of years (16). Main town of each governorate.
Rainfall and evapotranspiration. Sum of the daily ERA5-Land values from 1991 to 2020 at the main town, divided by 30.
Feddans. One feddan = 0.42 ha. Check: 69,074 feddans of vegetables (NCSI 2022) × 0.42 = 29,011 ha; FAOSTAT gives 29,029 ha for 2023.
Agricultural water. Total withdrawals 2022 (1,634 million m³) × agricultural share (80.8%) = 1,320 million m³.
Water per hectare. Agricultural water ÷ cultivated area 2022 (115,882 ha) = 11,391 m³/ha.
Sharing water between crops. Share of each group in the cultivated area (NCSI 2022: Fodder, fruit, vegetables, field crops; dates from FAOSTAT 2023 within fruit) × agricultural water. The calculation assumes the same water per hectare for all crops.
Water saved. Water used by the group × water saving of the scenario.
Yield gain. Area of the group × FAOSTAT 2023 average yield (t/ha) × yield gain of the scenario.
Value created. Water saved × value of water (0.25, 0.50 or 1.00 $/m³) + yield gain × implicit price (FAOSTAT 2023 value at constant 2014–2016 prices ÷ production).
Scenarios. Cautious: 25 % of the trial effect. Central: 50 %. Strong: Published effect. Crops without a trial: 5, 10 and 20 % water saving, with no yield gain.
Fertiliser spending. Nitrogen ÷ 0.46 × urea price + phosphate ÷ 0.46 × TSP price + potash ÷ 0.60 × potassium chloride price, at World Bank international prices. It is a lower bound.
General limits. National averages; one coefficient per crop group; same water per hectare for all crops; no product cost is included in the calculations of this dossier.
Tell us about your farm
Crop, irrigation method, soil type, the volume of water you use today. We come back with the matching combination of technologies, the dosing, and the trials already run in comparable situations.
A first conversation commits you to nothing.
Tell us about your farmcontact@green-solutions-group.com · Green Solutions Groupe AIM SA, 46, route de la Condémine, 1475 Forel, Switzerland
Photo credits
- albinfo — CC BY-SA 4.0, « Jebel Akhdar – irrigation canals in Al-Ayn »
- Okhtyartist — CC BY-SA 4.0, « Date palm tree irrigation »
- Altaf Habib — CC BY-SA 4.0, « "The Falaj" - Traditional irrigation system 06 »
- Omar AV — CC BY 3.0, « Farm house, tareef - panoramio »
- Prof. Mortel — CC BY 2.0, « Palm grove at Nakhl, Oman (1) »
Photographs from Wikimedia Commons, reused under their stated licences.