MARKET DOSSIER
Ethiopia
FEDERAL DEMOCRATIC REPUBLIC OF ETHIOPIA
A rain-fed granary of 135 million people, where irrigation grows plot by plot.
What hydro-retention changes when the rains come late or stop early.
Foreword
This dossier describes Ethiopia from the angle of irrigation water, climate, fertilisers and crops. It is written for the ministries in charge of agriculture and water, the regional bureaus of agriculture and farmers' cooperatives. It answers three questions: Where is water used, for which crops, and in which regions? It then examines what our products can change, and what that can be worth.
Reading the sources. Every figure refers to a source, named in the text and detailed in Annex A. Each source carries a confidence level:
Summary
The points below summarise the dossier. The key figures come from public sources: The Ethiopian Statistics Service (ESS), FAO, the World Bank, PVGIS and ERA5. The water savings are scenarios, described in Annex B.
135.5 M Inhabitants in 2025 (World Bank); 60% of jobs are in agriculture. | 9.7 km³ Of water withdrawn each year for agriculture, 92% of all withdrawals. | 858,000 ha Equipped for irrigation (FAOSTAT, 2023), for an estimated potential of 5.3 million hectares. |
1.46 km³ Of water saved per year in the central scenario, 15% of agricultural water. | 129,000 ha More could be irrigated with the water saved, for the same volume. | 547,000 t Of mineral nitrogen used in 2023 (FAOSTAT), almost all imported. Spending: At least $630 M. |
Key figures
Key indicators for Ethiopia
Indicator | Value | Year | Source (level) |
|---|---|---|---|
Population | 135.5 million | 2025 | World Bank (A1, A) |
Agriculture share of GDP | 32.8% | 2025 | (A1, A) |
Water withdrawals for agriculture | 9.69 km³ | 2022 | (A1, A) |
Area equipped for irrigation | 858,160 ha | 2023 | FAOSTAT (A2, A) |
Smallholder irrigated area | 165,111 ha | 2021/22 | ESS (A4, A) |
Grain harvested (smallholders) | 32.8 million t | 2021/22 | ESS (A3, A) |
Mineral nitrogen used | 547,262 t | 2023 | FAOSTAT (A2, A) |
Solar radiation (regional capitals) | 1,862 to 2,361 kWh/m²/yr | 2005-2020 | PVGIS (A7, A) |
Potential water saving (central) | 1.46 km³ | Scenario | Calculation (Annex B) |
Source: See the "Source" column; levels explained in the foreword.
1. Green Solutions and our products
Green Solutions develops products for water, fertilisation and crop protection. Four families concern this dossier. The performance figures cited are those published by the manufacturer or by the trials, with their confidence level.
Products covered by this dossier
Product | Claimed use | Published evidence | Level |
|---|---|---|---|
EVERGREEN® (water retainer) | Holds rain or irrigation water as a gel, close to the roots | Trials on maize, potato, watermelon, date palm and soybean (sections 8 and 9) | B to C |
ECOSORB® (water retainer based on maize starch) | Same use; effect lasts 2 to 3 years according to the website | Soybean trial (China); laboratory acrylamide analysis | B to C |
ECOFERT® (fertiliser) | Fertiliser certified by SOHISCERT and EU Organic | Published certificate; potato trial combined with EVERGREEN | A (certificate), C (results) |
Paulownia ALTIFOLIA® | Fast-growing tree for agroforestry | Website figures; no trial in Ethiopia | C |
Water Vital®, NAPEMA® | Outside the scope of this dossier | No independent source in the documents consulted | — |
Source: Green Solutions website (product sheets and published trials), Annex A, sources A20 to A25.
The indicative dose published on the website is 30 to 75 kg/ha. In Ethiopia, the products concern three situations first: Irrigated schemes (onion, potato, tomato, maize, banana), rain-fed crops exposed to late or interrupted rains, and tree planting.
2. Ethiopia in figures
Ethiopia is Africa's second country by population: 135.5 million people in 2025 according to the World Bank. The Ethiopian Statistics Service projects 109.4 million people in July 2024, on a different basis; the two sources are quoted without being mixed. 76% of the people live in rural areas.
Agriculture provides 32.8% of GDP and 60.1% of jobs. GDP per person is 933 dollars (2025). Undernourishment still affects 19.9% of the population (2024, FAO via the World Bank).
Economic and agricultural indicators
Indicator | Value | Year |
|---|---|---|
Population (World Bank) | 135,472,051 | 2025 |
Population growth | 2.55% | 2025 |
GDP (current dollars) | $126.4 bn | 2025 |
GDP per person | 933 $ | 2025 |
Agriculture, share of GDP | 32.8% | 2025 |
Agricultural employment, share of jobs | 60.1% | 2025 |
Fertiliser per hectare of arable land | 45.4 kg | 2024 |
Cereal yield | 2,632 kg/ha | 2024 |
Internal renewable water resources | 122 km³ (973 m³/person) | 2022 |
Undernourishment | 19.9% | 2024 |
Source: World Bank, World Development Indicators (A1).
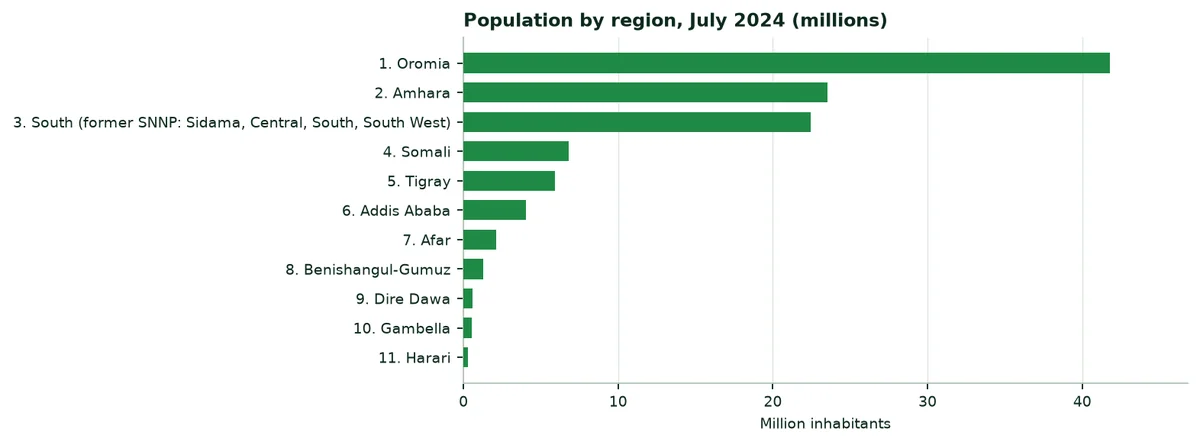
Population by region, July 2024 (ESS projection)
Region | Inhabitants | Share of the country |
|---|---|---|
Oromia | 41,790,000 | 38.2% |
Amhara | 23,549,000 | 21.5% |
South (former SNNP: Sidama, Central, South, South West) | 22,444,000 | 20.5% |
Somali | 6,808,000 | 6.2% |
Tigray | 5,936,000 | 5.4% |
Addis Ababa | 4,030,000 | 3.7% |
Afar | 2,120,000 | 1.9% |
Benishangul-Gumuz | 1,283,000 | 1.2% |
Dire Dawa | 566,000 | 0.5% |
Gambella | 540,000 | 0.5% |
Harari | 289,000 | 0.3% |
Ethiopia | 109,355,000 | 100% |
Source: ESS, projection at 1 July 2024 (A6). Special enumeration areas are not included.
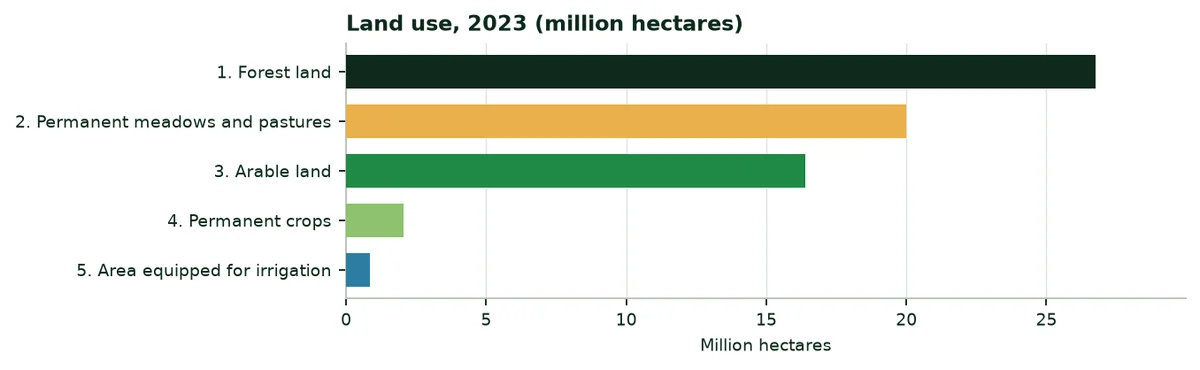
The territory covers 112.2 million hectares. Arable land occupies 16.4 million, permanent crops (coffee, khat, enset, fruit) 2.06 million and permanent meadows and pastures 20 million. Forests cover 26.8 million hectares (FAOSTAT, 2023).
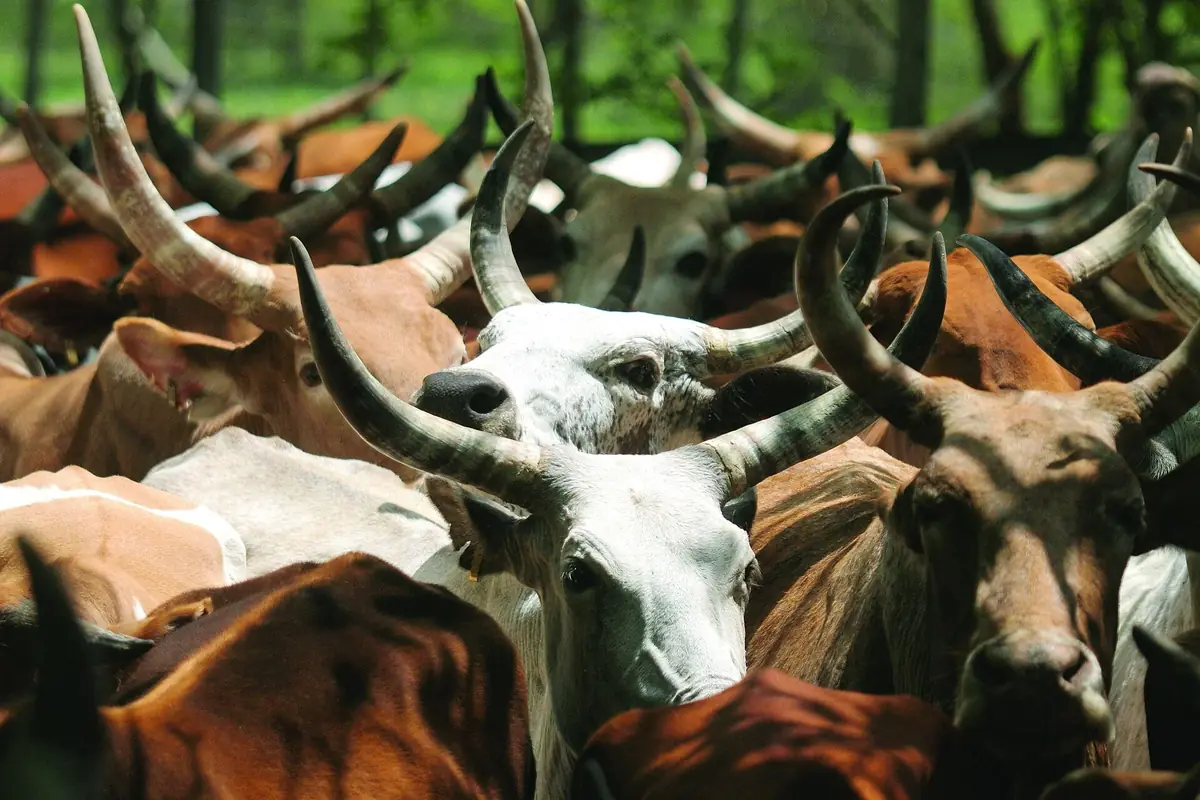
Livestock is the second pillar of agriculture. FAOSTAT counts in 2024 71.9 million cattle, 41.1 million sheep, 54.0 million goats and 1.66 million camels. The lowlands of Afar, Somali and southern Oromia live mainly from pastoralism.
3. Sunshine, rainfall and climate change
3.1 Sunshine
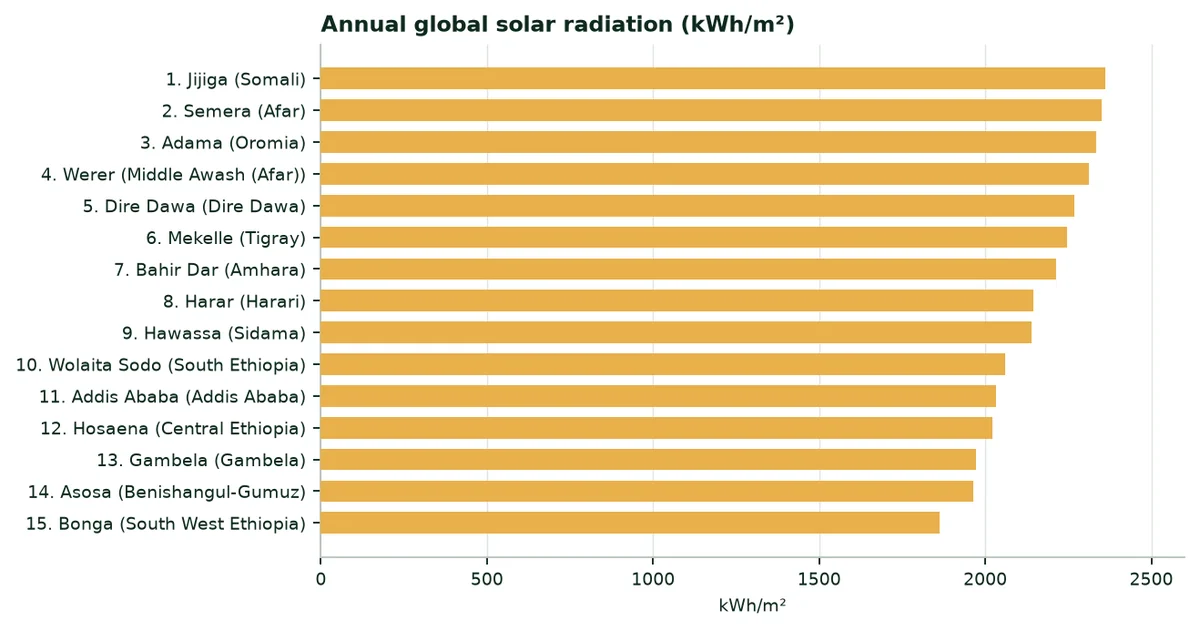
Global solar radiation ranges from 1,862 kWh/m² a year at Bonga, in the humid and cloudy South West, to 2,361 kWh/m² at Jijiga (PVGIS, 2005-2020 mean). It is a high level everywhere, comparable to southern Spain: Light does not limit crops, water does.
3.2 Rainfall
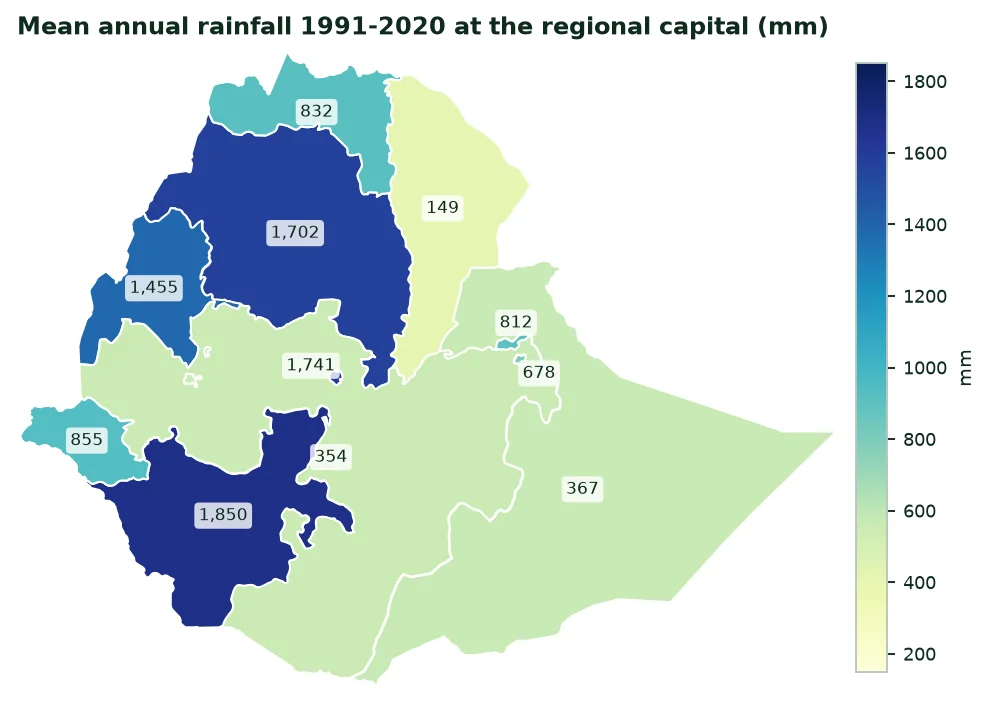
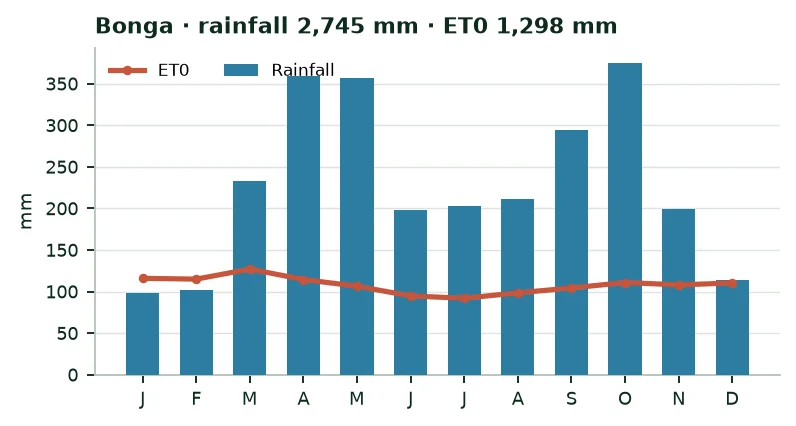
Altitude shapes the climate. The highlands, above 1,500 m, receive most of the rain: 1,702 mm a year at Bahir Dar, 1,741 mm at Addis Ababa, 2,745 mm at Bonga. The eastern lowlands are arid: 149 mm at Semera, 473 mm at Werer in the Awash valley. These values are those of the ERA5 model for the grid cell of each capital; they can differ from station records.
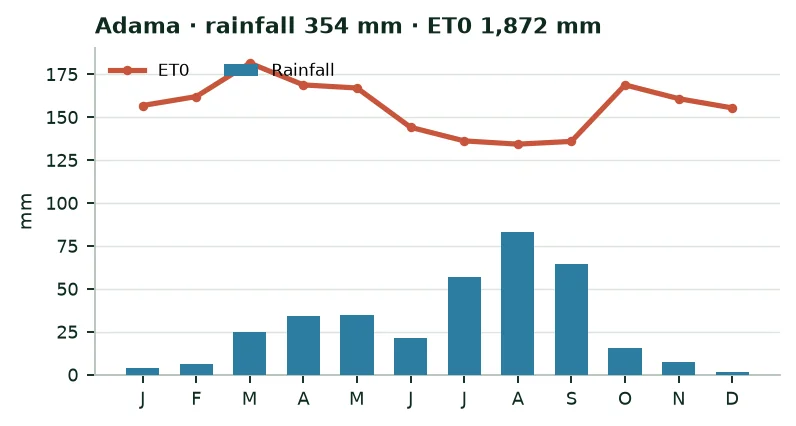
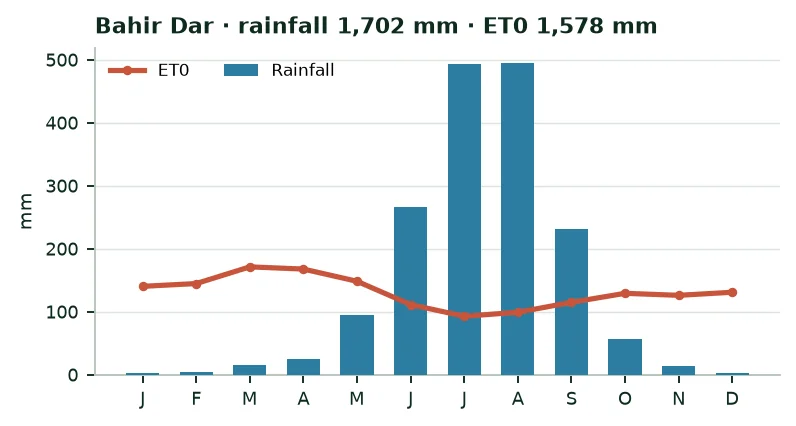
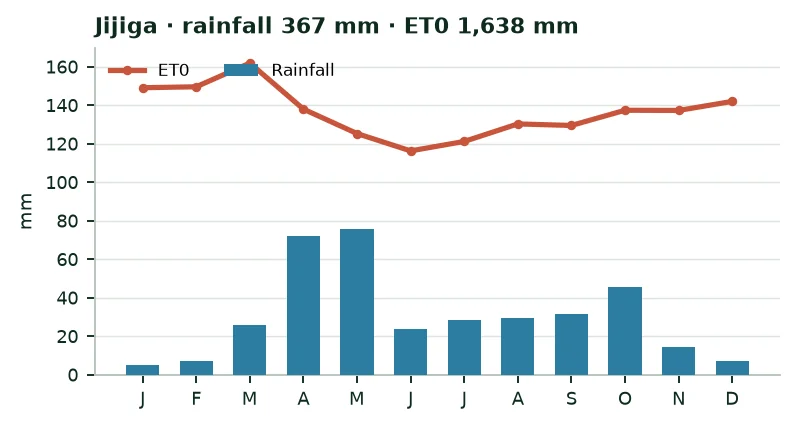
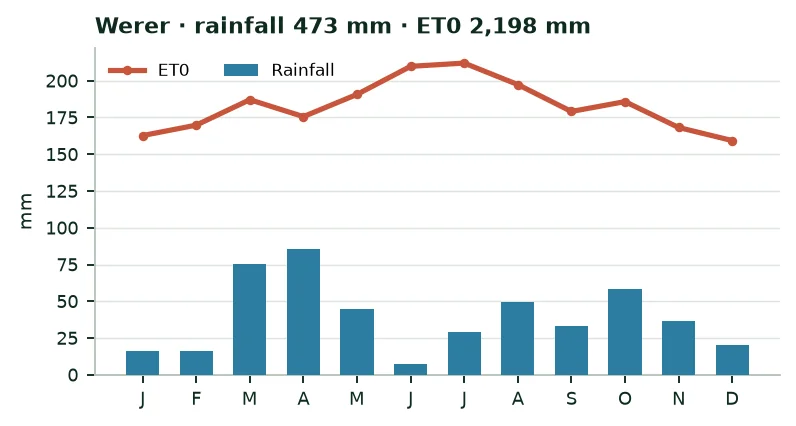
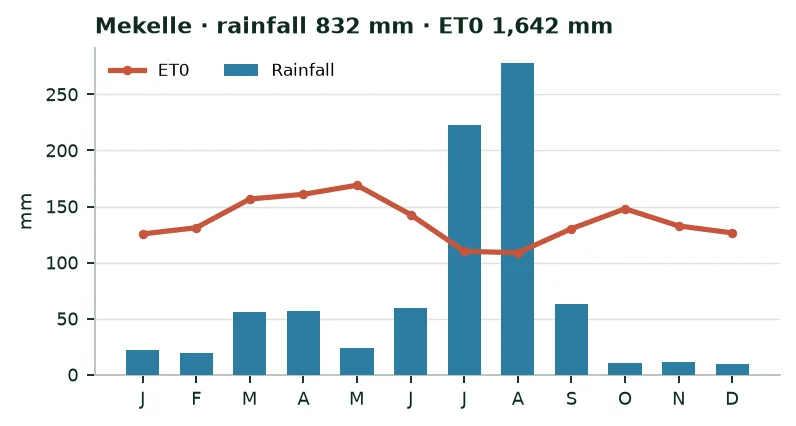
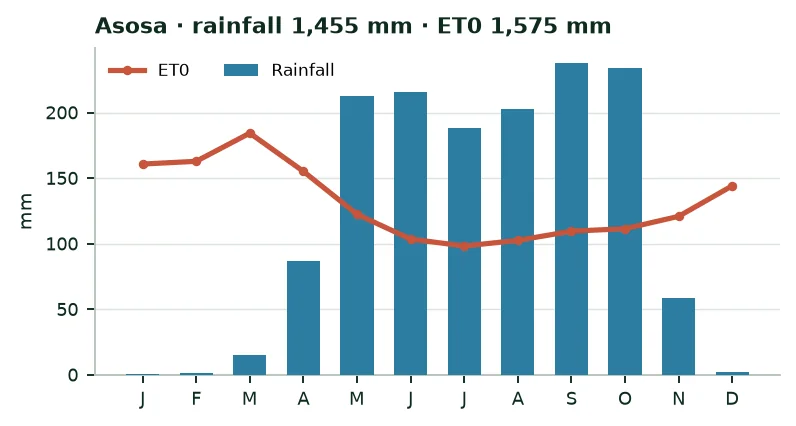
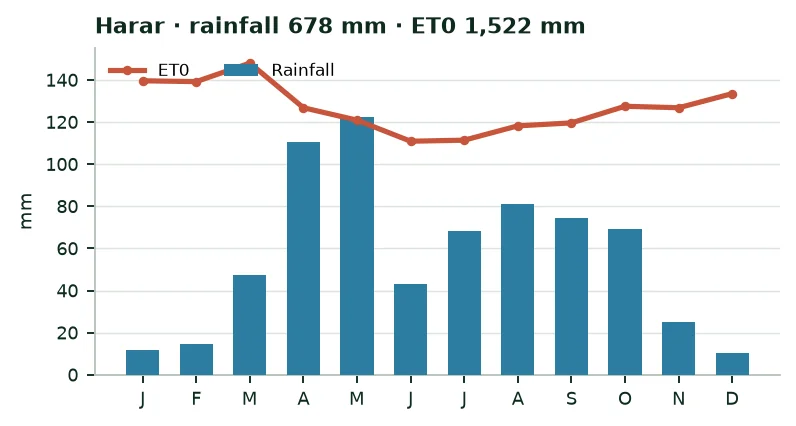
The calendar matters as much as the total. In the centre and north, the long rains (kiremt) last from June to September and carry the main harvest, called Meher. A short season (belg) falls from February to May in the east and south. In the south-east, two short seasons (gu and deyr) frame long dry periods. Figure 4 shows the gap between rainfall and reference evapotranspiration (ET0), month by month.
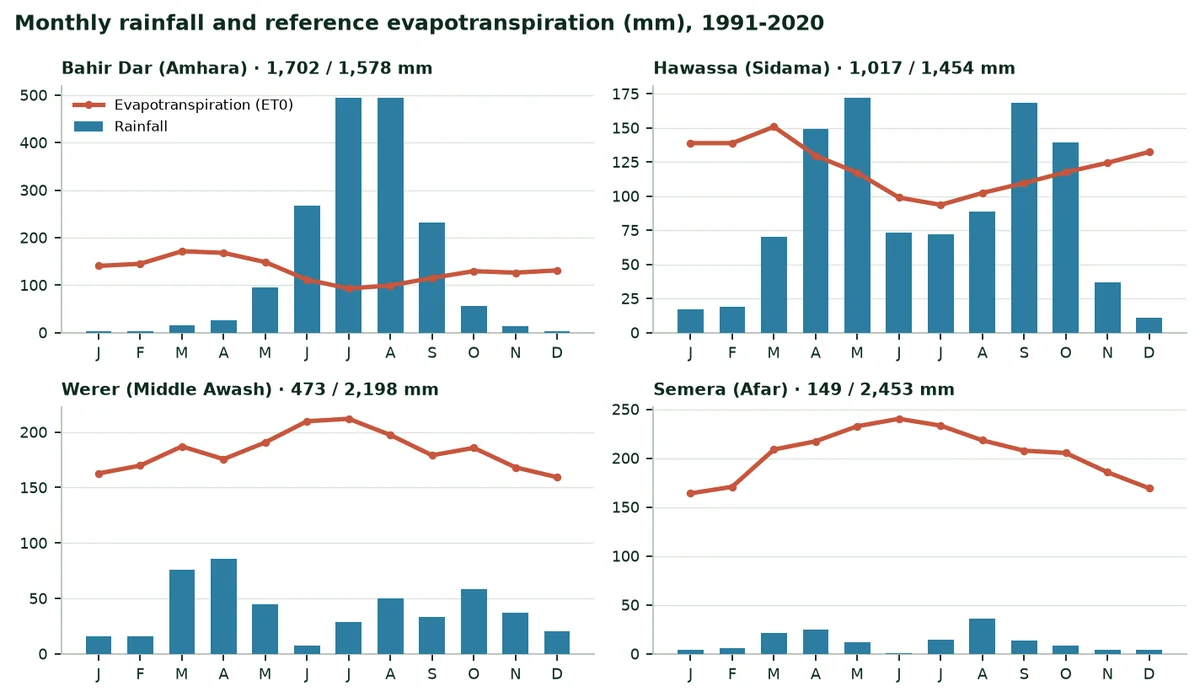
At Werer (Middle Awash), reference evapotranspiration reaches 2,198 mm a year for 473 mm of rain: No crop is possible there without irrigation. At Bahir Dar, rain exceeds needs from June to September, but the dry season lasts from November to April.
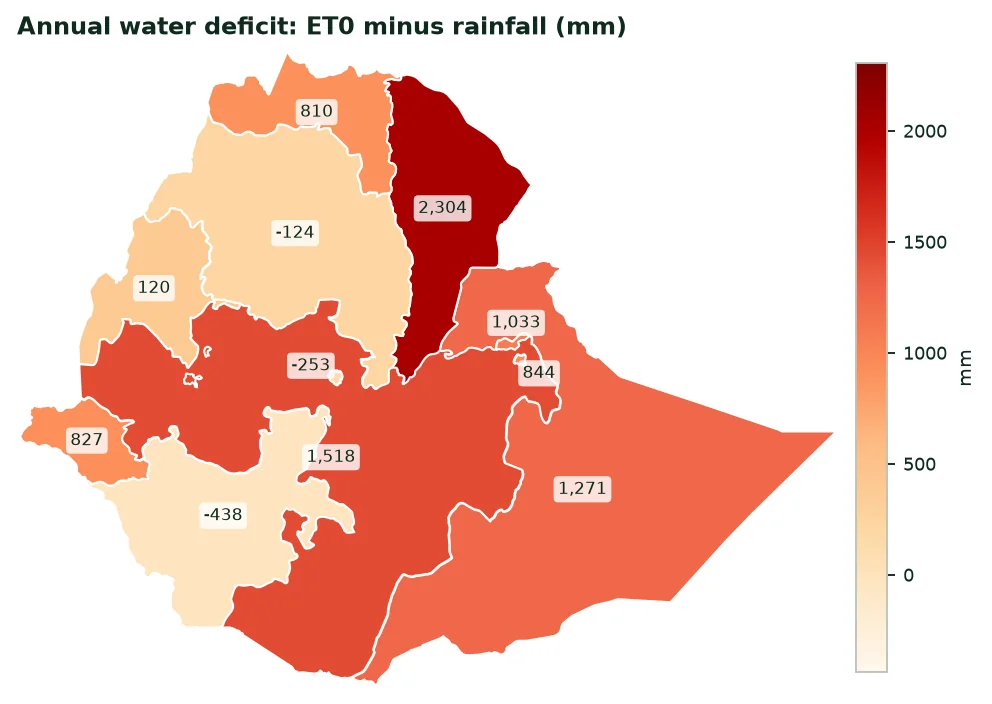
Climate of the regional capitals, 1991-2020 means
Region | Station | Altitude (m) | Rain (mm) | ET0 (mm) | Deficit (mm) | Temp. (°C) | Sun (kWh/m²) |
|---|---|---|---|---|---|---|---|
Afar | Semera | 431 | 149 | 2,453 | 2,304 | 30.3 | 2,350 |
Oromia | Adama | 1,619 | 354 | 1,872 | 1,518 | 20.4 | 2,334 |
Somali | Jijiga | 1,648 | 367 | 1,638 | 1,271 | 19.5 | 2,361 |
Middle Awash (Afar) | Werer | 734 | 473 | 2,198 | 1,725 | 28.0 | 2,313 |
Harari | Harar | 1,908 | 678 | 1,522 | 844 | 18.5 | 2,144 |
Dire Dawa | Dire Dawa | 1,193 | 812 | 1,845 | 1,033 | 23.6 | 2,269 |
Tigray | Mekelle | 2,063 | 832 | 1,642 | 810 | 18.1 | 2,246 |
Gambela | Gambela | 435 | 855 | 1,682 | 827 | 28.1 | 1,972 |
Sidama | Hawassa | 1,690 | 1,017 | 1,454 | 437 | 19.2 | 2,140 |
Benishangul-Gumuz | Asosa | 1,516 | 1,455 | 1,575 | 120 | 21.5 | 1,965 |
South | Wolaita Sodo | 2,032 | 1,580 | 1,478 | -102 | 17.8 | 2,059 |
Amhara | Bahir Dar | 1,795 | 1,702 | 1,578 | -124 | 20.1 | 2,214 |
Addis Ababa | Addis Ababa | 2,444 | 1,741 | 1,488 | -253 | 15.3 | 2,032 |
Central | Hosaena | 2,348 | 2,058 | 1,419 | -639 | 15.7 | 2,023 |
South West | Bonga | 1,593 | 2,745 | 1,298 | -1,447 | 18.5 | 1,862 |
Source: ERA5 via Open-Meteo (A8); PVGIS (A7). Altitude of the model grid cell. A negative deficit means rainfall exceeds ET0 over the year.
3.3 Climate change
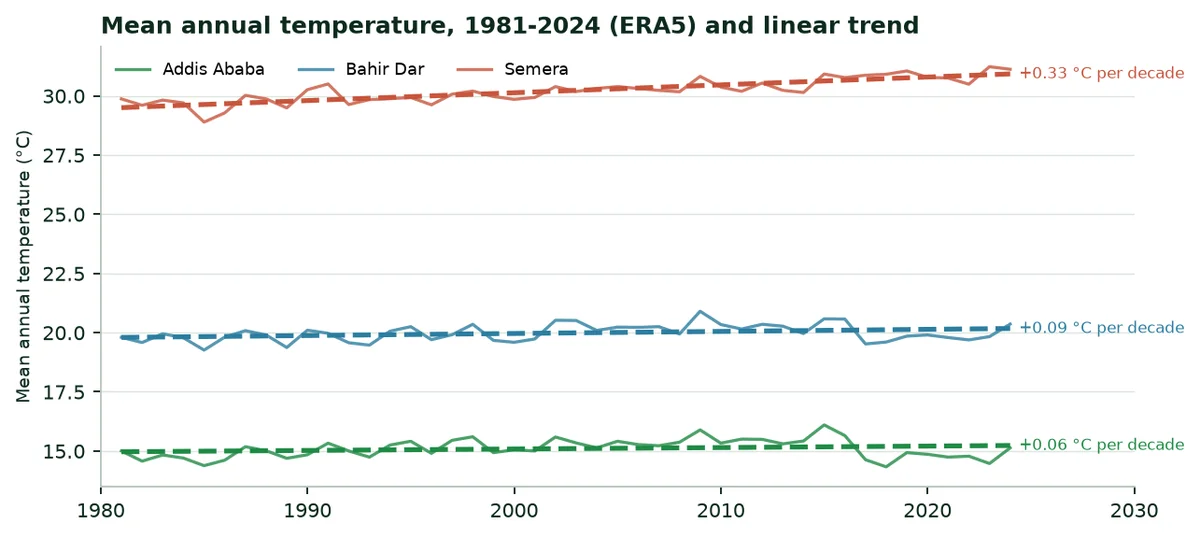
The ERA5 series from 1981 to 2024 shows clear warming in the lowlands: At Semera, the mean annual temperature rose from 29.7 °C (1981-1990) to 30.9 °C (2015-2024), 0.33 °C per decade. In the highlands, the rise is smaller in the same series: 0.09 °C per decade at Bahir Dar and 0.06 °C at Addis Ababa.
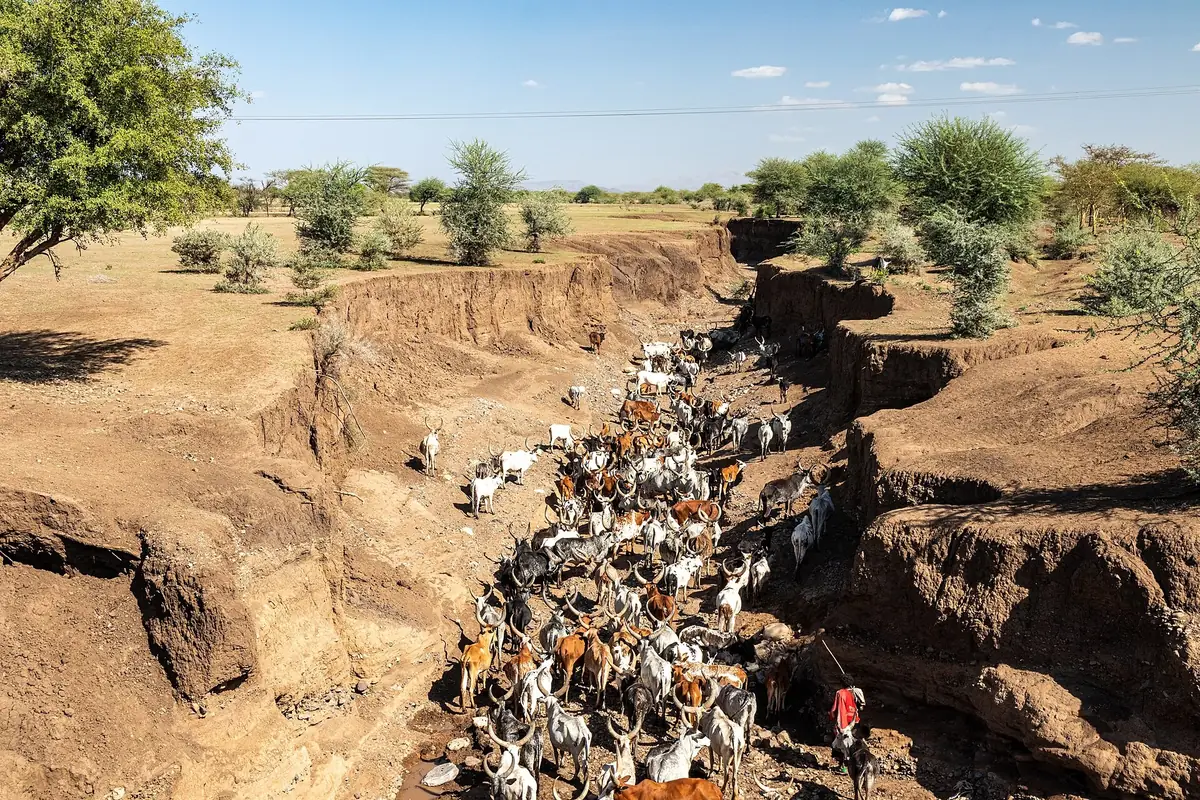
Droughts recur. From late 2020 to early 2023, five consecutive rainy seasons failed in the Horn of Africa. In Ethiopia, the UN Office for the Coordination of Humanitarian Affairs (OCHA) counted in March 2023 about 6.85 million dead livestock and about 11 million food-insecure people, mainly in Somali and southern Oromia (A10).
4. Irrigation water: Resources, areas, potential
4.1 Resources and withdrawals
Internal renewable water resources reach 122 km³ a year, 973 m³ per person (World Bank, 2022): Already below the threshold of 1,000 m³ per person often used to define scarcity. Withdrawals total 10.55 km³ a year, of which 91.8% for agriculture, 9.69 km³. Water stress, the ratio of withdrawals to available resources, is 32%.
The country is a regional water tower: The Blue Nile (Abbay) rises at Lake Tana, the Awash flows towards the Afar depression, the Shebelle and the Genale-Dawa run down to Somalia, the Omo to Lake Turkana. The Grand Ethiopian Renaissance Dam (GERD), on the Blue Nile, was inaugurated on 9 September 2025; it is designed for electricity (about 5,150 MW) with a reservoir of about 74 billion m³ (A11).
4.2 Irrigated areas today
FAOSTAT counts 858,160 ha equipped for irrigation in 2023. The Ethiopian Statistics Service measures, for the main season 2021/22 alone, 165,111 ha irrigated by 1,228,082 smallholders, an average of 1,344 m² per farmer (A4). This survey covers neither commercial farms, nor dry-season irrigated wheat, nor the short (belg) season.
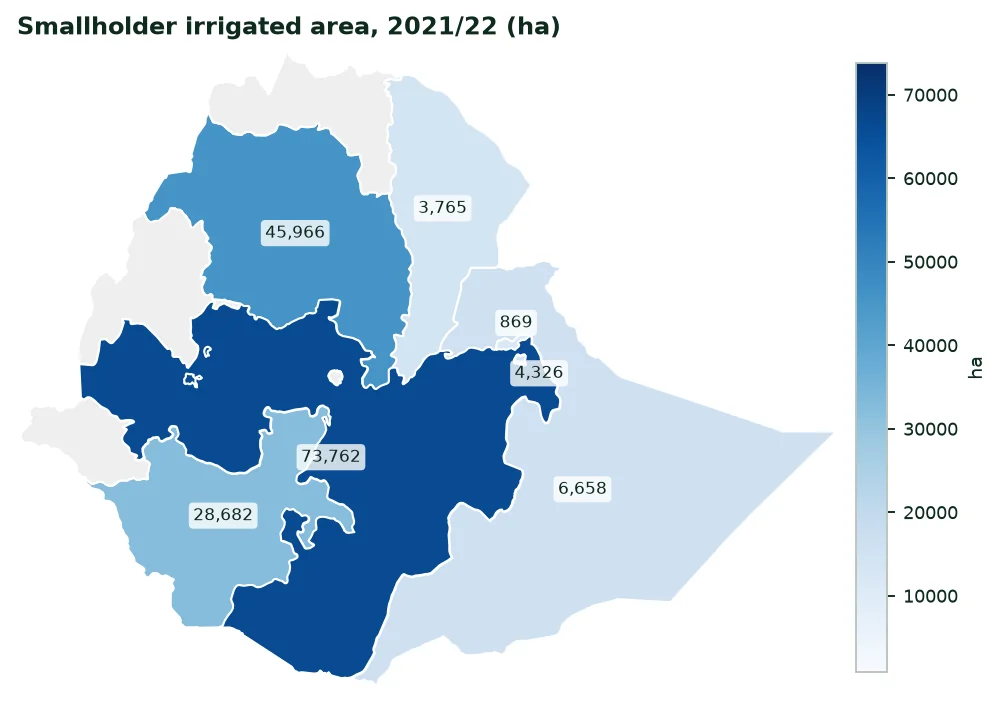
Smallholder irrigation by region, main season 2021/22
Region | Farmers who irrigate | Irrigated area (ha) | Share of total |
|---|---|---|---|
Oromia | 401,366 | 73,762 | 44.7% |
Amhara | 666,123 | 45,966 | 27.8% |
South (former SNNP, with Sidama) | 90,583 | 28,682 | 17.4% |
Somali | 15,482 | 6,658 | 4.0% |
Harari | 13,749 | 4,326 | 2.6% |
Afar | 4,860 | 3,765 | 2.3% |
Dire Dawa | 9,671 | 869 | 0.5% |
Benishangul-Gumuz | 2,619 | Not published | — |
Gambella | — | Not published | — |
Ethiopia | 1,228,082 | 165,111 | 100% |
Source: ESS, Agricultural Sample Survey 2021/22, Farm Management Practices, table 5 (A4). "Not published": Estimate judged too imprecise by ESS. Tigray not surveyed.
Rivers supply 80% of smallholder irrigation water, wells and groundwater 12%, ponds, small dams and rainwater harvesting the rest. Irrigated crops are not those of rain-fed fields: Maize, khat, onion, banana, coffee, garlic and tomato come first.
Source of smallholder irrigation water, main season 2021/22
Source | Irrigated area (ha) | Share |
|---|---|---|
River | 131,379 | 79.6% |
Well and groundwater | 20,582 | 12.5% |
Pond | 4,879 | 3.0% |
Rainwater harvesting | 2,065 | 1.3% |
Dam | 1,617 | 1.0% |
Other | 4,075 | 2.5% |
Total | 165,111 | 100% |
Source: ESS, Farm Management Practices 2021/22, table 6 (A4). Lakes (not published) are included in the total.
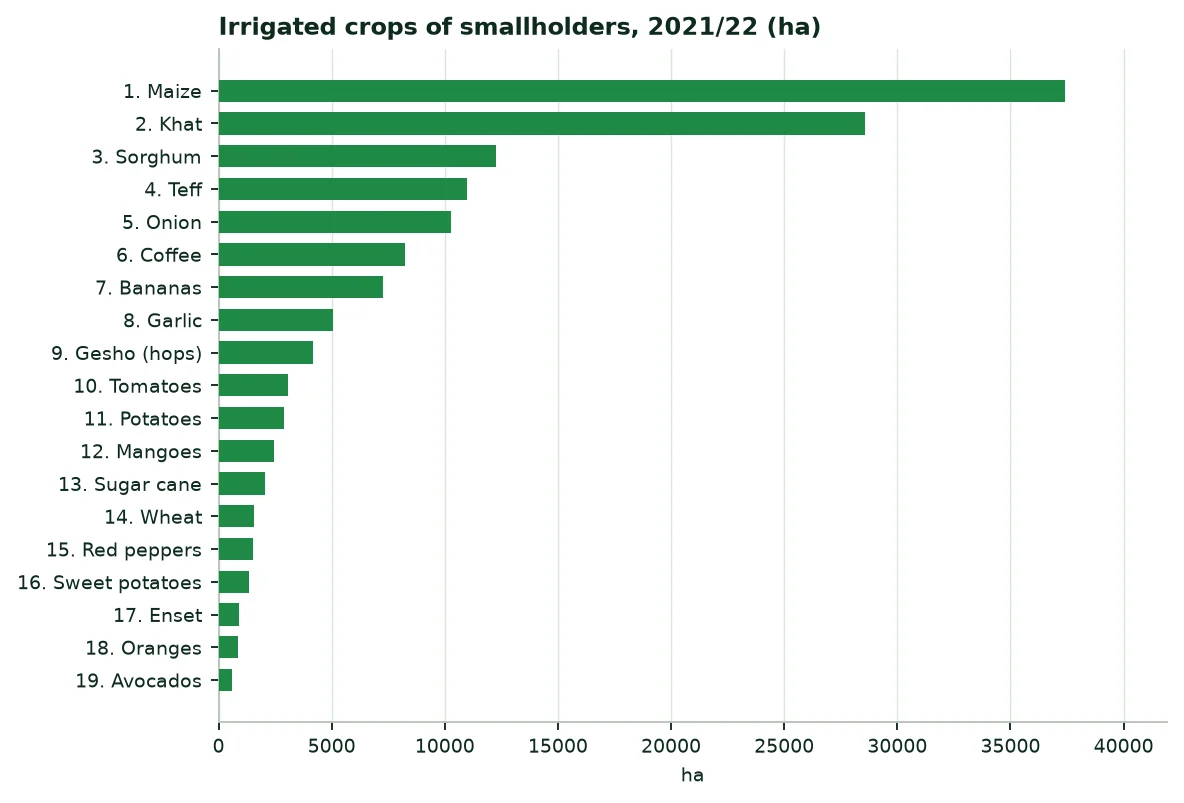
The fifteen zones where smallholders irrigate most, main season 2021/22
Rank | Zone | Region | Irrigated area (ha) | Share of the country |
|---|---|---|---|---|
1 | East Hararghe | Oromia | 25,888 | 15.7% |
2 | Gamo | South | 18,566 | 11.2% |
3 | West Gojjam | Amhara | 10,185 | 6.2% |
4 | West Hararghe | Oromia | 9,903 | 6.0% |
5 | East Gojjam | Amhara | 5,733 | 3.5% |
6 | North Wollo | Amhara | 5,377 | 3.3% |
7 | Shabelle | Somali | 5,345 | 3.2% |
8 | Harari | Harari | 4,326 | 2.6% |
9 | Bale | Oromia | 3,467 | 2.1% |
10 | Oromo special zone | Amhara | 3,171 | 1.9% |
11 | Awi | Amhara | 3,167 | 1.9% |
12 | North Shewa | Amhara | 2,745 | 1.7% |
13 | Central Gondar | Amhara | 1,995 | 1.2% |
14 | Jimma | Oromia | 1,957 | 1.2% |
15 | South West Shewa | Oromia | 1,709 | 1.0% |
Source: ESS, Farm Management Practices 2021/22, table 5 (A4). Only zones with a published estimate appear here.
The two Hararghe zones, in eastern Oromia, alone irrigate more than a fifth of smallholder areas, mostly for khat and vegetables. Gamo zone, around Arba Minch, irrigates banana groves and orchards.
4.3 Potential and programmes
The International Water Management Institute (IWMI) estimates the irrigable area from rivers, groundwater and rainwater harvesting at 5.3 million hectares, of which 3.7 million from surface water (A9). The 858,160 ha equipped represent 16% of it.
Since 2019, the government has developed dry-season irrigated wheat in the lowlands (Awash, Shebelle, Omo). The Ministry of Agriculture reports a rise from 20,000 ha in 2020 to 3.5 million hectares in 2025 (A12). These areas do not yet appear in ESS surveys, and the estimates of the US agriculture department (USDA) differ (A13). The dossier quotes the official figure without using it in the calculation.
Dividing agricultural water (9.69 km³) by the equipped area gives an average of 11,288 m³ per irrigated hectare per year. It is the order of magnitude of the hot lowlands, where sugar cane, cotton and orchards need a lot of water.
5. Fertilisers: Quantities, purchases, prices, spending
5.1 Quantities used
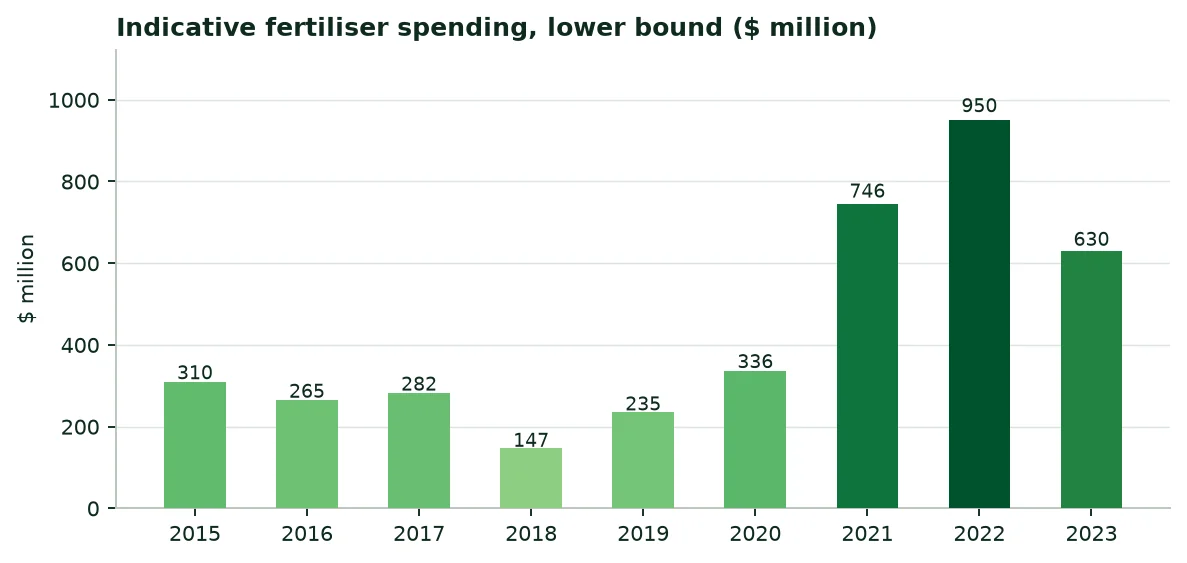
Mineral nitrogen use rose from 80,503 t in 2005 to 547,262 t in 2023, and phosphate (P₂O₅) reaches 194,069 t. Potash remains almost absent (1,952 t of K₂O). Per hectare of arable land, the average input is 45.4 kg (World Bank, 2024), still below the 50 kg target set by the Abuja Declaration on fertilisers (2006).
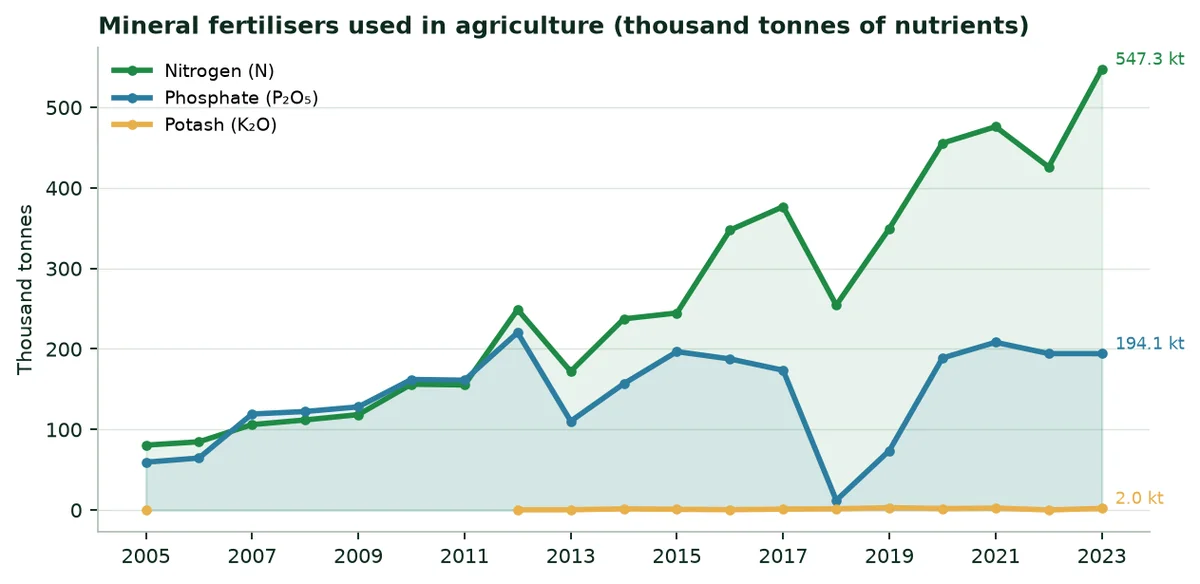
Mineral fertilisers: Agricultural use and imports (tonnes of nutrients)
Year | Nitrogen used | Phosphate used | Potash used | Nitrogen imported | Phosphate imported | Minimum spending ($M) |
|---|---|---|---|---|---|---|
2015 | 244,613 | 196,584 | 759 | 138,650 | 33,137 | 310 |
2016 | 347,560 | 187,525 | 323 | 154,834 | 62,971 | 265 |
2017 | 376,625 | 173,486 | 1,057 | 127,491 | 23,849 | 282 |
2018 | 254,253 | 11,937 | 1,469 | 254,253 | 11,937 | 147 |
2019 | 349,522 | 73,692 | 2,806 | 349,522 | 73,692 | 235 |
2020 | 455,512 | 188,702 | 1,728 | 455,512 | 188,702 | 336 |
2021 | 475,877 | 208,199 | 2,296 | 475,877 | 208,199 | 746 |
2022 | 425,893 | 194,170 | 0 | 425,905 | 194,185 | 950 |
2023 | 547,262 | 194,069 | 1,952 | 547,262 | 194,069 | 630 |
Source: FAOSTAT (A2); World Bank prices (A16); calculation (Annex B).
The ESS survey details use by smallholders in the 2021/22 main season: 2.06 million tonnes of chemical fertiliser on 9.6 million hectares. The NPS and urea combination dominates (785,206 t), ahead of blended fertilisers used with urea (887,965 t). Teff, maize and wheat receive most of it (A4).
5.2 Purchasing and supply
The State buys fertilisers by tender, through the Ethiopian Agricultural Businesses Corporation (EABC), then distributes them through unions and cooperatives. For the 2025/26 season, the announced target was about 24 million quintals, 2.4 million tonnes; by March 2025, 797,463 t had already been unloaded from 15 ships at the port of Djibouti (A14). Almost all the volume goes through this port, then by road and by the Djibouti-Addis Ababa railway.
In August 2025, Ethiopian Investment Holdings and the Dangote group signed an agreement for a urea plant at Gode (Somali region), with an announced capacity of 3 million tonnes a year, supplied with gas from the Calub and Hilala fields; the investment is estimated at 2.5 billion dollars (A15).
5.3 Prices and spending
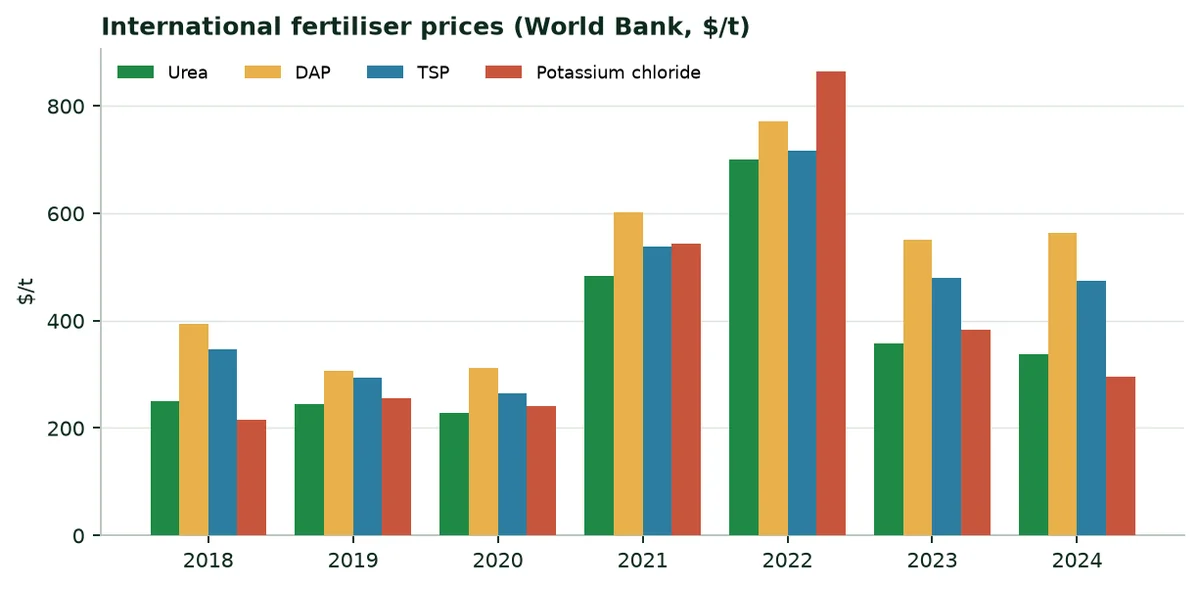
International prices doubled in 2021-2022 before falling back: Urea cost 700 $ a tonne in 2022 and 338 $ in 2024. Converting nutrients into urea, TSP and potassium chloride at international prices, the country's minimum spending reached $950 M in 2022 and $630 M in 2023. Prices paid delivered to Ethiopia are higher.
6. The regions at a glance
The table brings together, for each region, the population, the rainfall and evapotranspiration at the capital, grain production and the smallholder irrigated area. Regions follow the breakdown of ESS publications; the four regions formed from the former SNNP are grouped.
The regions in figures
Region | Population 2024 (M) | Rain / ET0 (mm) | Grain 2021/22 (thousand t) | Irrigated 2021/22 (ha) |
|---|---|---|---|---|
Oromia | 41.79 | 354 / 1,872 | 17,554 | 73,762 |
Amhara | 23.55 | 1,702 / 1,578 | 11,253 | 45,966 |
South (former SNNP) | 22.44 | 1,017 / 1,454 | 3,182 | 28,682 |
Somali | 6.81 | 367 / 1,638 | 25 | 6,658 |
Tigray | 5.94 | 832 / 1,642 | — | — |
Afar | 2.12 | 149 / 2,453 | 5 | 3,765 |
Benishangul-Gumuz | 1.28 | 1,455 / 1,575 | 710 | — |
Gambella | 0.54 | 855 / 1,682 | 29 | — |
Harari | 0.29 | 678 / 1,522 | 22 | 4,326 |
Dire Dawa | 0.57 | 812 / 1,845 | 11 | 869 |
Addis Ababa | 4.03 | 1,741 / 1,488 | — | — |
Source: ESS (A3, A4, A6); ERA5 (A8). South: Rainfall and ET0 of Hawassa. "—": Not surveyed or not published.
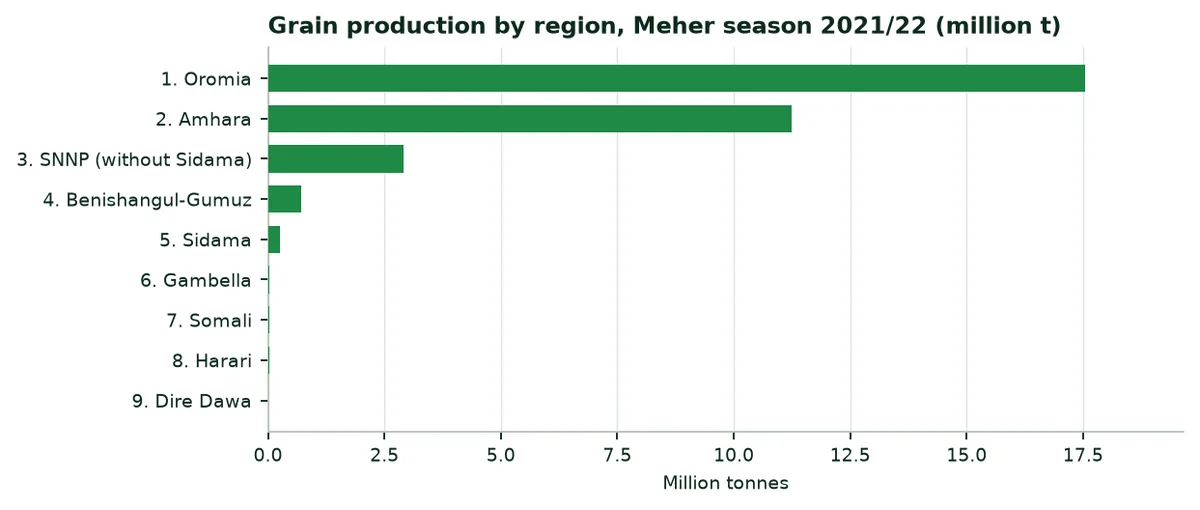
Production of the five main cereals by region, Meher 2021/22 (thousand tonnes)
Region | Teff | Maize | Wheat | Sorghum | Barley |
|---|---|---|---|---|---|
Oromia | 2,997 | 6,191 | 3,467 | 1,665 | 1,240 |
Amhara | 2,254 | 2,642 | 1,922 | 1,529 | 646 |
SNNP (without Sidama) | 329 | 1,389 | 409 | 198 | 166 |
Benishangul-Gumuz | 33 | 309 | — | — | — |
Sidama | — | 176 | — | — | 17 |
Somali | — | 10 | — | — | — |
Gambella | — | 23 | — | 6 | — |
Harari | — | 6 | 0 | 15 | 0 |
Dire Dawa | — | 1 | — | 9 | — |
Afar | — | 4 | — | 1 | — |
Source: ESS, Agricultural Sample Survey 2021/22, volume I (A3). A dash means not grown, not published or inconsistent row.
Oromia and Amhara together produce 88% of the country's grain. The pastoral regions (Afar, Somali) produce very little, but they concentrate livestock and a large share of the irrigable land of the lower valleys.
7. The twenty main crops: Three rankings
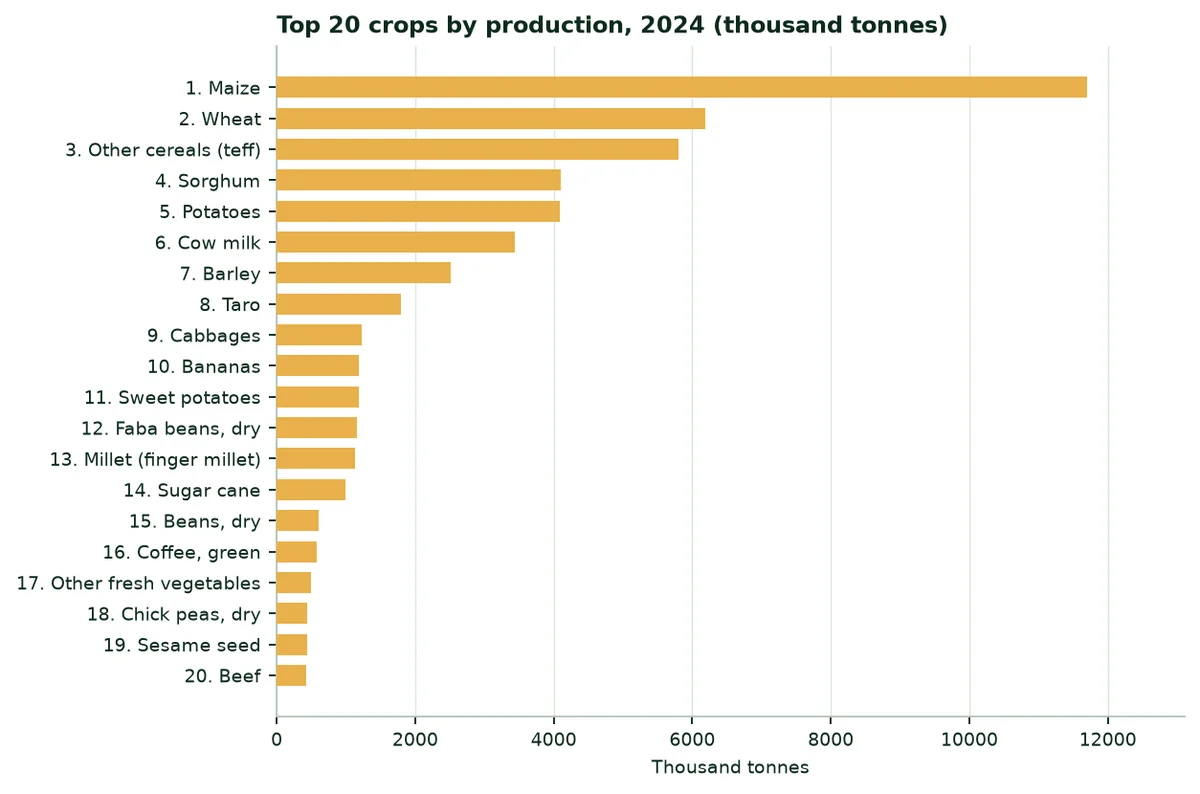
FAOSTAT records 17.9 million hectares harvested in 2024, all crops together. The three rankings below show the crops that occupy the most land, those that produce the most tonnes, and those that create the most value.
7.1 By harvested area
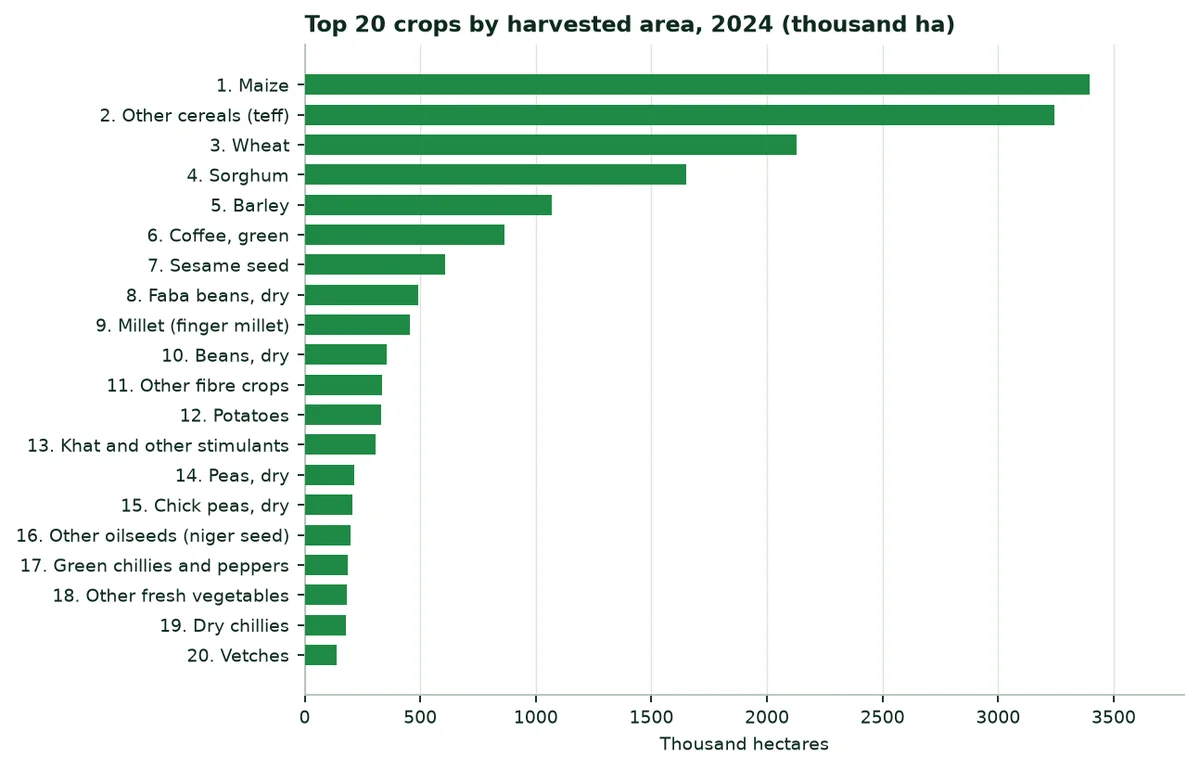
The twenty main crops by area: Area, production and yield, 2024
Rank | Crop | Area (ha) | Production (t) | Yield (t/ha) |
|---|---|---|---|---|
1 | Maize | 3,397,928 | 11,701,131 | 3.44 |
2 | Other cereals (teff) | 3,245,192 | 5,798,195 | 1.79 |
3 | Wheat | 2,129,952 | 6,185,341 | 2.90 |
4 | Sorghum | 1,650,000 | 4,100,000 | 2.48 |
5 | Barley | 1,069,033 | 2,517,344 | 2.35 |
6 | Coffee, green | 862,943 | 575,696 | 0.67 |
7 | Sesame seed | 608,111 | 435,456 | 0.72 |
8 | Faba beans, dry | 491,913 | 1,156,009 | 2.35 |
9 | Millet (finger millet) | 455,000 | 1,125,000 | 2.47 |
10 | Beans, dry | 354,072 | 604,791 | 1.71 |
11 | Other fibre crops | 334,356 | 21,980 | 0.07 |
12 | Potatoes | 332,146 | 4,089,166 | 12.31 |
13 | Khat and other stimulants | 306,400 | 283,916 | 0.93 |
14 | Peas, dry | 215,377 | 399,813 | 1.86 |
15 | Chick peas, dry | 207,378 | 443,954 | 2.14 |
16 | Other oilseeds (niger seed) | 196,687 | 270,050 | 1.37 |
17 | Green chillies and peppers | 187,924 | 397,890 | 2.12 |
18 | Other fresh vegetables | 180,918 | 499,656 | 2.76 |
19 | Dry chillies | 177,971 | 298,080 | 1.67 |
20 | Vetches | 139,813 | 320,718 | 2.29 |
Source: FAOSTAT (A2)
7.2 By production
7.3 By value of production
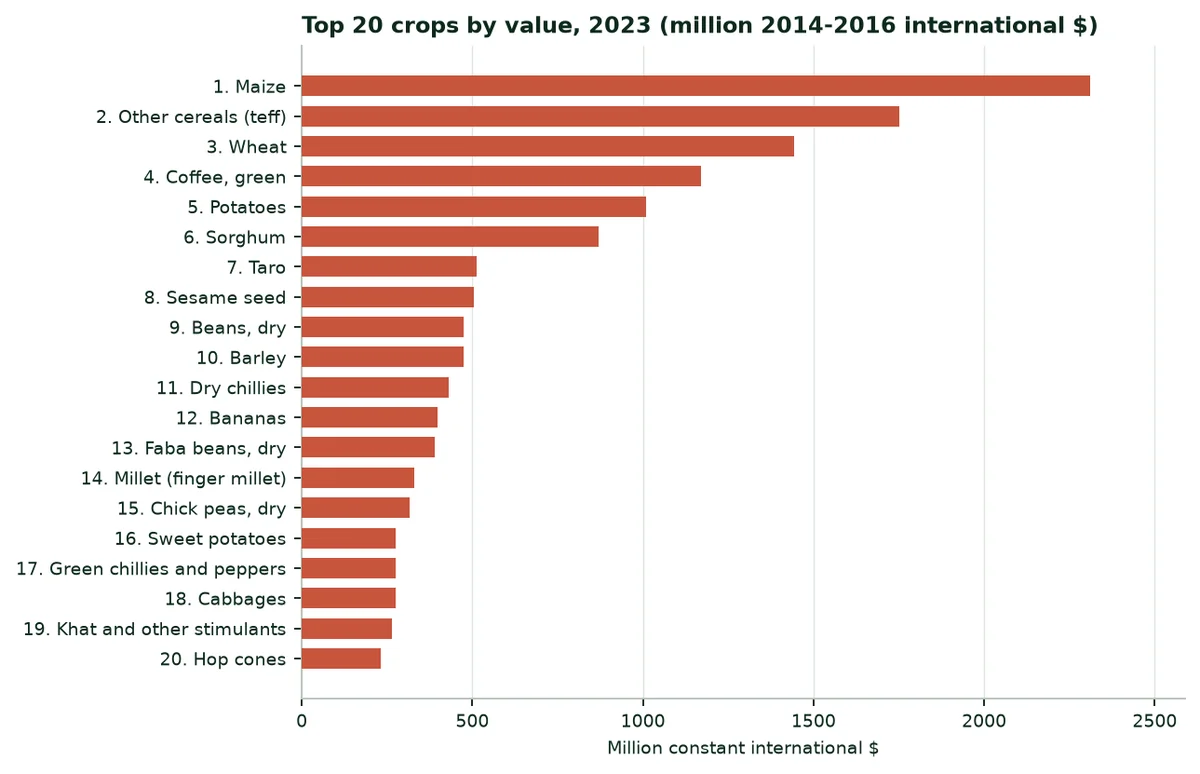
Value is expressed in constant 2014-2016 international dollars, to avoid exchange-rate effects. Crops represent $16.1 bn out of a total agricultural production of $21.7 bn in 2023; livestock provides the rest.
8. Extrapolation by crop and water savings
8.1 Method
8.2 Trials used as analogues
Trials cited and their use in the calculation
Trial | Published water saving | Published yield gain | Use in this dossier | Level |
|---|---|---|---|---|
Maize, Türkiye (TIGEM, 2025) | −39% | +17.1% | Irrigated maize | C |
Potato, South Africa (2025-2026) | −52% | +31.4% | Onion, garlic, potato | C |
Watermelon, Mexico (2023) | −60.5% | +30% | Vegetables | C |
Soybean, China (Shandong) | Not measured | +11.2 to 11.4% | Yield of other cereals and pulses | B |
Date palm, UAE (ICBA, 2020-2021) | −82% | +20% | Not used (no irrigated palm groves recorded) | B |
Source: Trials published on the Green Solutions website (A20 to A24).
The trial closest to Ethiopian conditions is maize in Türkiye: 39% less irrigation water and 17.1% more yield, on one plot per treatment. Maize is both the country's first cereal and the first irrigated crop of smallholders.
8.3 Parameters by crop group
Areas and parameters used, by scenario (cautious / central / strong)
Group | Area (ha) | Analogue | Water | Yield |
|---|---|---|---|---|
Maize | 189,237 | Maize, Türkiye (TIGEM, 2025) | 9.8% / 19.5% / 39.0% | 4.3% / 8.6% / 17.1% |
Other cereals (sorghum, teff, wheat) | 162,483 | Water: Generic assumption; yield: Soybean, China | 5% / 10% / 20% | 2.8% / 5.7% / 11.3% |
Pulses | 20,339 | Water: Generic assumption; yield: Soybean, China | 5% / 10% / 20% | 2.8% / 5.7% / 11.3% |
Vegetables (tomato, pepper, cabbage) | 42,528 | Watermelon, Mexico (2023) | 15.1% / 30.2% / 60.5% | 7.5% / 15.0% / 30.0% |
Onion, garlic, potato | 104,970 | Potato, South Africa (2025-2026) | 13.0% / 26.0% / 52.0% | 7.8% / 15.7% / 31.4% |
Fruit (banana, mango, citrus, avocado) | 65,400 | Generic assumption, no trial | 5% / 10% / 20% | — |
Khat, coffee, gesho | 207,160 | Generic assumption, no trial | 5% / 10% / 20% | — |
Sugar cane | 33,874 | Generic assumption, no trial | 5% / 10% / 20% | — |
Other (enset, oilseeds, misc.) | 32,169 | Generic assumption, no trial | 5% / 10% / 20% | — |
Source: ESS (A4), FAOSTAT (A2), author's calculation (Annex B).
8.4 National results
1.46 km³ Of water saved per year in the central scenario (15% of agricultural water). | 129,000 ha More irrigable with the same water, at today's average use. | 335,000 t Of additional production in the central scenario (onion, garlic, potato, maize, vegetables). |
Water saved, extra irrigable hectares and production gain, by scenario
Scenario | Water (million m³/yr) | Share of agricultural water | Extra irrigable hectares | Extra production (t) | Value ($M 2014-2016) |
|---|---|---|---|---|---|
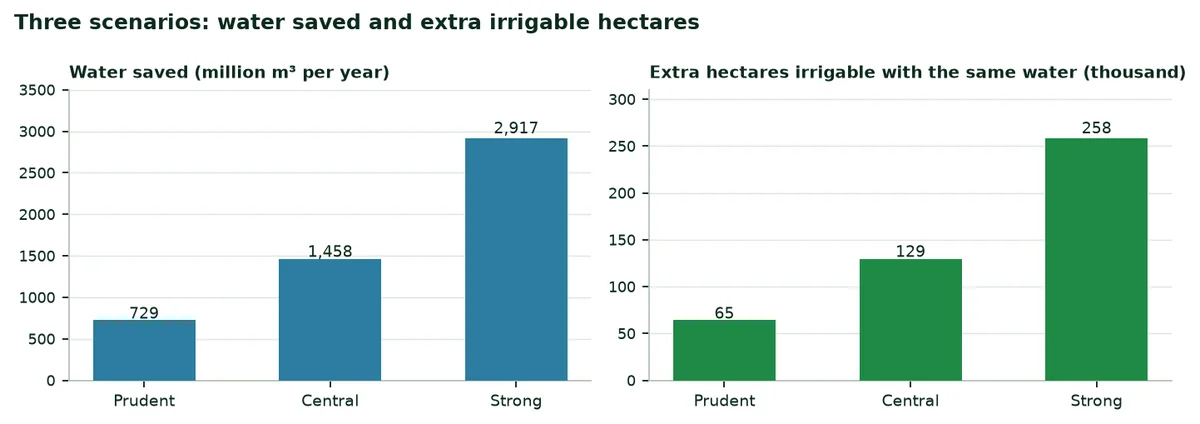
Cautious | 729 | 7.5% | 64,600 | 167,387 | 41.6 |
Central | 1,458 | 15.1% | 129,201 | 334,774 | 83.3 |
Strong | 2,917 | 30.1% | 258,401 | 669,548 | 166.6 |
Source: Author's calculation (Annex B).
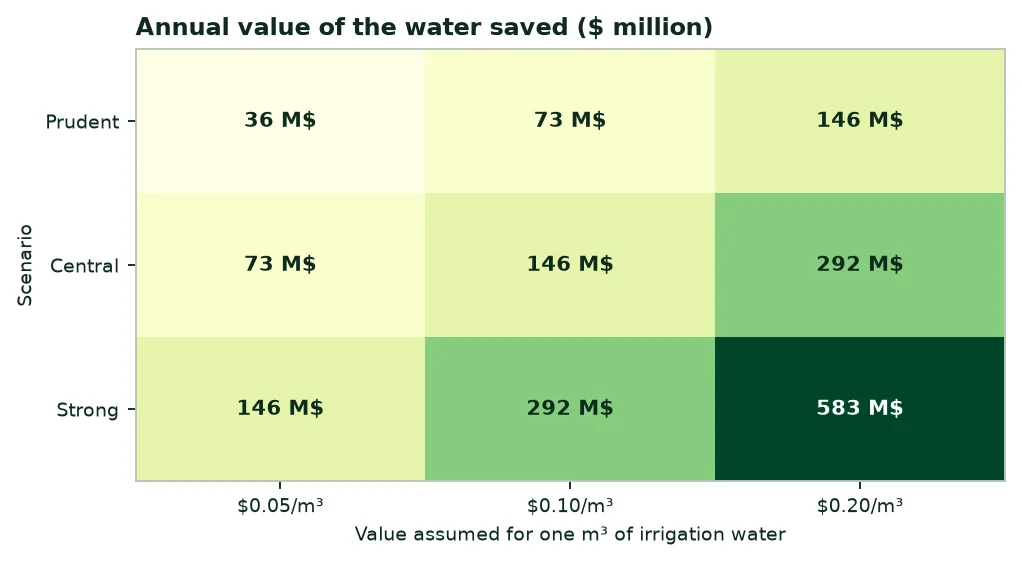
Irrigation water has no single price in Ethiopia: It is often free for smallholders and paid as pumping energy elsewhere. The matrix below gives the annual value of the water saved for three values per cubic metre, as a benchmark.
8.5 Water saved by crop group (central scenario)
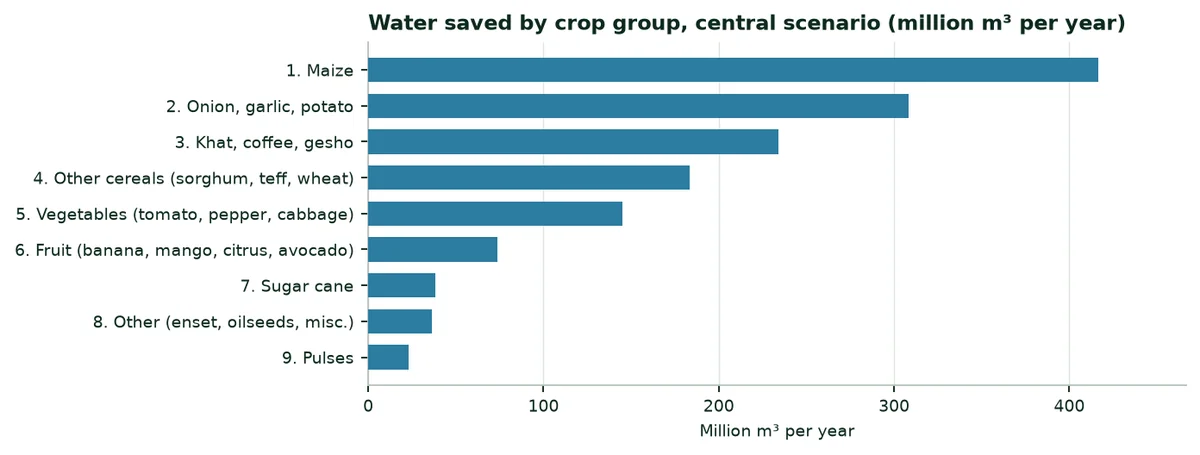
Water saved by crop group (central scenario)
Group | Share of irrigated area | Water used (Mm³/yr) | Water saved (Mm³/yr) | Extra production (t) |
|---|---|---|---|---|
Maize | 22.1% | 2,136 | 416.5 | 55,717 |
Onion, garlic, potato | 12.2% | 1,185 | 308.1 | 224,671 |
Khat, coffee, gesho | 24.1% | 2,338 | 233.8 | — |
Other cereals (sorghum, teff, wheat) | 18.9% | 1,834 | 183.4 | 24,166 |
Vegetables (tomato, pepper, cabbage) | 5.0% | 480 | 145.2 | 27,906 |
Fruit (banana, mango, citrus, avocado) | 7.6% | 738 | 73.8 | — |
Sugar cane | 3.9% | 382 | 38.2 | — |
Other (enset, oilseeds, misc.) | 3.7% | 363 | 36.3 | — |
Pulses | 2.4% | 230 | 23.0 | 2,314 |
Source: Author's calculation (Annex B).
Regional split of the central saving, according to smallholder irrigation
Region | Irrigated area 2021/22 (ha) | Water saved (Mm³/yr) | Extra irrigable hectares |
|---|---|---|---|
Oromia | 73,762 | 651.5 | 57,719 |
Amhara | 45,966 | 406.0 | 35,969 |
South (former SNNP, with Sidama) | 28,682 | 253.3 | 22,444 |
Somali | 6,658 | 58.8 | 5,210 |
Harari | 4,326 | 38.2 | 3,385 |
Afar | 3,765 | 33.3 | 2,946 |
Dire Dawa | 869 | 7.7 | 680 |
Source: ESS (A4); author's calculation (Annex B).
8.6 Reading the results
9. Potential benefits of our products
The benefits below follow from the figures in the previous sections. They are grouped by type of situation.
Potential benefits, by situation
Situation | Figure at stake | Product | Expected benefit |
|---|---|---|---|
Irrigated schemes (Awash, Rift, Gamo, Shebelle) | 858,160 ha equipped; 11,288 m³/ha/yr | EVERGREEN®, ECOSORB® | 1.46 km³ saved per year (central) |
Irrigated onion, garlic, potato | 104,970 ha estimated | EVERGREEN®, ECOFERT® | 224,671 t of extra production (central) |
Rain-fed cereals exposed to dry spells | 12.2 Mha of grain | ECOSORB® | Water reserve near the roots during dry spells (to be measured by trial) |
Imported fertilisers | At least $630 M in 2023 | ECOFERT® | Certified organic fertilisation, alongside mineral fertilisers |
Reforestation and agroforestry | 26.8 Mha of forest; degraded highland land | Paulownia ALTIFOLIA®, EVERGREEN® | Better seedling survival in the dry season (to be measured by trial) |
Source: Sections 2 to 8 of this dossier.
The southern regions and Amhara count hundreds of thousands of small irrigators, with plots of a few hundred square metres. For them, the benefit is measured mainly in irrigation days saved and in a secured harvest during the dry season.
10. External trade: Exports and imports
10.1 Overview, 2023
In 2023, Ethiopia exported $2.26 bn of agricultural products and imported $2.09 bn (FAOSTAT). Agricultural products make up most of merchandise exports ($3.62 bn in total), while the country imports $17.9 bn of goods. FAOSTAT 2024 data are still incomplete for Ethiopia; 2023 is used as the reference.
10.2 Exports
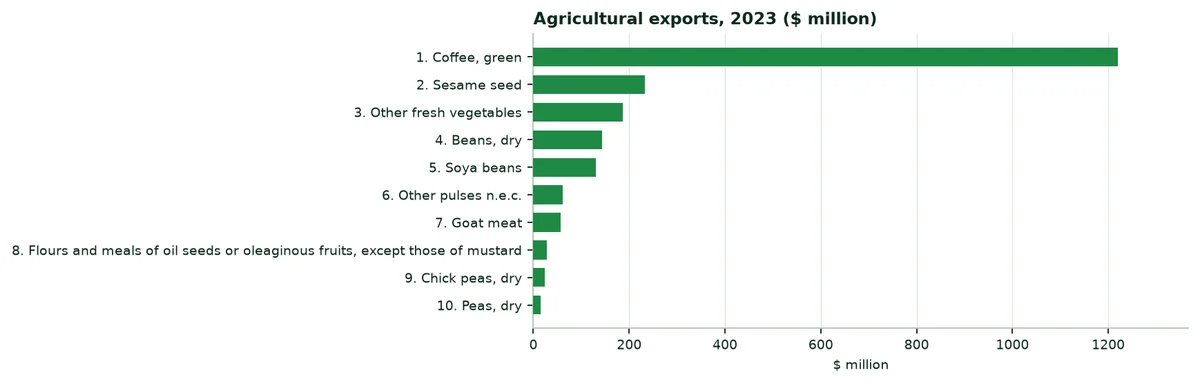
Main agricultural exports and imports, 2022 and 2023 ($ million)
Export | 2022 | 2023 | Import | 2022 | 2023 |
|---|---|---|---|---|---|
Coffee, green | 1,509 | 1,221 | Palm oil | 894 | 492 |
Sesame seed | 183 | 233 | Wheat | 866 | 338 |
Other fresh vegetables | 233 | 187 | Raw sugar | 506 | 238 |
Beans, dry | 108 | 143 | Rice, milled | 371 | 190 |
Soya beans | 45 | 130 | Sunflower-seed oil, crude | 438 | 155 |
Other pulses n.e.c. | 44 | 62 | Wheat and meslin flour | 32 | 130 |
Goat meat | 82 | 56 | Peas, dry | 115 | 99 |
Flours and meals of oil seeds or oleaginous fruits, except those of mustard | 24 | 27 | Lentils, dry | 78 | 56 |
Chick peas, dry | — | 23 | Flour-based food preparations | 36 | 49 |
Peas, dry | — | 16 | Refined sugar | 71 | 40 |
Source: FAOSTAT (A2). A dash means outside the top twelve products in 2022.
Coffee dominates. For the 2024/25 fiscal year, the Ethiopian Coffee and Tea Authority reports a record 2.65 billion dollars for 468,967 t exported (A17). Horticulture (cut flowers, fruit and vegetables) earned 565 million dollars over the same year (A18).
10.3 Imports
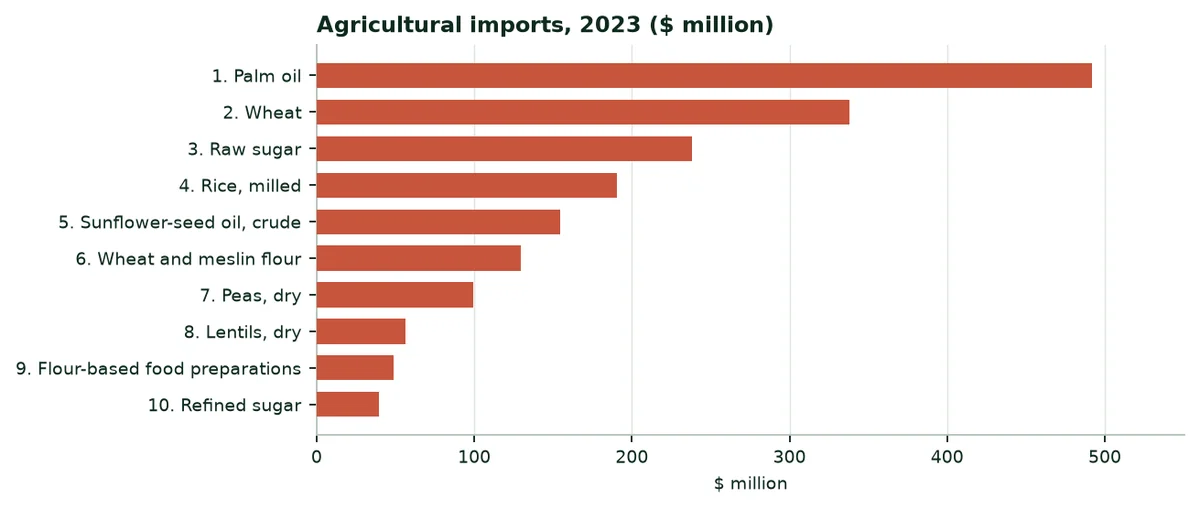
The country mainly imports oils (palm oil, sunflower), wheat (567 thousand tonnes in 2023), raw sugar (547 thousand tonnes) and rice. Every extra tonne of wheat or sugar produced thanks to irrigation reduces these foreign-currency purchases.
10.4 The Djibouti corridor
Ethiopia has no access to the sea. According to the figures published for 2025/26, the ports of Djibouti handled 96.7% of Ethiopia's external freight (A19). The Addis Ababa-Djibouti electric railway (753 km, 2018) and the main road carry imported fertilisers, cereals and oils. A separate dossier covers Djibouti.
11. A study of each region
Each study gives the population, the climate of the capital (rainfall, reference evapotranspiration, temperature, sunshine), the main smallholder crops in 2021/22 and irrigation. Crop figures come from ESS; only consistent rows (area, production and yield matching) are kept.
11.1 Oromia
Indicator | Value |
|---|---|
Population (July 2024) | 41.79 million |
Climate of the capital (Adama) | Rain 354 mm; ET0 1,872 mm; 20.4 °C; 2,334 kWh/m² |
Grain 2021/22 (smallholders) | 17,554,271 t on 6,100,988 ha (53.5% of the country) |
Irrigation (main season 2021/22) | 73,762 ha; 401,366 farmers |
Water saved, central scenario | About 651.5 million m³ per year |
Source: ESS (A3, A4, A6); ERA5 (A8); PVGIS (A7); calculation (Annex B).
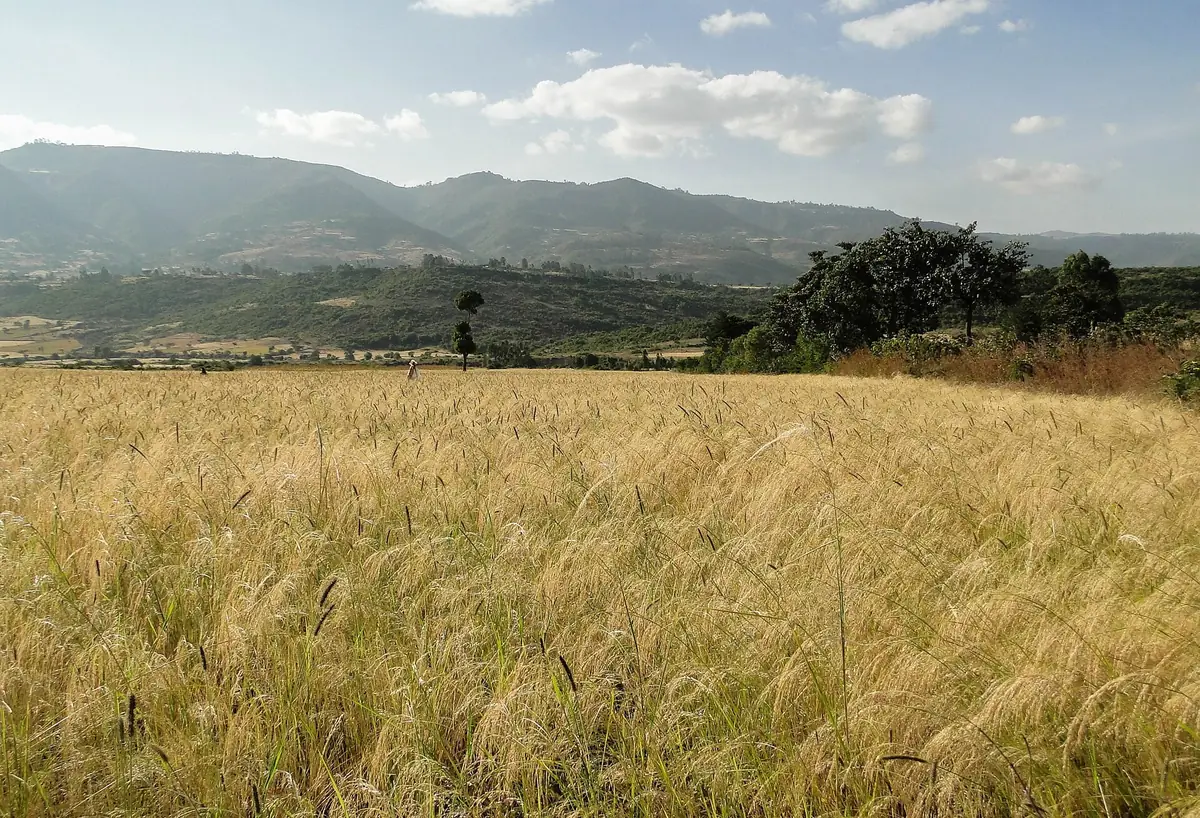
Oromia is the largest and most populous region (41.8 million people). It surrounds Addis Ababa and stretches from the Rift Valley lakes to the wheat and barley plateaus of Arsi and Bale, the coffee forests of Jimma and Ilu Ababor in the west, and the pastoral lowlands of Borena and Guji in the south.
It is the country's first granary: 54% of smallholder grain. It is also the first irrigated region (73,762 ha), along the upper Awash (Wonji and Metehara sugar estates), around the Rift lakes and in eastern Hararghe. Adama, the capital used for the climate, receives 354 mm a year for 1,872 mm of evapotranspiration in the ERA5 grid cell.
Main smallholder crops, 2021/22
Crop | Area (ha) | Production (t) |
|---|---|---|
Teff | 1,519,815 | 2,996,759 |
Maize | 1,464,048 | 6,190,777 |
Wheat | 1,030,582 | 3,467,385 |
Sorghum | 612,807 | 1,664,915 |
Coffee | 583,298 | 385,069 |
Barley | 434,183 | 1,239,939 |
Faba beans | 253,158 | 577,712 |
Source: ESS (A3)
 |  |
|---|
11.2 Amhara
Indicator | Value |
|---|---|
Population (July 2024) | 23.55 million |
Climate of the capital (Bahir Dar) | Rain 1,702 mm; ET0 1,578 mm; 20.1 °C; 2,214 kWh/m² |
Grain 2021/22 (smallholders) | 11,252,869 t on 4,586,326 ha (34.3% of the country) |
Irrigation (main season 2021/22) | 45,966 ha; 666,123 farmers |
Water saved, central scenario | About 406.0 million m³ per year |
Source: ESS (A3, A4, A6); ERA5 (A8); PVGIS (A7); calculation (Annex B).
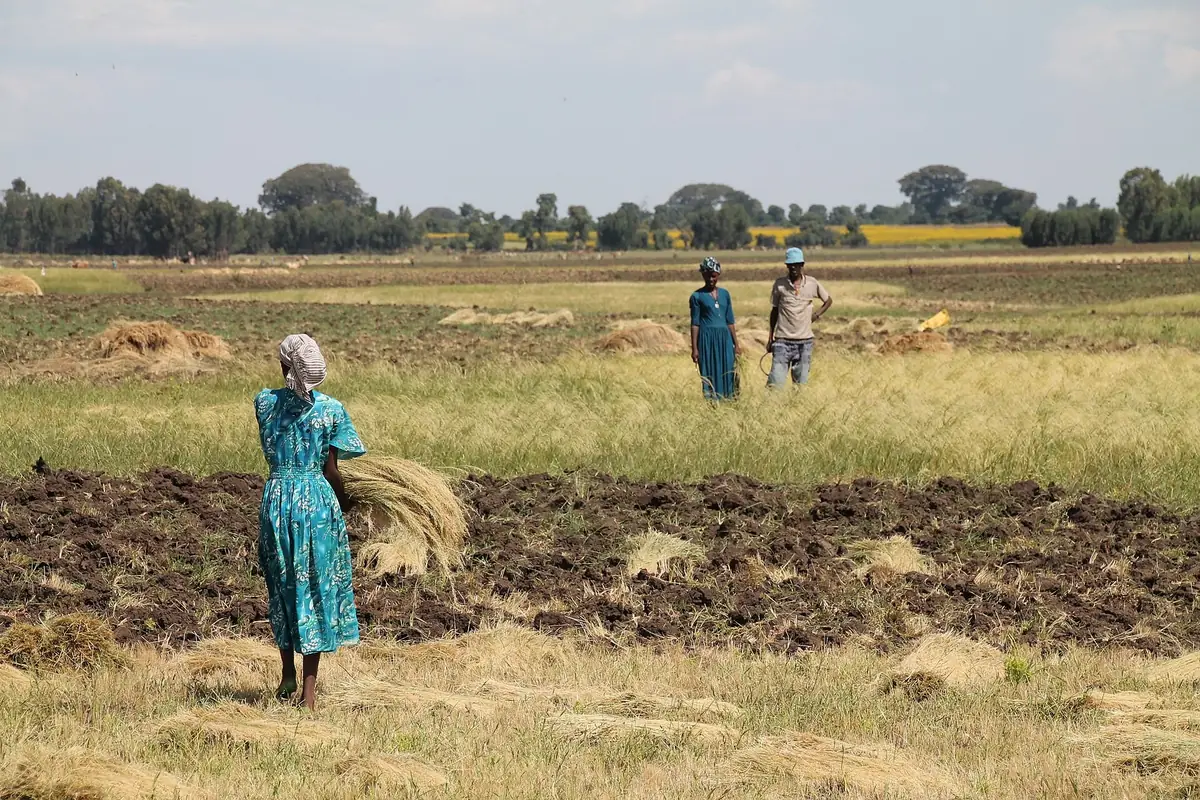
Amhara (23.5 million people) covers the north-western highlands: Gojjam, Gondar, Wollo and northern Shewa. Lake Tana, where the Blue Nile begins, lies at its centre. Teff covers more than one million hectares there.
Amhara counts the largest number of irrigators (666,123), on very small plots: 690 m² on average. Public schemes exist around Lake Tana. During the 2021/22 survey, several zones (North and South Wollo, Waghemra, the Oromo zone) could not be visited for security reasons; ESS estimated their figures.
Main smallholder crops, 2021/22
Crop | Area (ha) | Production (t) |
|---|---|---|
Teff | 1,177,078 | 2,254,030 |
Wheat | 689,614 | 1,922,029 |
Maize | 616,502 | 2,642,189 |
Sorghum | 576,148 | 1,529,198 |
Barley | 286,865 | 646,476 |
Finger millet | 243,448 | 632,893 |
Faba beans | 186,562 | 352,205 |
Source: ESS (A3)
 |  |
|---|
11.3 The South: Sidama, Central, South and South West
Indicator | Value |
|---|---|
Population (July 2024) | 22.44 million |
Climate of the capital (Hawassa) | Rain 1,017 mm; ET0 1,454 mm; 19.2 °C; 2,140 kWh/m² |
Grain 2021/22 (smallholders) | 3,181,526 t on 1,182,441 ha (9.7% of the country) |
Irrigation (main season 2021/22) | 28,682 ha; 90,583 farmers |
Water saved, central scenario | About 253.3 million m³ per year |
Source: ESS (A3, A4, A6); ERA5 (A8); PVGIS (A7); calculation (Annex B).
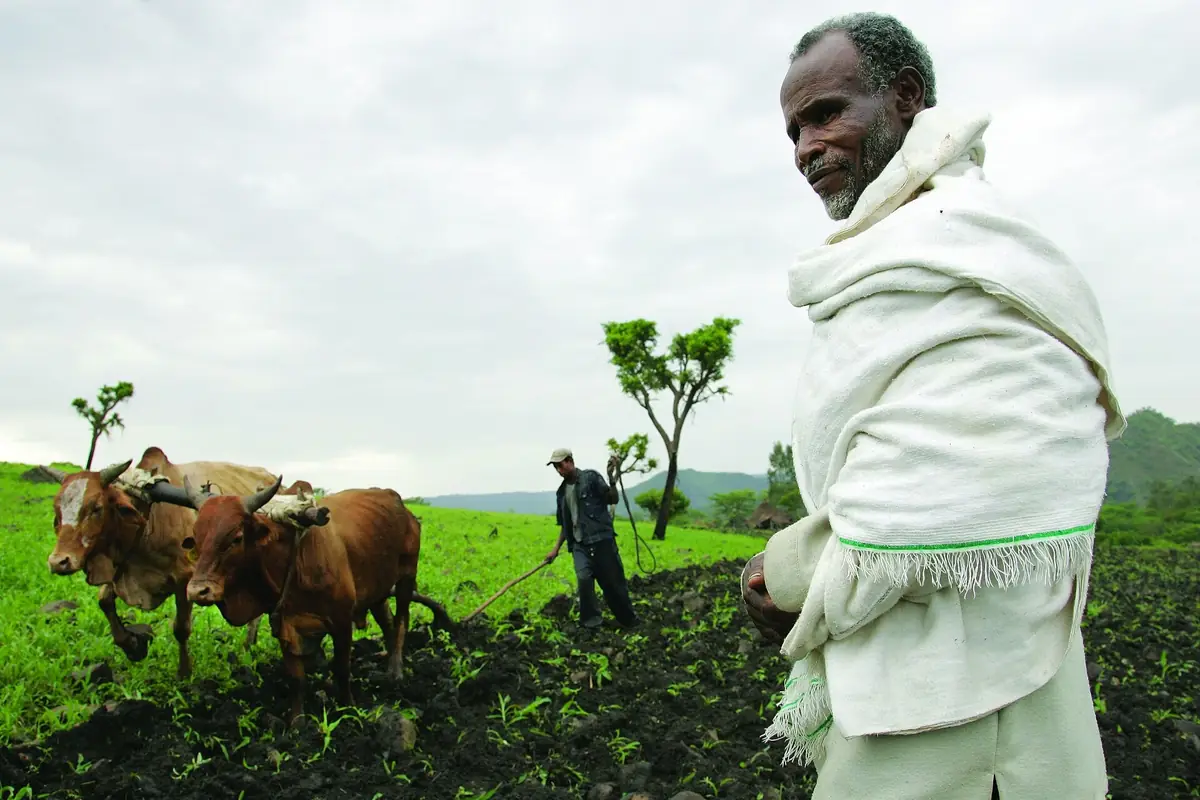
The former Southern Nations, Nationalities and Peoples' Region (SNNP) now forms four regions: Sidama (2020), South West (2021), Central and South (2023). It is the land of enset, coffee (Sidama, Gedeo, Kaffa), fruit and tubers. The four capitals receive from 1,017 mm (Hawassa) to 2,745 mm (Bonga) a year.
Smallholder irrigation covers 28,682 ha there, of which 18,566 ha in Gamo zone, around Arba Minch (bananas, mangoes). In the lower Omo valley, a large public sugar project irrigates lowland areas.
Main smallholder crops, 2021/22
Crop | Area (ha) | Production (t) |
|---|---|---|
Maize | 388,091 | 1,565,320 |
Teff | 211,639 | 328,840 |
Coffee | 181,572 | 153,179 |
Wheat | 142,739 | 409,266 |
Red Haricot beans | 120,209 | 190,692 |
Faba beans | 80,078 | 160,343 |
Sorghum | 79,130 | 197,617 |
Source: ESS (A3)
 |  |
|---|
11.4 Somali
Indicator | Value |
|---|---|
Population (July 2024) | 6.81 million |
Climate of the capital (Jijiga) | Rain 367 mm; ET0 1,638 mm; 19.5 °C; 2,361 kWh/m² |
Grain 2021/22 (smallholders) | 24,649 t on 30,956 ha (0.1% of the country) |
Irrigation (main season 2021/22) | 6,658 ha; 15,482 farmers |
Water saved, central scenario | About 58.8 million m³ per year |
Source: ESS (A3, A4, A6); ERA5 (A8); PVGIS (A7); calculation (Annex B).
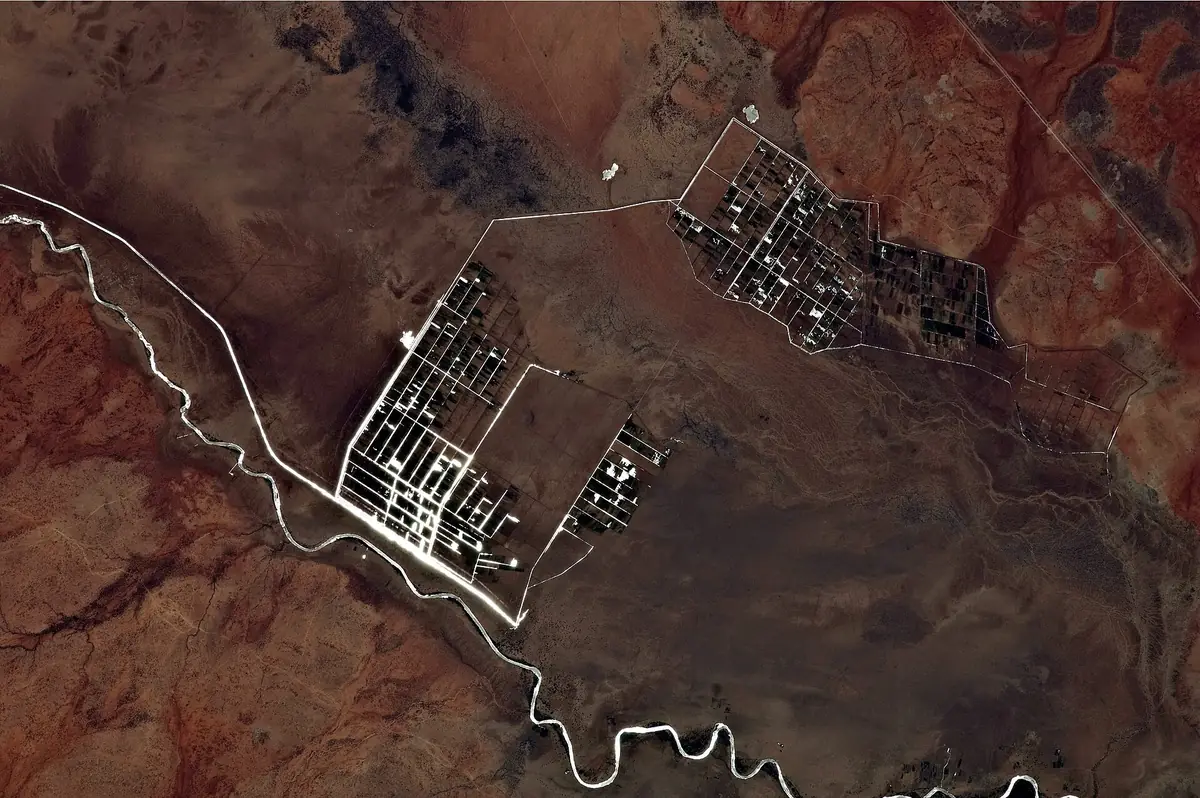
The Somali region (6.8 million people) is the largest pastoral region. Crops concentrate along the Shebelle and the Genale-Dawa, and around Jijiga. The ESS survey covers only settled farming there: 30,956 ha of grain in 2021/22.
Irrigation covers 6,658 ha, of which 5,345 ha in Shebelle zone. The region was the hardest hit by the 2020-2023 drought. It will host at Gode the urea plant announced in 2025 (section 5.2).
Main smallholder crops, 2021/22
Crop | Area (ha) | Production (t) |
|---|---|---|
Maize | 10,419 | 10,251 |
Khat | 192 | 101 |
Source: ESS (A3)
 |  |
|---|
11.5 Afar
Indicator | Value |
|---|---|
Population (July 2024) | 2.12 million |
Climate of the capital (Semera) | Rain 149 mm; ET0 2,453 mm; 30.3 °C; 2,350 kWh/m² |
Grain 2021/22 (smallholders) | 4,933 t on 9,943 ha (0.0% of the country) |
Irrigation (main season 2021/22) | 3,765 ha; 4,860 farmers |
Water saved, central scenario | About 33.3 million m³ per year |
Source: ESS (A3, A4, A6); ERA5 (A8); PVGIS (A7); calculation (Annex B).
Afar (2.12 million people) is a hot, arid depression: 149 mm of rain at Semera for 2,453 mm of reference evapotranspiration, the highest in the country. The middle and lower Awash carry irrigated estates (sugar cane, cotton) and the Werer agricultural research centre.
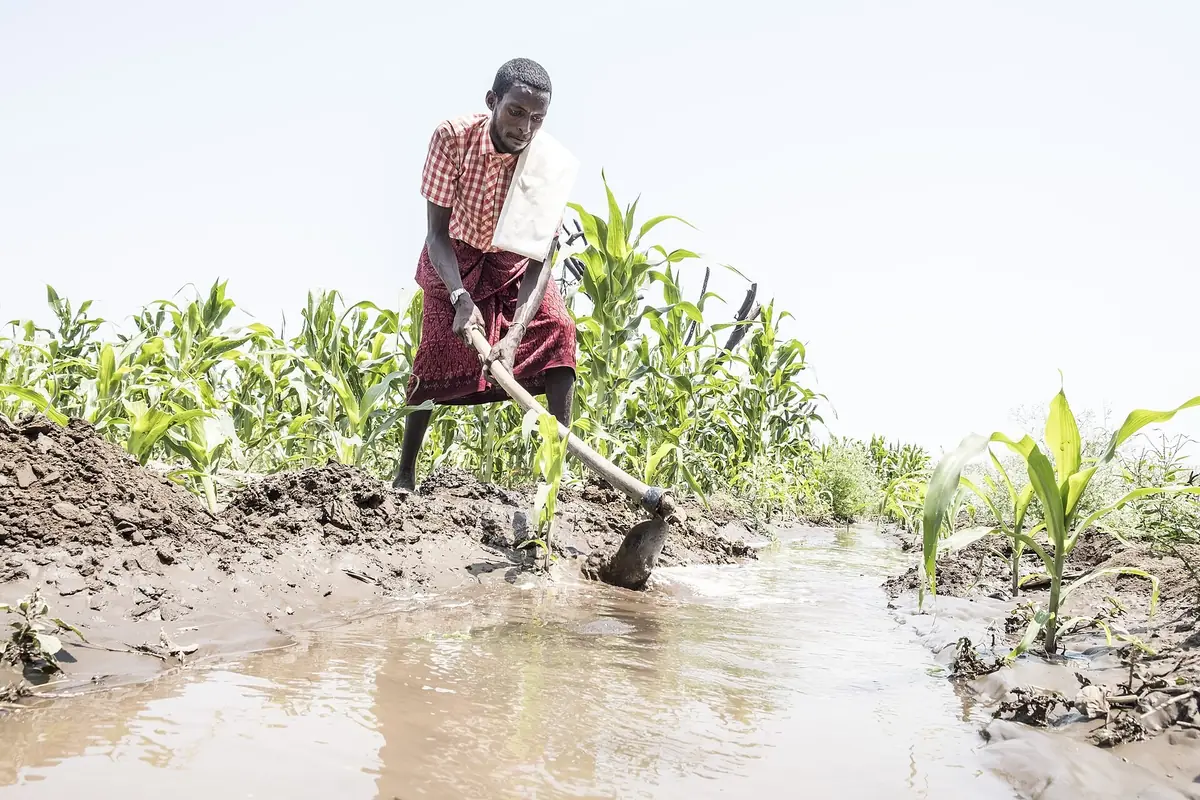
Smallholders irrigate 3,765 ha, mostly maize. The road and the railway to Djibouti cross the region; livestock exported through Djibouti leave from the Mille quarantine centre.
Main smallholder crops, 2021/22
Crop | Area (ha) | Production (t) |
|---|---|---|
Maize | 4,651 | 3,604 |
Sorghum | 2,501 | 1,200 |
Mung bean | 729 | 122 |
Sesame | 77 | 8 |
Source: ESS (A3)
 |  |
|---|
11.6 Tigray
Indicator | Value |
|---|---|
Population (July 2024) | 5.94 million |
Climate of the capital (Mekelle) | Rain 832 mm; ET0 1,642 mm; 18.1 °C; 2,246 kWh/m² |
Source: ESS (A3, A4, A6); ERA5 (A8); PVGIS (A7); calculation (Annex B).
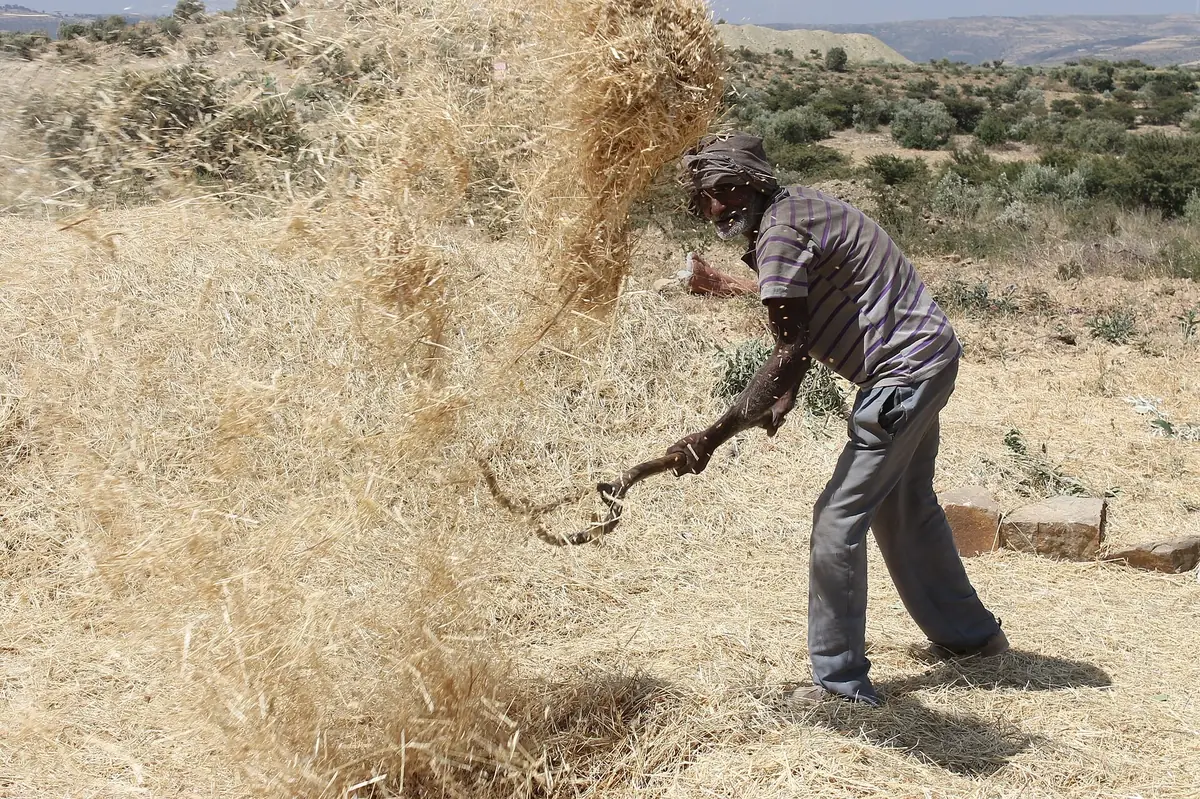
Tigray (5.94 million people) was not covered by the 2021/22 agricultural surveys, after the 2020-2022 conflict. Its highlands receive 832 mm at Mekele in the ERA5 grid cell, in a single rainy season, from June to September.
The region is known for its terraces, small dams and soil conservation works. Recent production data remain to be obtained from the regional bureau of agriculture.
 |  |
|---|
11.7 Benishangul-Gumuz and Gambella
Indicator | Value |
|---|---|
Population (July 2024) | 1.28 + 0.54 million |
Climate of the capital (Asosa) | Rain 1,455 mm; ET0 1,575 mm; 21.5 °C; 1,965 kWh/m² |
Grain 2021/22 (smallholders) | 738,999 t on 265,583 ha (2.3% of the country) |
Source: ESS (A3, A4, A6); ERA5 (A8); PVGIS (A7); calculation (Annex B).
The two western regions (1.28 million and 0.54 million people) are humid lowlands. Asosa receives 1,455 mm a year, Gambella 855 mm. The GERD lies in Benishangul-Gumuz, near the Sudanese border.
Maize, groundnut, soybean and finger millet dominate in Benishangul-Gumuz. In Gambella, commercial farms occupy the Baro plains. Smallholder irrigation data are not published there.
Main smallholder crops, 2021/22
Crop | Area (ha) | Production (t) |
|---|---|---|
Maize | 76,961 | 332,264 |
Groundnuts | 28,899 | 55,405 |
Soya beans | 26,305 | 63,026 |
Finger millet | 23,554 | 52,538 |
Teff | 22,021 | 33,445 |
Niger seed (nug) | 9,326 | 8,977 |
Sesame | 7,246 | 4,893 |
Source: ESS (A3)
11.8 Harari, Dire Dawa and Addis Ababa
Indicator | Value |
|---|---|
Population (July 2024) | Harari 289,000; Dire Dawa 566,000; Addis Ababa 4.03 million |
Climate of the capital (Harar) | Rain 678 mm; ET0 1,522 mm; 18.5 °C; 2,144 kWh/m² |
Grain 2021/22 (smallholders) | 33,105 t on 20,311 ha (0.1% of the country) |
Irrigation (main season 2021/22) | 4,326 ha; 13,749 farmers |
Water saved, central scenario | About 38.2 million m³ per year |
Source: ESS (A3, A4, A6); ERA5 (A8); PVGIS (A7); calculation (Annex B).
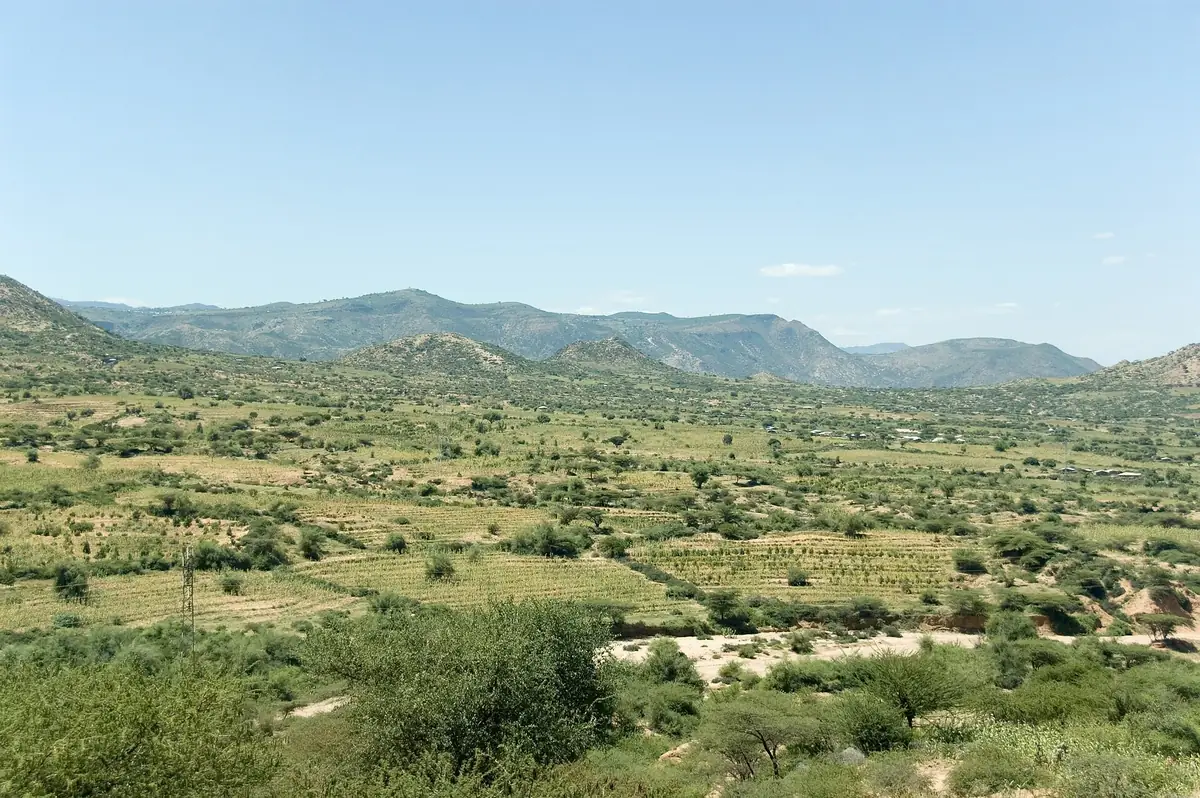
Harari (289,000 people) and Dire Dawa (566,000) are small eastern regions. Khat and sorghum dominate. Harari irrigates 4,326 ha, mostly from wells and sources other than rivers; Dire Dawa 869 ha. Dire Dawa is a stop on the railway to Djibouti.
Addis Ababa (4.03 million people) is first of all a market: Peri-urban vegetables, dairies, and the seat of public fertiliser purchasing.
Main smallholder crops, 2021/22
Crop | Area (ha) | Production (t) |
|---|---|---|
Sorghum | 15,945 | 24,458 |
Khat | 8,973 | 6,621 |
Maize | 2,527 | 6,964 |
Groundnuts | 1,185 | 1,005 |
Mangoes | 553 | 4,203 |
Wheat | 246 | 377 |
Coffee | 177 | 47 |
Source: ESS (A3)
 |  |
|---|
Annex A. Sources and confidence levels
Ref. | Source | Level |
|---|---|---|
A1 | World Bank, World Development Indicators (API, accessed 2026) | A |
A2 | FAO, FAOSTAT: Crops and livestock, value of production, trade, fertilisers, land use (bulk files, 2026) | A |
A3 | Ethiopian Statistics Service (ESS), Agricultural Sample Survey 2021/22, Volume I, Report on Area and Production of Major Crops, Meher Season | A |
A4 | ESS, Agricultural Sample Survey 2021/22, Report on Farm Management Practices, Main Season | A |
A5 | ESS, Large and Medium Scale Commercial Farms Sample Survey 2021/22 | A |
A6 | ESS, Population Size by Sex, Area and Density by Region, Zone and Wereda, July 2024 | A |
A7 | European Commission, JRC, PVGIS (solar radiation) | A |
A8 | Copernicus ERA5, via Open-Meteo: Rainfall, reference evapotranspiration and temperature, 1981-2024 | B |
A9 | Awulachew et al., IWMI, Ethiopia's irrigation potential (5.3 million hectares) | B |
A10 | OCHA, Ethiopia Drought Situation Update No. 1, 10 March 2023 | B |
A11 | GERD inauguration, 9 September 2025 (press: AFP, ENR, Water Power Magazine) | C |
A12 | Ethiopian Ministry of Agriculture, irrigated wheat initiative (ministry website, ENA) | C |
A13 | USDA Foreign Agricultural Service, Ethiopia Grain and Feed Annual | B |
A14 | Ethiopian Business Review, Addis Fortune, Argus Media: Fertiliser purchases 2025/26 | C |
A15 | Dangote Group and Ethiopian Investment Holdings, Gode urea plant agreement, August 2025 | C |
A16 | World Bank, Commodity Price Data (annual fertiliser prices) | A |
A17 | Ethiopian Coffee and Tea Authority, coffee exports 2024/25 (press) | C |
A18 | Ethiopian Horticulture Producer Exporters Association (EHPEA), exports 2024/25 | C |
A19 | Djibouti's share of Ethiopia's external freight, 2025/26 (regional business press) | C |
A20 | Green Solutions, maize trial, Türkiye (TIGEM, 2025) | C |
A21 | Green Solutions, potato trial, South Africa (2025-2026) | C |
A22 | Green Solutions, watermelon trial, Mexico (2023) | C |
A23 | Green Solutions, soybean trial, China (Shandong) | B |
A24 | Green Solutions, date palm trial, United Arab Emirates (ICBA, 2020-2021) | B |
A25 | Green Solutions, product sheets (green-solutions-group.com) | C |
Annex B. Calculation method
1. Agricultural water. Water withdrawals for agriculture amount to 9.69 km³ a year: 10.55 km³ of total withdrawals × 91.84% for agriculture (World Bank, 2022).
2. Areas by group. The equipped area (858,160 ha, FAOSTAT 2023) is split in two: Sugar cane harvested by the estates (23,419 ha, FAOSTAT 2024), then the rest according to the mix of smallholder irrigated crops (ESS 2021/22, table 6). This split is an assumption: Commercial farms grow more cane, cotton, fruit and flowers.
3. Water by group. Agricultural water is shared in proportion to areas. The thirstiest crops (cane, bananas) are therefore underestimated, cereals overestimated.
4. Water saving. For each group, the saving measured in the analogous trial is applied at a quarter, half or in full (cautious, central, strong scenarios). Without a trial, 5, 10 or 20%.
5. Yield. The trial's yield gain, applied the same way, multiplies the group's FAOSTAT 2024 average yield and its irrigated area. It is valued at the implicit price at constant 2014-2016 value (FAOSTAT 2023 production value ÷ 2023 production).
6. Extra irrigable hectares. The water saved is divided by today's average use (11,288 m³ per hectare per year).
7. Regions. The national result is shared according to the smallholder irrigated area in 2021/22 (ESS, table 5).
8. Fertilisers. Minimum spending = nitrogen ÷ 0.46 × urea price + phosphate ÷ 0.46 × TSP price + potash ÷ 0.60 × potassium chloride price (World Bank prices).
9. Climate. Rainfall, reference evapotranspiration (FAO-56) and temperature: 1991-2020 means of the ERA5 grid cell containing each capital; radiation: PVGIS, 2005-2020. Temperature trends are linear regressions over 1981-2024.
Annex C. Photo credits
File (Wikimedia Commons) | Author | Licence |
|---|---|---|
Teff Village Oromia Ethiopia Oct19 R16 02202.jpg | Timothy A. Gonsalves | CC BY-SA 4.0 |
Ethiopian farmer at work on his land.jpg | Bjvisser | CC BY-SA 4.0 |
Tef in Ethiopia 01.jpg | Bernard Gagnon | CC BY-SA 3.0 |
Woman in Lebe village, Amhara region, Ethiopia.JPG | Radim Z | CC BY-SA 4.0 |
ILRI, Stevie Mann - Ploughing with cattle in southwestern Ethiopia.jpg | Photo: ILRI/Stevie Mann | CC BY 2.0 |
Irrigation along the Shebelle River.JPG | ISS Expedition 27 crew | Public domain |
Bewässerungslandwirtschaft in der Savanne von Subuli, Region Afar.jpg | Menschen für Menschen Schweiz | CC BY-SA 4.0 |
Ethiopia Mekele ManHarvestingWheat.JPG | Charliefleurene | CC BY 4.0 |
On the Road to Harar, Ethiopia (2142134023).jpg | A. Davey from Where I Live Now: Pacific North | CC BY 2.0 |
Cattle herd in riverbed Afar Ethiopia.jpg | Sonjamariavienna | CC BY-SA 4.0 |
ILRI, Stevie Mann - Cattle being watered at the Ghibe River in southwe | Photo: ILRI/Stevie Mann | CC BY 2.0 |
Source: Photos published on Wikimedia Commons, used unmodified under their licence.
Tell us about your farm
Crop, irrigation method, soil type, the volume of water you use today. We come back with the matching combination of technologies, the dosing, and the trials already run in comparable situations.
A first conversation commits you to nothing.
Tell us about your farmcontact@green-solutions-group.com · Green Solutions Groupe AIM SA, 46, route de la Condémine, 1475 Forel, Switzerland
Photo credits
- Timothy A. Gonsalves — CC BY-SA 4.0, « Teff Village Oromia Ethiopia Oct19 R16 02202 »
- Sonjamariavienna — CC BY-SA 4.0, « Cattle herd in riverbed Afar Ethiopia »
- Menschen für Menschen Schweiz — CC BY-SA 4.0, « Bewässerungslandwirtschaft in der Savanne von Subuli, Region Afar »
- A. Davey from Where I Live Now: Pacific Northwest — CC BY 2.0, « On the Road to Harar, Ethiopia (2142134023) »
- Bernard Gagnon — CC BY-SA 3.0, « Tef in Ethiopia 01 »
- Nina R from Africa — CC BY 2.0, « Lake Tana, Ethiopia (51642940047) »
- Photo: ILRI/Stevie Mann — CC BY 2.0, « ILRI, Stevie Mann - Ploughing with cattle in southwestern Ethiopia »
- Bjvisser — CC BY-SA 4.0, « Ethiopian farmer at work on his land »
Photographs from Wikimedia Commons, reused under their stated licences.