ΜΕΛΕΤΗ ΑΓΟΡΑΣ
Ελλάδα
ΕΛΛΗΝΙΚΗ ΔΗΜΟΚΡΑΤΙΑ
Ελαιόλαδο, βαμβάκι, αμπέλι και οπωροφόρα με όλο και λιγότερο νερό.
Τι αλλάζει η συγκράτηση νερού στο έδαφος σε μια εξαγωγική γεωργία.
Foreword
This dossier describes Greece from the angle of water, climate, fertilisers and crops. It is written for the ministries in charge of agriculture, water and trade, the regional directorates of agriculture, cooperatives and producer organisations. It answers three questions: Where is water short, for which crops, and in which regions? It then examines what our products can change, in rainfed as well as irrigated farming, and what that can mean for the country's external trade.
Reading the sources. Every figure refers to a source, named in the text and detailed in Annex A. Each source carries a confidence level:
Summary
The points below summarise the dossier. The figures come from public sources: The World Bank, FAO (FAOSTAT, AQUASTAT), Greek public bodies (ELSTAT, Ministry of Rural Development and Food, AADE tax authority) and the European Union, PVGIS and NASA POWER. The production gains and water savings are scenarios, described in Annex B.
10.41 M Inhabitants in 2025 (World Bank) | 840,620 ha Of olives harvested in 2023, the main crop | 2.00 M ha Equipped for irrigation (2024) |
906 Mm³ Of irrigation water saved a year, central scenario | 10,625 M$ Of agricultural exports in 2024 (FAOSTAT) |
Key figures
Key indicators for Greece
Indicator | Value | Year | Source (level) |
|---|---|---|---|
Population | 10.41 M | 2025 | World Bank (A1) |
GDP per capita | 26,948 $ | 2025 | World Bank (A1) |
Agriculture share of GDP | 3.6% | 2025 | World Bank (A1) |
Agricultural employment | 10.7% | 2025 | World Bank (A1) |
Cropland | 2,888,000 ha | 2024 | FAOSTAT (A6) |
Area equipped for irrigation | 2,001,000 ha | 2024 | FAOSTAT (A6) |
Harvested area: Olives | 840,620 ha | 2023 | FAOSTAT (A2) |
Certified organic cropland | 271,690 ha | 2024 | FAOSTAT (A6) |
Agricultural exports | 10,625 M$ | 2024 | FAOSTAT (A4) |
Agricultural imports | 10,835 M$ | 2024 | FAOSTAT (A4) |
Mineral nitrogen, agricultural use | 195,817 t | 2024 | FAOSTAT (A5) |
Source: Table based on the sources indicated.
1. Green Solutions and our products
Green Solutions develops products for water, fertilisation and crop protection. Four families are of interest to this dossier. The yields cited are those published by the manufacturer or by the trials, with their confidence level.
Products covered by this dossier
Product | Claimed use | Published evidence (level) |
|---|---|---|
EVERGREEN® (water-retention polymer) | Holds rain or irrigation water as a gel, near the roots. | Trials on maize, potato, watermelon, date palm and soybean. Level B to C. |
ECOSORB® (water-retention polymer based on corn starch) | Same use; action lasting 2 to 3 years according to the website. | Soybean trial (China); laboratory acrylamide analysis. Level B to C. |
ECOFERT® (fertiliser) | Fertiliser certified by SOHISCERT and EU Bio, usable in organic farming. | Published certificate; potato trial combined with EVERGREEN®. Level A (certificate), C (results). |
Paulownia ALTIFOLIA® | Fast-growing tree for agroforestry. | Website figures; no trial in Greece. Level C. |
Water Vital®, NAPEMA® | Outside the scope of this dossier. | No independent source in the documents consulted. |
Source: Green Solutions website (product sheets and published trials), Annex A.
The indicative dose published on the website is 30 to 75 kg/ha.
2. Greece in figures
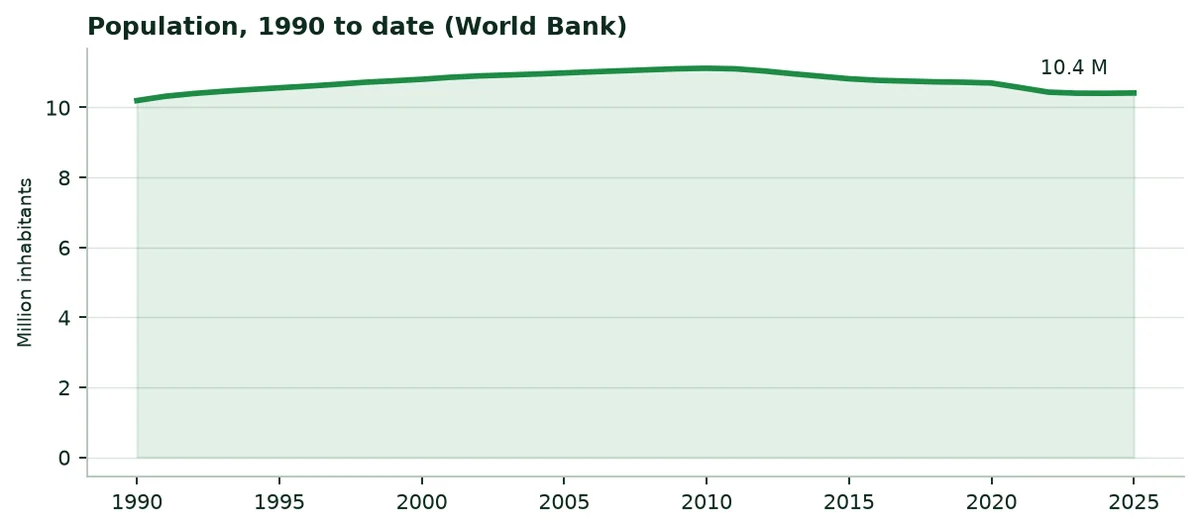
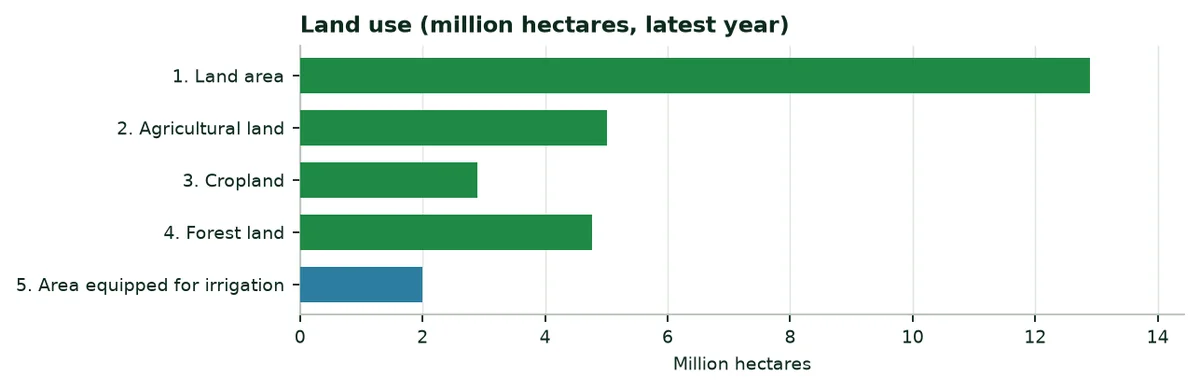
Greece had 10.41 million inhabitants in 2025, 21% of them in rural areas. Agriculture accounts for 3.6% of gross domestic product and employs 11% of the labour force. The country covers 128.9 thousand km², of which 39% is agricultural land. Undernourishment affects 2.5% of the population.
Agricultural and water indicators, latest year published
Indicator | Value | Year | Source |
|---|---|---|---|
Cropland certified organic | 271,690 ha | 2024 | FAOSTAT (A6) |
Average cereal yield | 4,053 kg/ha | 2024 | World Bank (A1) |
Fertiliser use per hectare of arable land | 186.6 kg/ha | 2024 | World Bank (A1) |
Water withdrawals, agricultural share | 80.5% | 2022 | World Bank (A1) |
Internal freshwater resources | 58.0 km³ | 2022 | World Bank (A1) |
Internal resources per inhabitant | 5,557 m³ | 2022 | World Bank (A1) |
3. Sunshine, rainfall and climate change
3.1 Sunshine
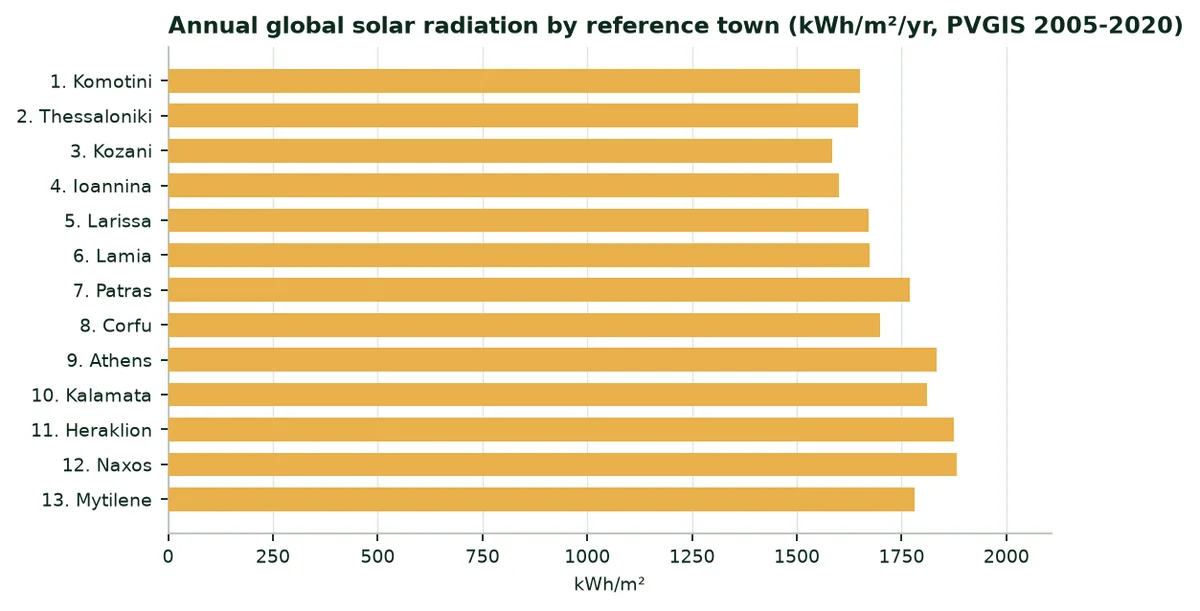
Global solar radiation reaches 1,584 to 1,882 kWh/m² a year depending on the region. Energy is not the limit: Water available at the right time makes the harvest.
3.2 Rainfall and evapotranspiration
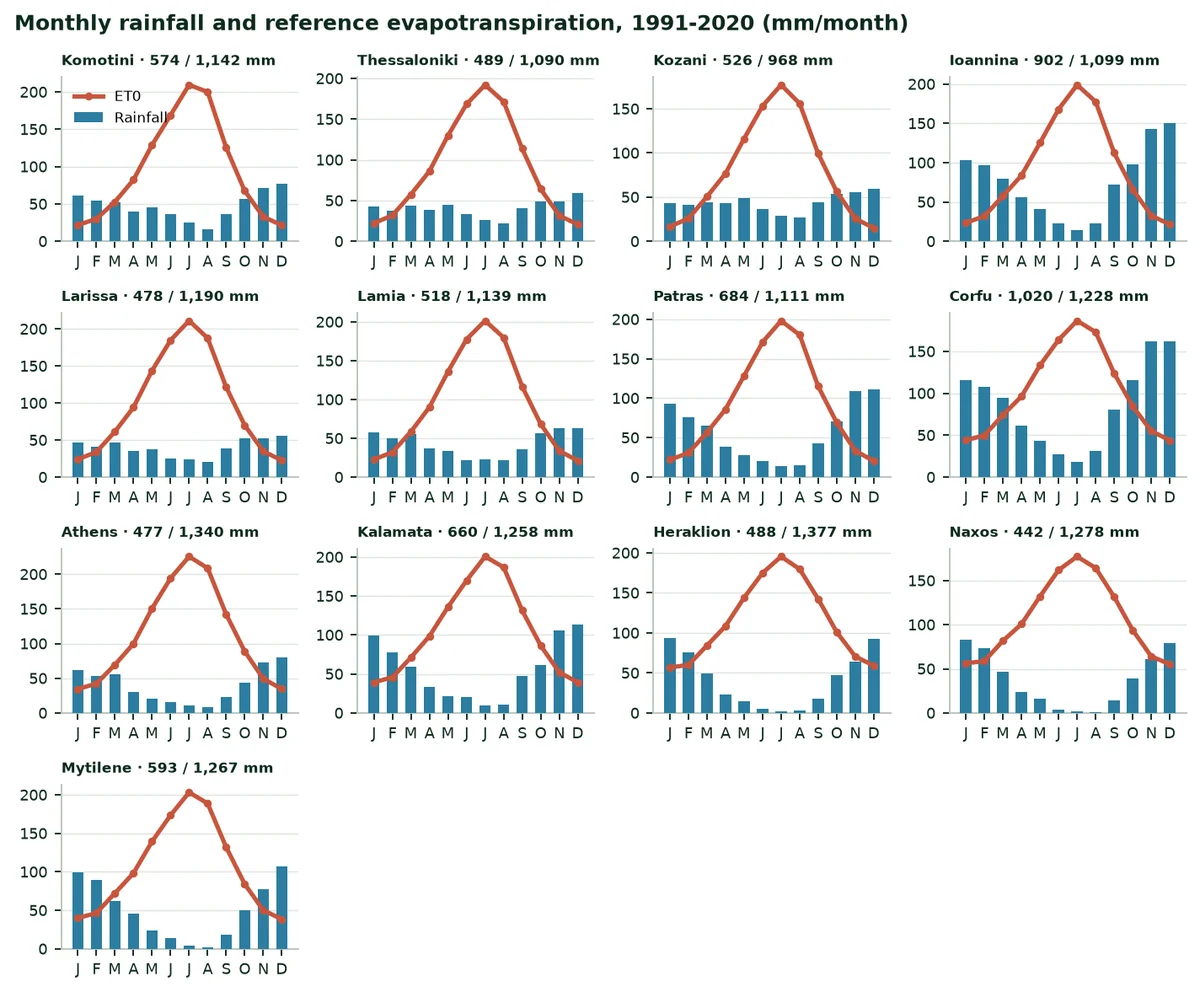
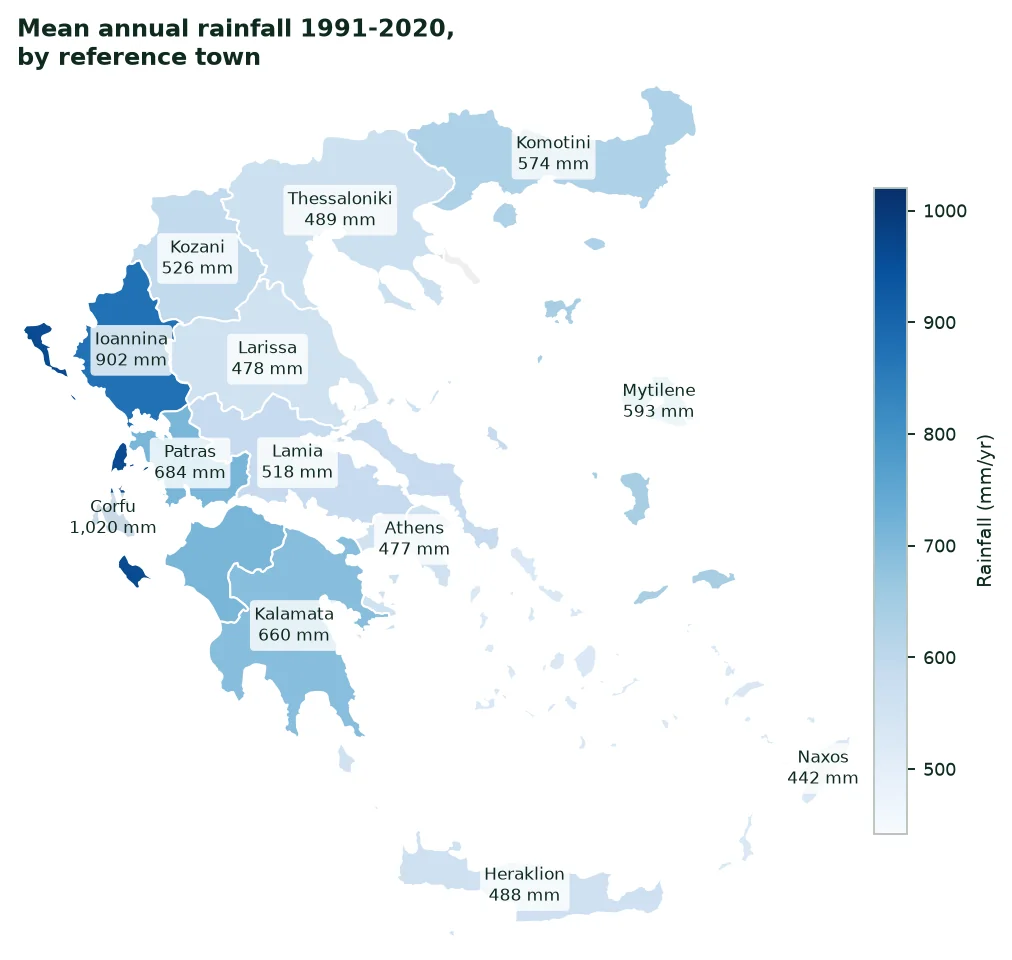
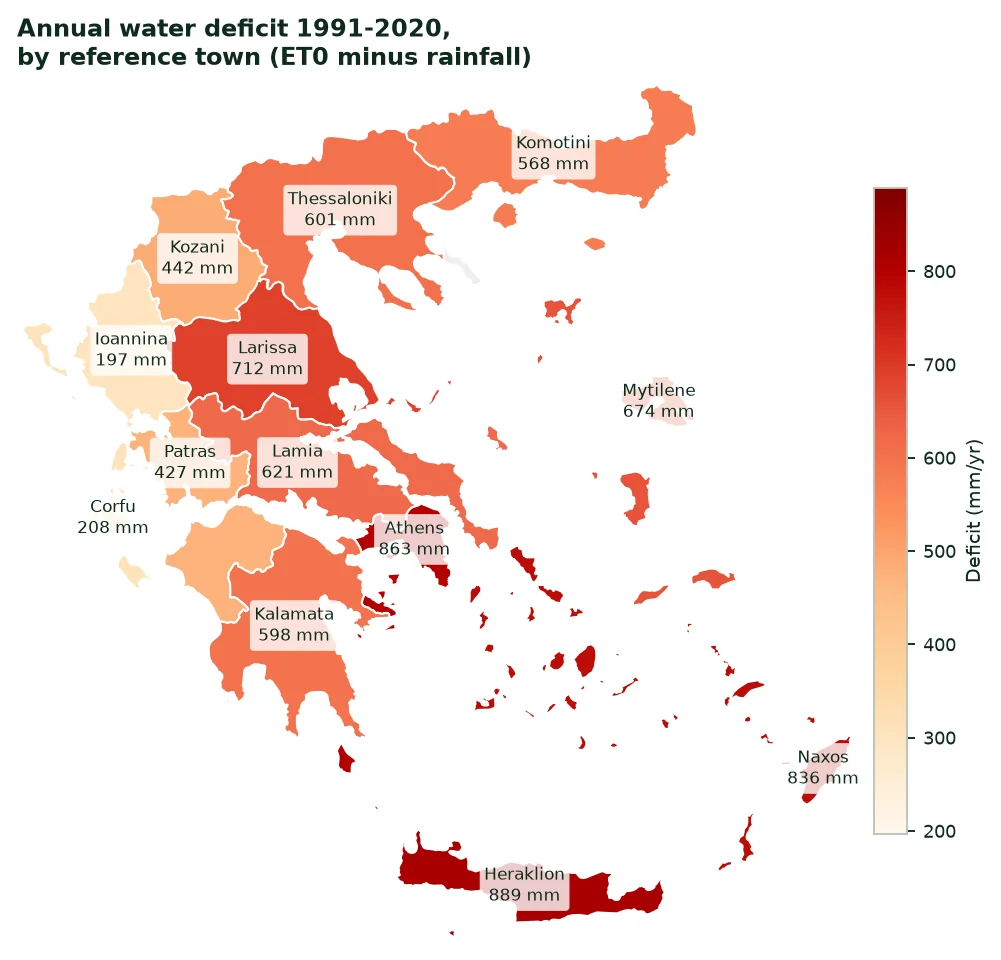
It rains 1,020 mm a year at Corfu, but only 442 mm at Naxos, where reference evapotranspiration reaches 1,278 mm. Rain falls from October to March, heavier in the west (Epirus, Ionian Islands) than in the east and the Cyclades. Summer is hot and dry: It is the season when irrigated crops need water most.
Mean monthly rainfall, 1991-2020 (mm per month)
City | Jan | Feb | Mar | Apr | May | Jun | Jul | Aug | Sep | Oct | Nov | Dec |
|---|---|---|---|---|---|---|---|---|---|---|---|---|
Komotini | 61 | 55 | 52 | 40 | 46 | 36 | 25 | 17 | 37 | 56 | 71 | 78 |
Thessaloniki | 43 | 38 | 44 | 39 | 45 | 34 | 26 | 22 | 41 | 49 | 49 | 59 |
Kozani | 43 | 41 | 44 | 44 | 49 | 37 | 29 | 27 | 44 | 54 | 55 | 59 |
Ioannina | 104 | 97 | 80 | 56 | 41 | 22 | 14 | 23 | 73 | 98 | 143 | 151 |
Larissa | 47 | 42 | 47 | 35 | 38 | 25 | 24 | 21 | 38 | 53 | 53 | 56 |
Lamia | 58 | 50 | 55 | 37 | 34 | 21 | 23 | 21 | 36 | 57 | 64 | 63 |
Patras | 93 | 76 | 65 | 38 | 28 | 20 | 14 | 16 | 43 | 70 | 109 | 111 |
Corfu | 116 | 107 | 95 | 62 | 43 | 28 | 18 | 31 | 80 | 116 | 162 | 162 |
Athens | 62 | 53 | 55 | 31 | 21 | 15 | 11 | 8 | 23 | 44 | 73 | 81 |
Kalamata | 99 | 77 | 59 | 34 | 22 | 21 | 10 | 10 | 47 | 61 | 106 | 114 |
Heraklion | 94 | 76 | 49 | 23 | 15 | 5 | 2 | 4 | 17 | 47 | 64 | 93 |
Naxos | 83 | 73 | 47 | 24 | 16 | 4 | 1 | 1 | 14 | 39 | 61 | 79 |
Mytilene | 99 | 89 | 63 | 46 | 24 | 14 | 4 | 2 | 18 | 50 | 77 | 107 |
Source: NASA POWER (A9); author's calculation.
 |  |
|---|
3.3 Climate change
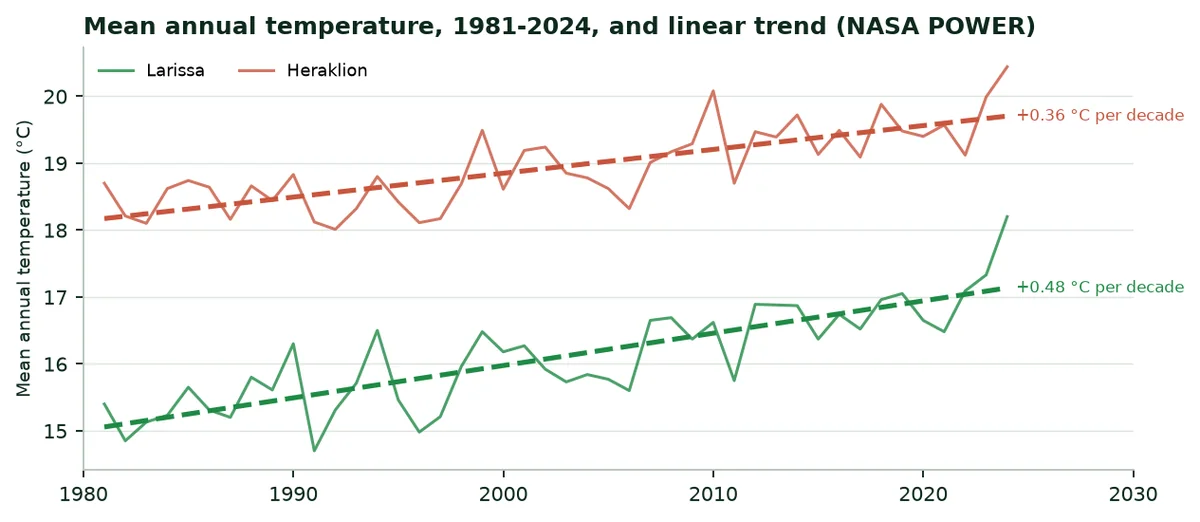
Mean annual temperature is rising. At Larissa it went from 15.4 °C in 1981 to 18.2 °C in 2024, a trend of 0.48 °C per decade. At Heraklion the trend is 0.36 °C per decade, from 18.7 °C to 20.4 °C. Warmer air dries the soil faster between two rains.
4. Water: Resources, irrigated areas, withdrawals
4.1 Resources and withdrawals
Total freshwater withdrawals are 10,047 million m³ a year (2022). Agriculture withdraws 80.5% of it, that is 8,085 Mm³. Internal resources are 58.0 km³ a year and water stress is 20.3%: The country has water, but little of it is mobilised for crops.
Freshwater: Withdrawals and resources
Indicator | Value | Year | Source |
|---|---|---|---|
Total withdrawals | 10,047 Mm³ | 2022 | World Bank (A1) |
Agricultural share | 80.5% | 2022 | World Bank (A1) |
Agricultural withdrawals | 8,085.3 Mm³ | 2022 | Calculated from A1 |
Area equipped for irrigation | 2,001,000 ha | 2024 | FAOSTAT (A6) |
Agricultural withdrawals per equipped hectare | 4,041 m³/ha | — | Calculation (Annex B) |
Water stress | 20.3% | 2022 | World Bank (A1) |
4.2 Irrigated areas
FAOSTAT counts 2,001,000 hectares equipped for irrigation in 2024. FAOSTAT gives 2,001,000 ha equipped for irrigation, a figure unchanged for several years, and 1,175,870 ha actually irrigated in 2024 (A6). Irrigation dominates on the plains of Thessaly, Macedonia and Thrace (cotton, maize, rice, fruit) and in Crete (greenhouse vegetables, olives).
4.3 What the water saving represents
In the central scenario, the saving is 906.0 million m³ a year, or 11.2% of agricultural withdrawals. At 4,041 m³ per equipped hectare, this water would irrigate about 224,226 more hectares, or 11.2% of today's equipped area.
5. Fertilisers: Quantities, purchases, spending
5.1 Quantities used
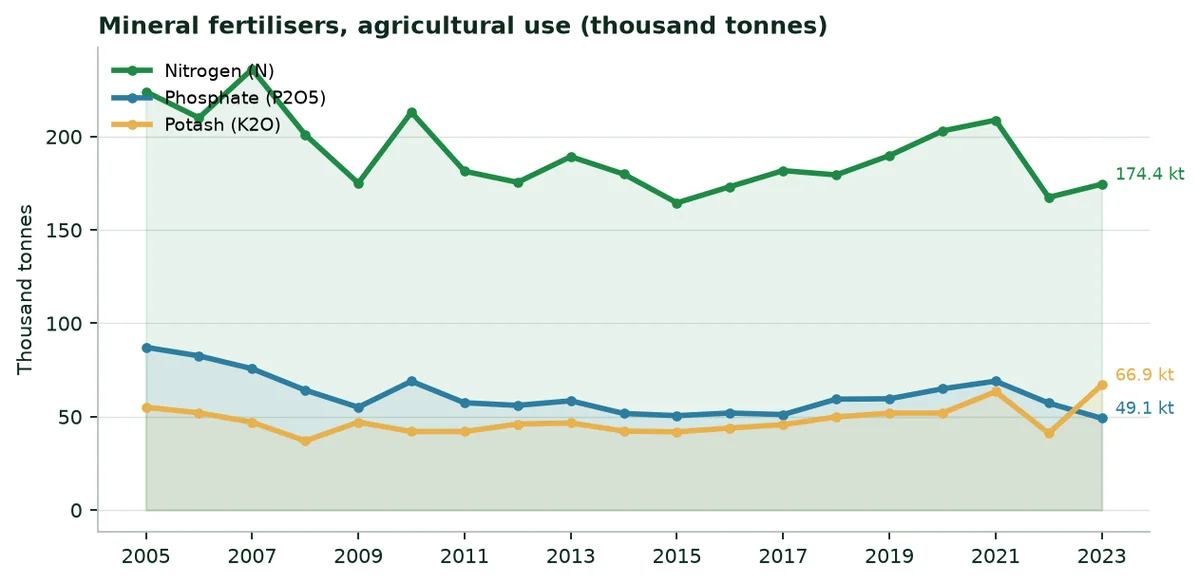
In 2024, agricultural use reaches 195,817 tonnes of nitrogen, 59,864 tonnes of phosphate (P2O5) and 86,724 tonnes of potash (K2O). The country produces no nitrogen fertiliser: It imported 222,370 tonnes of nitrogen in the same year. Per hectare of arable land, use is 186.6 kg per hectare.
5.2 Regulatory framework
A fertilising product can be sold in Greece under the national regime or with CE marking under Regulation (EU) 2019/1009. For water-retention polymers, Delegated Regulation (EU) 2024/2770 sets biodegradability criteria applicable from 17 October 2028 (A13).
5.3 Indicative spending
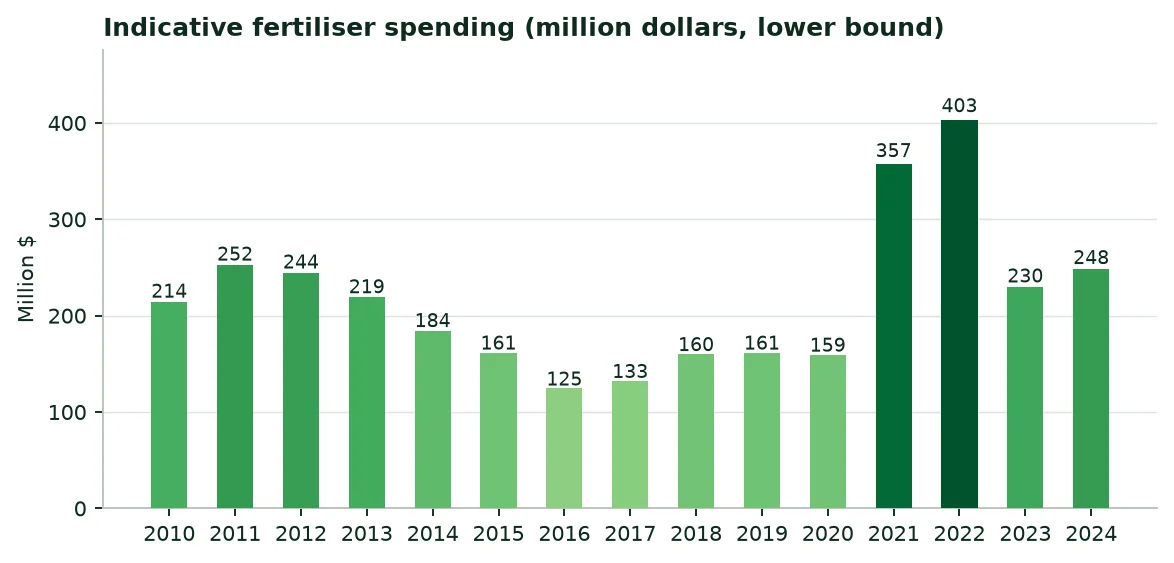
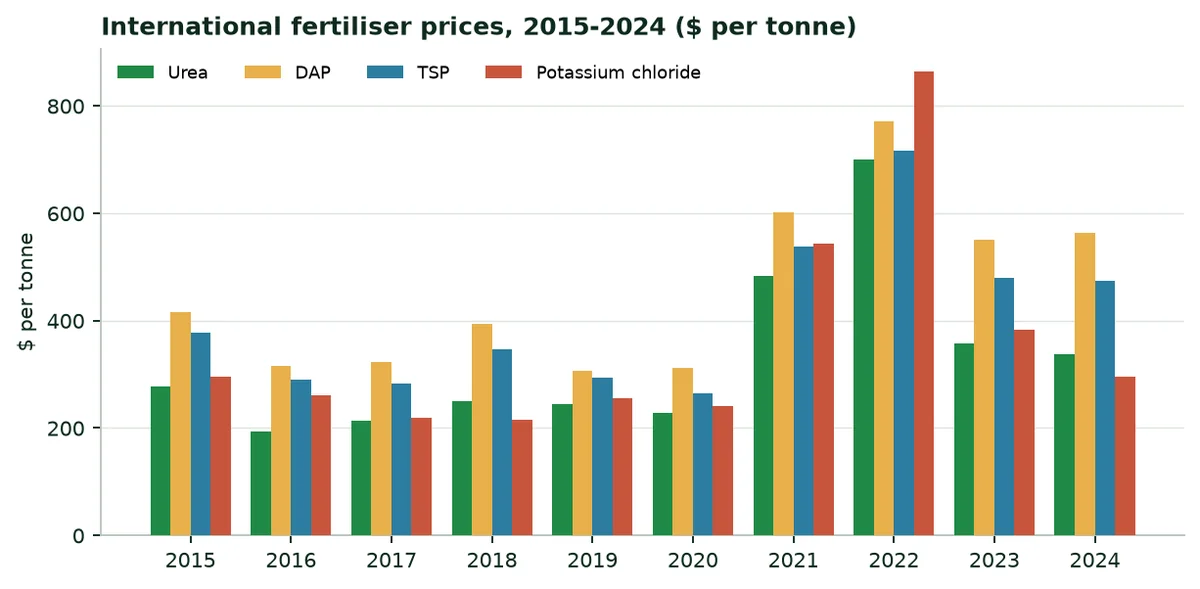
In 2024, the indicative minimum spending on mineral fertilisers reaches $248 million, at international fertiliser prices (calculation in Annex B, lower bound).
6. The regions at a glance
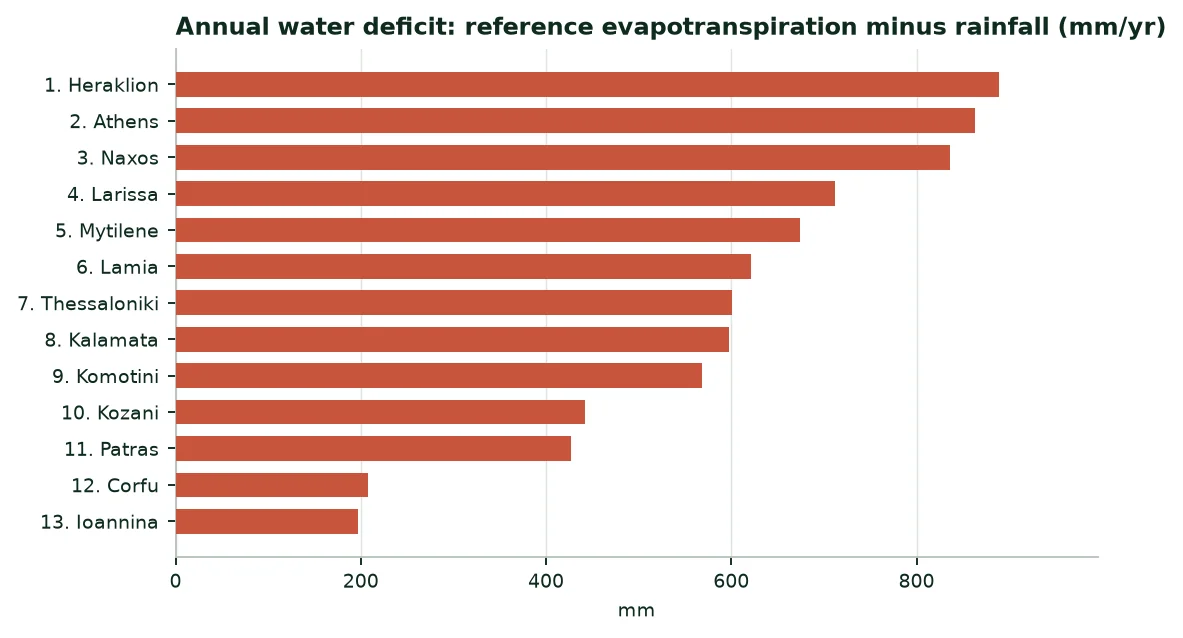
The table compares the thirteen regions, each represented by a reference town. Mount Athos, an autonomous region, is not studied. Climate figures are 1991-2020 averages, except radiation (2005-2020).
Climate of the capitals, 1991-2020 means
Region (city) | Rainfall (mm/yr) | ET0 (mm/yr) | Deficit (mm/yr) | Radiation (kWh/m²/yr) | Temperature (°C) |
|---|---|---|---|---|---|
East Macedonia and Thrace (Komotini) | 574 | 1,142 | 568 | 1,650 | 14.7 |
Central Macedonia (Thessaloniki) | 489 | 1,090 | 601 | 1,646 | 15.0 |
Western Macedonia (Kozani) | 526 | 968 | 442 | 1,584 | 11.7 |
Epirus (Ioannina) | 902 | 1,099 | 197 | 1,600 | 15.0 |
Thessaly (Larissa) | 478 | 1,190 | 712 | 1,671 | 16.1 |
Central Greece (Lamia) | 518 | 1,139 | 621 | 1,673 | 14.9 |
Western Greece (Patras) | 684 | 1,111 | 427 | 1,770 | 14.1 |
Ionian Islands (Corfu) | 1,020 | 1,228 | 208 | 1,699 | 18.0 |
Attica (Athens) | 477 | 1,340 | 863 | 1,832 | 17.6 |
Peloponnese (Kalamata) | 660 | 1,258 | 598 | 1,810 | 17.9 |
Crete (Heraklion) | 488 | 1,377 | 889 | 1,875 | 18.9 |
South Aegean (Naxos) | 442 | 1,278 | 836 | 1,882 | 18.5 |
North Aegean (Mytilene) | 593 | 1,267 | 674 | 1,781 | 17.1 |
Source: NASA POWER (A9); PVGIS (A8); author's calculation.
7. The twenty main crops: Three rankings
7.1 By harvested area
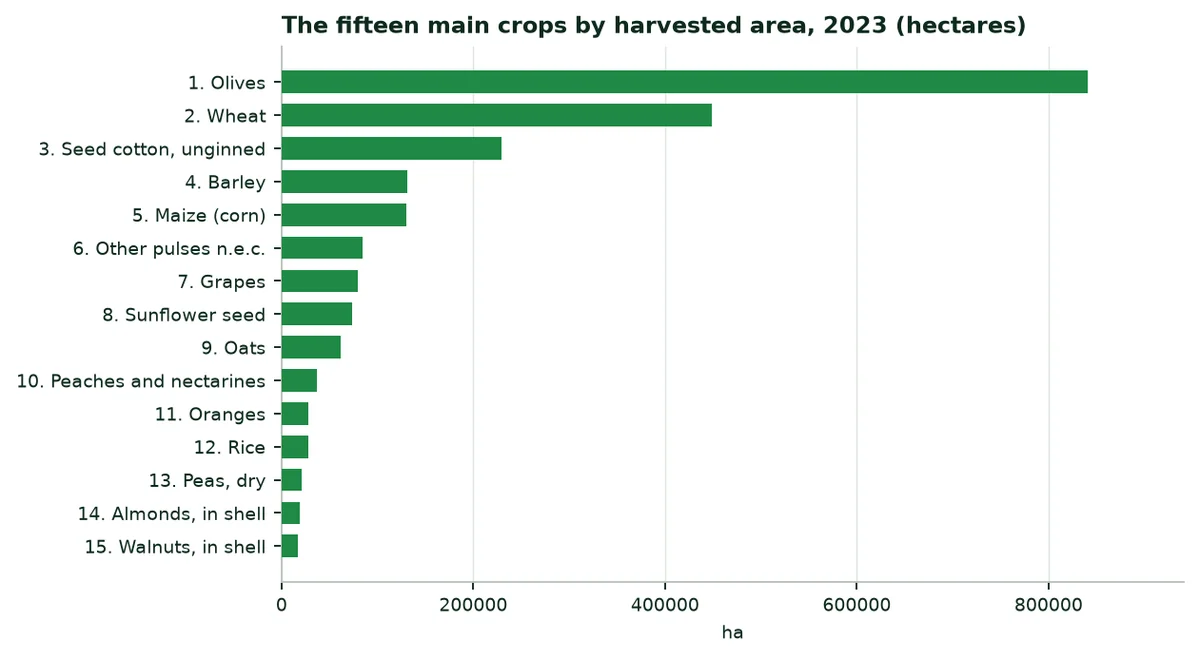
The ten main crops by area, 2023
Crop | Harvested area (ha) | Production (t) | Yield (t/ha) |
|---|---|---|---|
Olives | 840,620 | 2,498,942 | 2.97 |
Wheat | 448,460 | 1,309,180 | 2.92 |
Seed cotton, unginned | 229,805 | 699,069 | 3.04 |
Barley | 130,780 | 362,520 | 2.77 |
Maize (corn) | 130,560 | 1,416,690 | 10.85 |
Other pulses n.e.c. | 84,870 | 103,870 | 1.22 |
Grapes | 79,420 | 564,210 | 7.10 |
Sunflower seed | 73,510 | 157,190 | 2.14 |
Oats | 61,650 | 69,190 | 1.12 |
Peaches and nectarines | 37,040 | 574,780 | 15.52 |
Source: FAOSTAT (A2).
7.2 By production
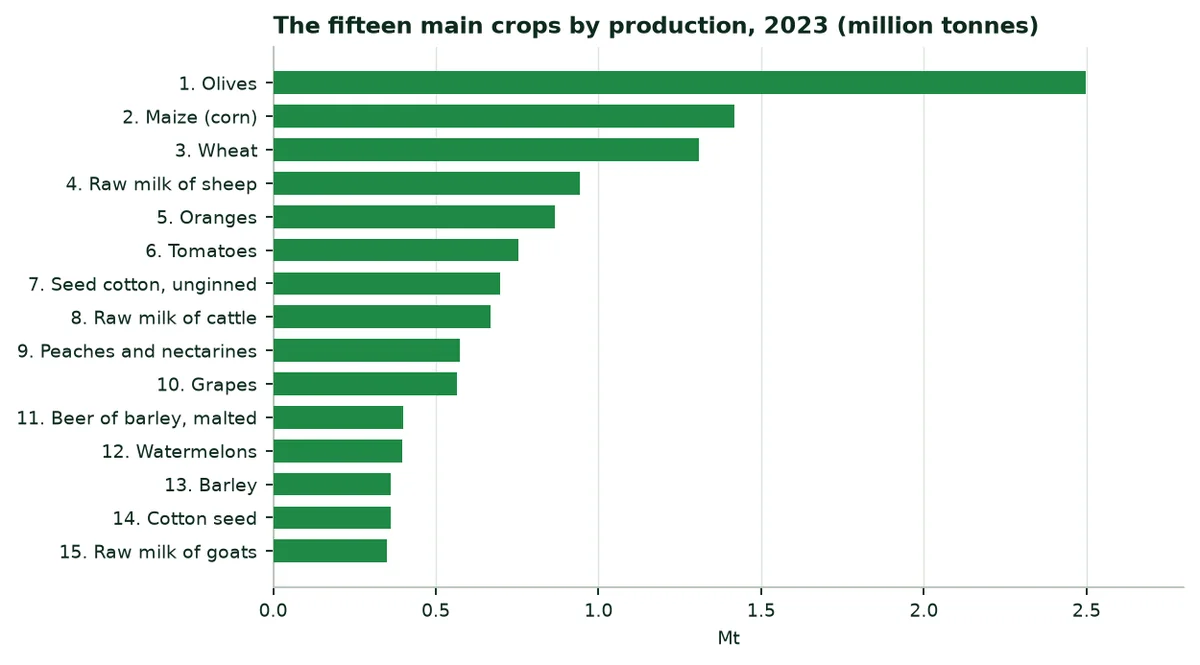
7.3 By production value
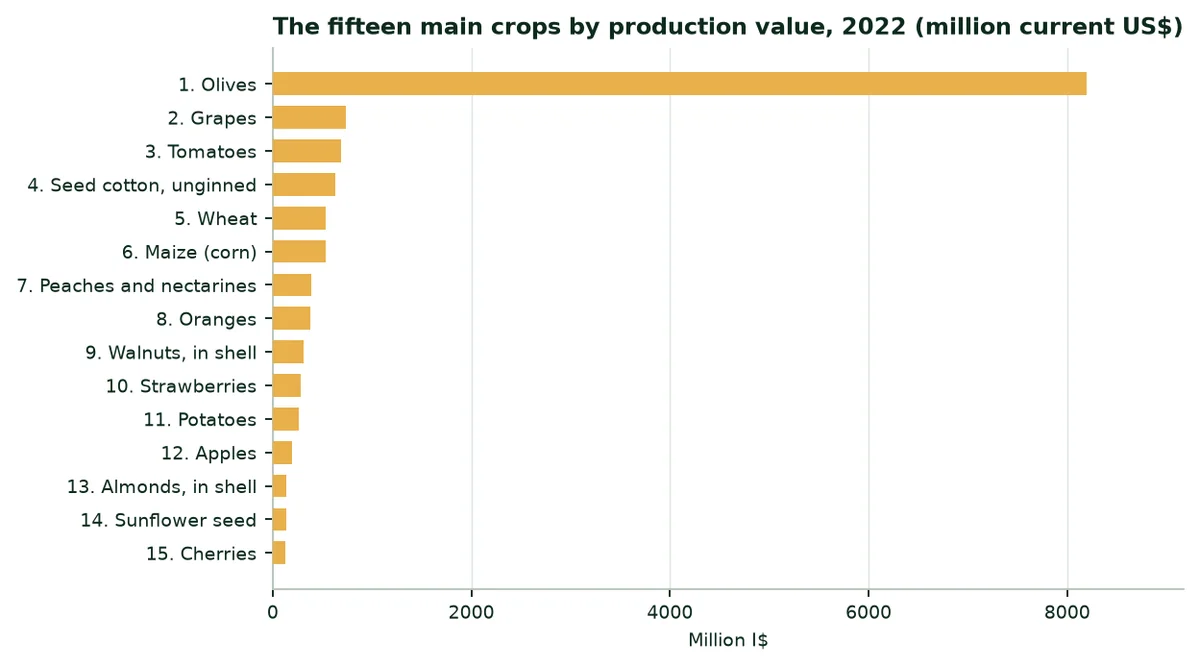
By production value, the three main crops are: Olives, grapes and tomatoes (FAOSTAT, 2022, current US dollars).
8. Extrapolation by crop: Irrigation and rainfed crops
8.1 Method
8.2 Trials used as analogues
Trials cited and their use in the calculation
Trial | Crop | Water | Yield | Use in the calculation |
|---|---|---|---|---|
Maize, Türkiye (TIGEM, Konya, 2025) | Maize | -38.9% | +17.1% | Maize: Water and yield |
Soybean, China | Soybean | Assumption | +11.3% | Not used; cited for reference |
Watermelon, Mexico (2023) | Watermelon | -60.5% | +30.0% | Vegetables and melons: Water and yield |
Potato, South Africa (2025) | Potato | -52.0% | +31.4% | Potato: Water and yield |
Date palm, UAE (ICBA, 2021) | Palm | -82.0% | +20.0% | Not used; cited for reference |
Source: A14 to A18 (published trials and manufacturer's website, levels B and C).
No trial has yet been conducted in Greece: The figures below apply the trials cited to the country's average yields.
8.3 Irrigation: Vegetables and melons, Potato, Maize and Cotton
Equipped area assigned, trial used and water saved (central scenario)
Crop group | Equipped area (ha) | Share | Trial or assumption | Water saved (Mm³/yr) |
|---|---|---|---|---|
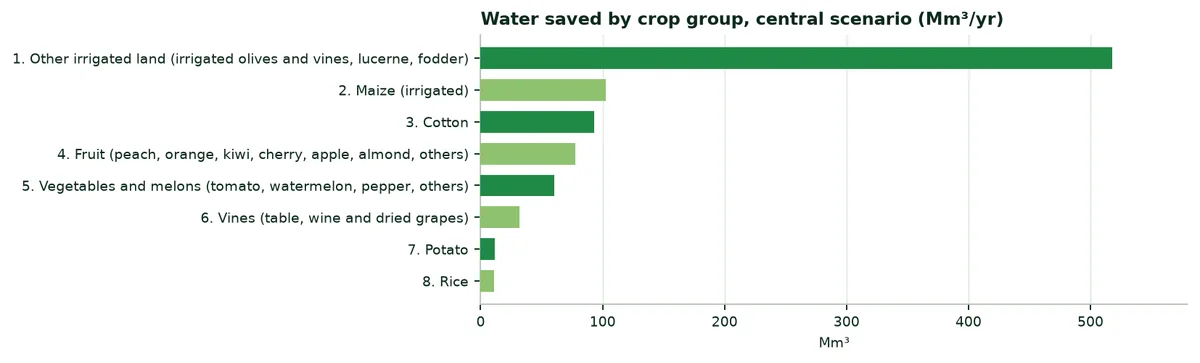
Vegetables and melons (tomato, watermelon, pepper, others) | 49,230 | 2.5% | Watermelon, Mexico (2023) | 60.2 |
Potato | 10,960 | 0.5% | Potato, South Africa (2025) | 11.5 |
Maize (irrigated) | 130,560 | 6.5% | Maize, Türkiye (TIGEM, 2025) | 102.9 |
Cotton | 229,805 | 11.5% | Generic assumption, no trial | 92.9 |
Rice | 27,600 | 1.4% | Generic assumption, no trial | 11.2 |
Fruit (peach, orange, kiwi, cherry, apple, almond, others) | 191,790 | 9.6% | Generic assumption, no trial | 77.5 |
Vines (table, wine and dried grapes) | 79,420 | 4.0% | Generic assumption, no trial | 32.1 |
Other irrigated land (irrigated olives and vines, lucerne, fodder) | 1,281,635 | 64.0% | Generic assumption, no trial | 517.9 |
Source: Author's calculation (Annex B).
Water saved, extra irrigable hectares and production gain, by scenario
Scenario | Water (Mm³/yr) | Extra hectares | Production (t/yr) |
|---|---|---|---|
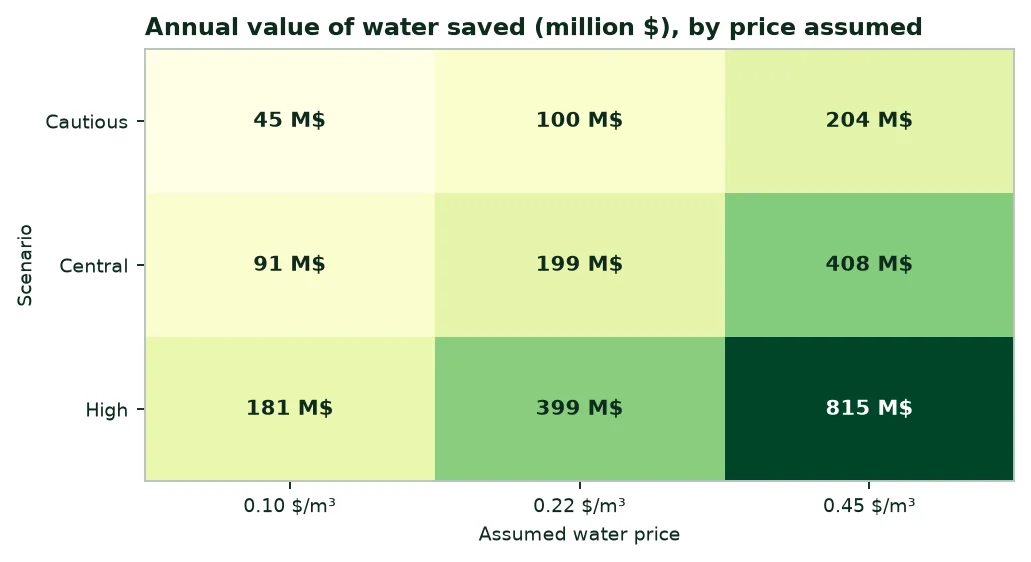
Cautious | 453.0 | 112,113 | 233,241 |
Central | 906.0 | 224,226 | 466,482 |
High | 1,812.0 | 448,452 | 932,964 |
Source: Author's calculation (Annex B).
8.4 Reading the results
9. Potential benefits of our products
The table lists what the products may bring according to the documents available, with their confidence level and their limit.
Potential benefits, by situation
Benefit | Published figures | Source (level) | Limit |
|---|---|---|---|
Irrigation water saving | Date palm −82%; watermelon −60.5%; potato −52%; maize −38.9% | A14 to A18 (B, C) | One trial per crop; none in Greece |
Yield | Maize +17.1%; potato +31.4%; watermelon +30%; date palm +20%; soybean +11.2 to +11.4% | A14 to A18 (B, C) | Trials conducted under irrigation or in other climates |
Organic farming (ECOFERT®) | Certified by SOHISCERT and EU Bio | A21 (A) | Valid for the certified product |
Safety: Acrylamide (ECOSORB®) | Below 3.0 µg/g | A19 (B) | One laboratory, one date |
REACH compliance (EVERGREEN®) | ≤ 0.1% of substances of very high concern in 233 substances tested | A20 (B) | Screening, not an approval |
Agroforestry (Paulownia ALTIFOLIA®) | 13 to 15 m in 6 to 8 years (website) | A22 (C) | No trial in Greece |
Source: Annex A.
10. External trade: Exports, imports, importing
10.1 Overview, 2023 and 2024
Agricultural products and total merchandise trade (million $)
Indicator | 2023 | 2024 |
|---|---|---|
Agricultural exports (crops and livestock) | 10,248 | 10,625 |
Agricultural imports (crops and livestock) | 9,953 | 10,835 |
Exports, all merchandise | 55,047 | 53,988 |
Imports, all merchandise | 88,617 | 91,428 |
Source: FAOSTAT (A4).
10.2 Exports
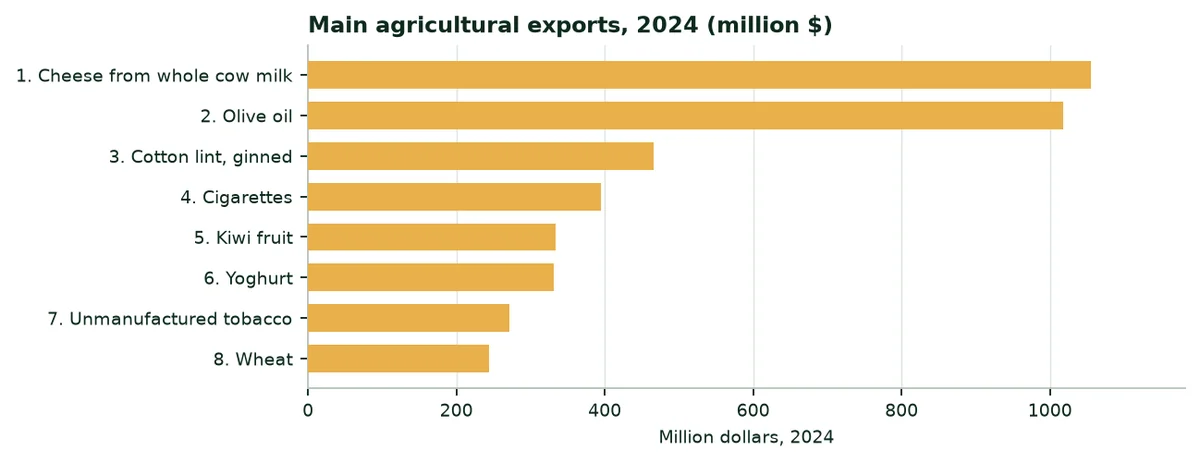
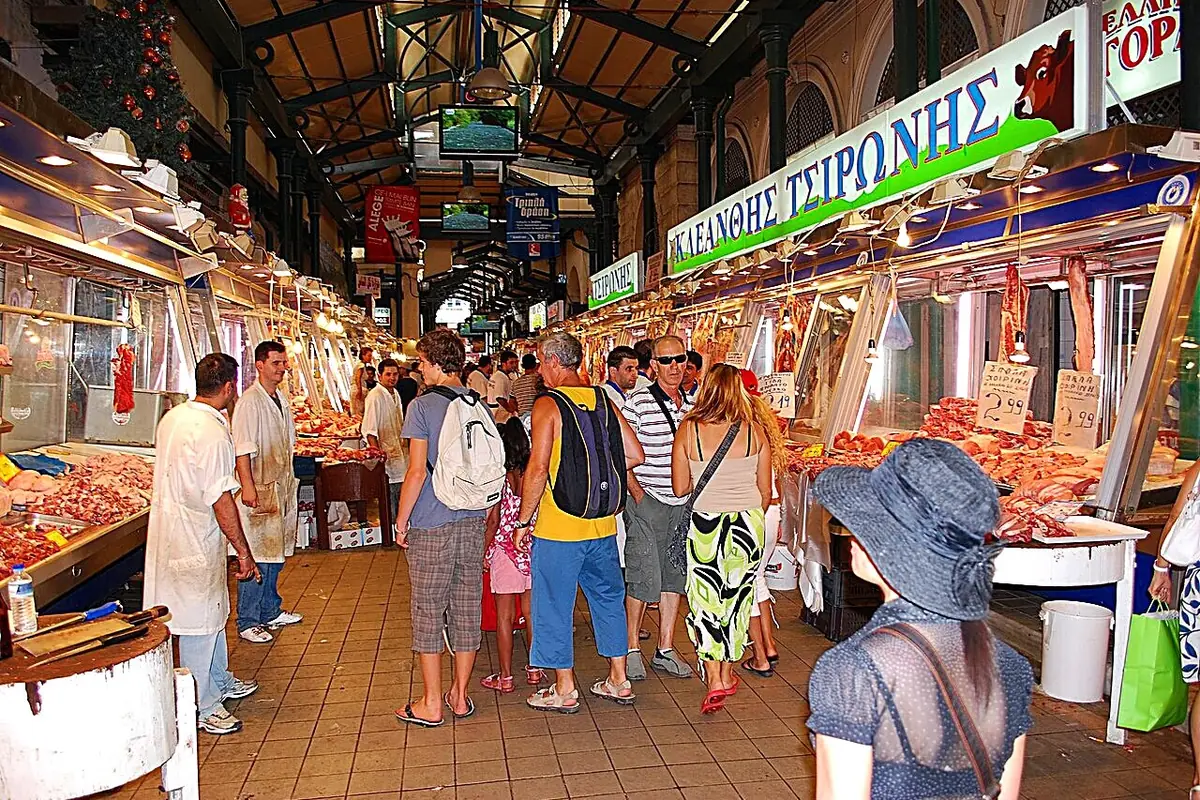
The three main farm products exported in 2024 are: Cheese from whole cow milk ($1,055 million), olive oil ($1,018 million) and cotton lint, ginned ($466 million).
10.3 Imports
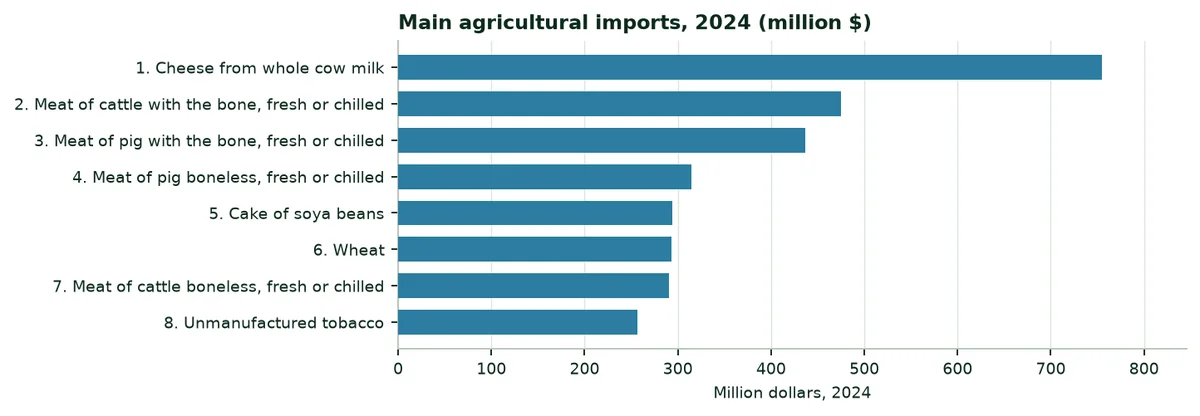
The main farm purchases are: Cheese from whole cow milk ($755 million), meat of cattle with the bone, fresh or chilled ($475 million) and meat of pig with the bone, fresh or chilled ($437 million).
 |  |
|---|
10.4 Importing water-retention polymers into Greece
11. A study of each region
Each region is described through the city that represents it. The figures describe the climate; the water deficit (evapotranspiration minus rainfall) shows where water is most short. The description of crops is qualitative.
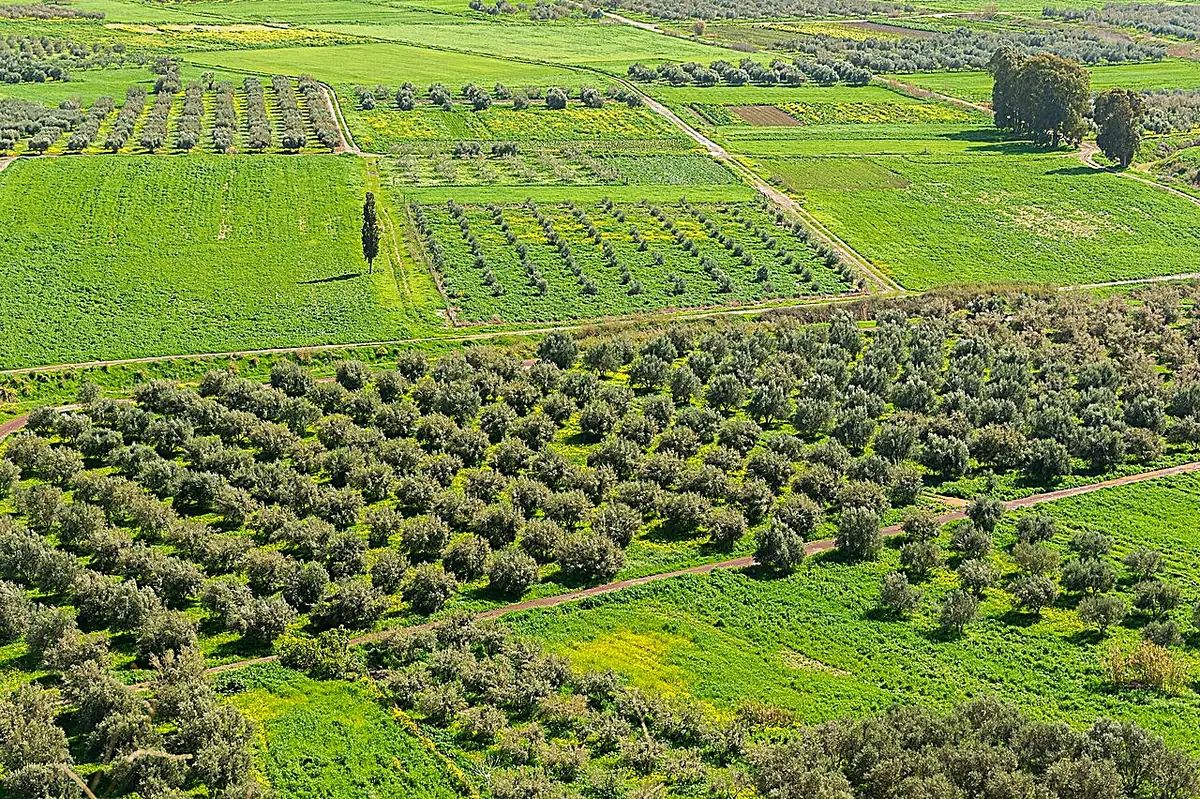
East Macedonia and Thrace (Komotini)
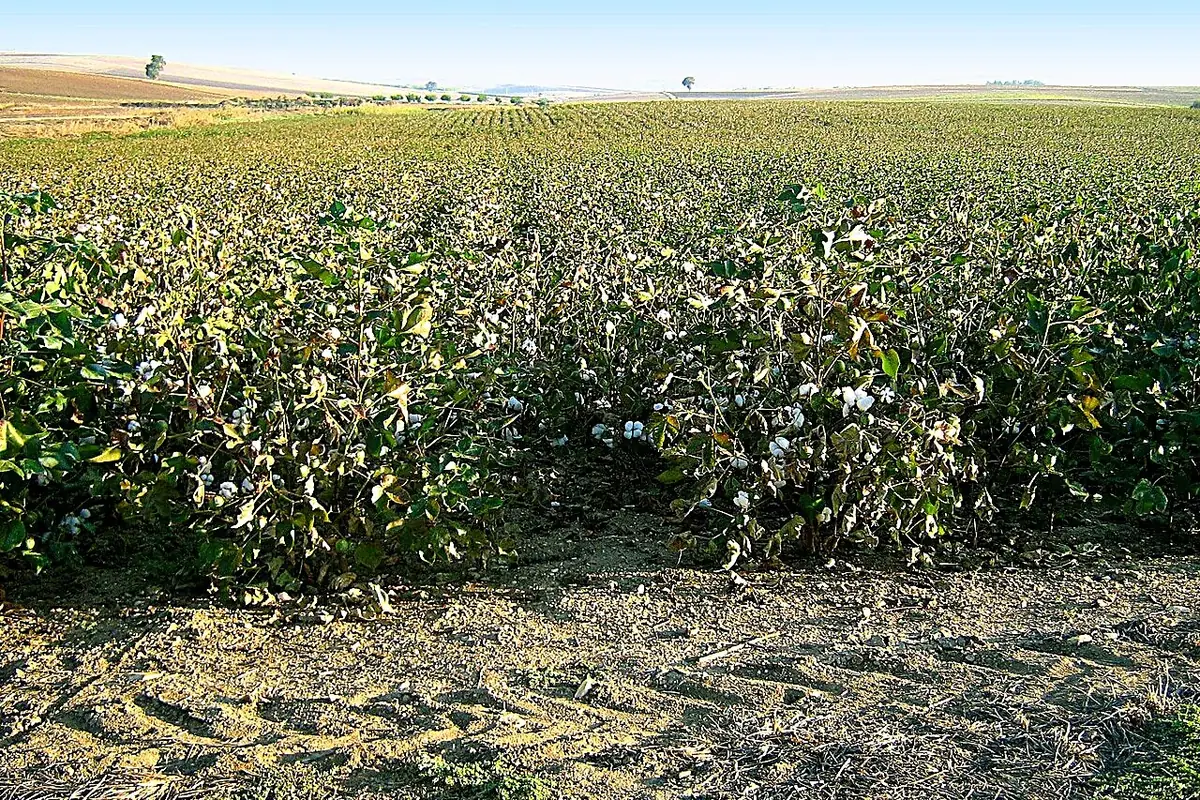
East Macedonia and Thrace: Cotton, wheat, maize, tobacco and sunflower on the irrigated plains of Thrace, sheep farming.
Indicator | Value |
|---|---|
Annual rainfall, 1991-2020 | 574 mm |
Reference evapotranspiration | 1,142 mm |
Annual water deficit | 568 mm |
Months with less than 50 mm of rain | 6 |
Global solar radiation | 1,650 kWh/m² |
Mean temperature | 14.7 °C |
Source: NASA POWER (A9); PVGIS (A8); author's calculation.
Central Macedonia (Thessaloniki)
Central Macedonia: Rice of the Axios delta, cotton, maize, peaches and kiwi of the Giannitsa plain.
Indicator | Value |
|---|---|
Annual rainfall, 1991-2020 | 489 mm |
Reference evapotranspiration | 1,090 mm |
Annual water deficit | 601 mm |
Months with less than 50 mm of rain | 11 |
Global solar radiation | 1,646 kWh/m² |
Mean temperature | 15.0 °C |
Source: NASA POWER (A9); PVGIS (A8); author's calculation.
Western Macedonia (Kozani)
Western Macedonia: Cereals, saffron, apples and vines on cooler plateaus.
Indicator | Value |
|---|---|
Annual rainfall, 1991-2020 | 526 mm |
Reference evapotranspiration | 968 mm |
Annual water deficit | 442 mm |
Months with less than 50 mm of rain | 9 |
Global solar radiation | 1,584 kWh/m² |
Mean temperature | 11.7 °C |
Source: NASA POWER (A9); PVGIS (A8); author's calculation.
Epirus (Ioannina)
Epirus: Livestock, meadows and citrus of the Arta plain, under the country's highest rainfall.
Indicator | Value |
|---|---|
Annual rainfall, 1991-2020 | 902 mm |
Reference evapotranspiration | 1,099 mm |
Annual water deficit | 197 mm |
Months with less than 50 mm of rain | 4 |
Global solar radiation | 1,600 kWh/m² |
Mean temperature | 15.0 °C |
Source: NASA POWER (A9); PVGIS (A8); author's calculation.
Thessaly (Larissa)
Thessaly, the largest plain: Irrigated cotton, wheat, maize and lucerne; flooded by Storm Daniel in 2023.
Indicator | Value |
|---|---|
Annual rainfall, 1991-2020 | 478 mm |
Reference evapotranspiration | 1,190 mm |
Annual water deficit | 712 mm |
Months with less than 50 mm of rain | 9 |
Global solar radiation | 1,671 kWh/m² |
Mean temperature | 16.1 °C |
Source: NASA POWER (A9); PVGIS (A8); author's calculation.
Central Greece (Lamia)
Central Greece: Cotton, cereals and olives in the Sperchios and Boeotia valleys.
Indicator | Value |
|---|---|
Annual rainfall, 1991-2020 | 518 mm |
Reference evapotranspiration | 1,139 mm |
Annual water deficit | 621 mm |
Months with less than 50 mm of rain | 7 |
Global solar radiation | 1,673 kWh/m² |
Mean temperature | 14.9 °C |
Source: NASA POWER (A9); PVGIS (A8); author's calculation.
Western Greece (Patras)
Western Greece: Olives, currants, citrus and vegetables of Achaea, Elis and Aetolia-Acarnania.
Indicator | Value |
|---|---|
Annual rainfall, 1991-2020 | 684 mm |
Reference evapotranspiration | 1,111 mm |
Annual water deficit | 427 mm |
Months with less than 50 mm of rain | 6 |
Global solar radiation | 1,770 kWh/m² |
Mean temperature | 14.1 °C |
Source: NASA POWER (A9); PVGIS (A8); author's calculation.
Ionian Islands (Corfu)
Ionian Islands: Ancient olive groves and vines, on islands that are wet in winter.
Indicator | Value |
|---|---|
Annual rainfall, 1991-2020 | 1,020 mm |
Reference evapotranspiration | 1,228 mm |
Annual water deficit | 208 mm |
Months with less than 50 mm of rain | 4 |
Global solar radiation | 1,699 kWh/m² |
Mean temperature | 18.0 °C |
Source: NASA POWER (A9); PVGIS (A8); author's calculation.
Attica (Athens)
Attica: Vines, olives, Aegina pistachios and vegetables around the city.
Indicator | Value |
|---|---|
Annual rainfall, 1991-2020 | 477 mm |
Reference evapotranspiration | 1,340 mm |
Annual water deficit | 863 mm |
Months with less than 50 mm of rain | 7 |
Global solar radiation | 1,832 kWh/m² |
Mean temperature | 17.6 °C |
Source: NASA POWER (A9); PVGIS (A8); author's calculation.
Peloponnese (Kalamata)
Peloponnese: Kalamata olives, Argolis oranges, Nemea vines and raisins.
Indicator | Value |
|---|---|
Annual rainfall, 1991-2020 | 660 mm |
Reference evapotranspiration | 1,258 mm |
Annual water deficit | 598 mm |
Months with less than 50 mm of rain | 6 |
Global solar radiation | 1,810 kWh/m² |
Mean temperature | 17.9 °C |
Source: NASA POWER (A9); PVGIS (A8); author's calculation.
Crete (Heraklion)
Crete: Olives, vines, and greenhouse vegetables in Ierapetra and the Messara plain.
Indicator | Value |
|---|---|
Annual rainfall, 1991-2020 | 488 mm |
Reference evapotranspiration | 1,377 mm |
Annual water deficit | 889 mm |
Months with less than 50 mm of rain | 8 |
Global solar radiation | 1,875 kWh/m² |
Mean temperature | 18.9 °C |
Source: NASA POWER (A9); PVGIS (A8); author's calculation.
South Aegean (Naxos)
South Aegean: Naxos potatoes, Santorini vines and goats, on dry islands.
Indicator | Value |
|---|---|
Annual rainfall, 1991-2020 | 442 mm |
Reference evapotranspiration | 1,278 mm |
Annual water deficit | 836 mm |
Months with less than 50 mm of rain | 8 |
Global solar radiation | 1,882 kWh/m² |
Mean temperature | 18.5 °C |
Source: NASA POWER (A9); PVGIS (A8); author's calculation.
North Aegean (Mytilene)
North Aegean: Olives of Lesbos, mastic of Chios and sheep.
Indicator | Value |
|---|---|
Annual rainfall, 1991-2020 | 593 mm |
Reference evapotranspiration | 1,267 mm |
Annual water deficit | 674 mm |
Months with less than 50 mm of rain | 6 |
Global solar radiation | 1,781 kWh/m² |
Mean temperature | 17.1 °C |
Source: NASA POWER (A9); PVGIS (A8); author's calculation.
Annex A. Sources and confidence levels
Ref. | Source | Level |
|---|---|---|
A1 | World Bank, World Development Indicators (WDI), Greece | A |
A2 | FAOSTAT, crops and livestock (QCL), areas, production, 2014-2023 | A |
A3 | FAOSTAT, value of production (QV), current US dollars, 2019-2023 | A |
A4 | FAOSTAT, trade in crops and livestock products, 2018-2024 | A |
A5 | FAOSTAT, mineral fertilisers, agricultural use, production and imports, 2005-2023 | A |
A6 | FAOSTAT, land use, areas equipped for irrigation, organic farming | A |
A7 | World Bank, Pink Sheet (world prices of urea, DAP, TSP and potassium chloride) | A |
A8 | PVGIS (European Commission Joint Research Centre), radiation, 2005-2020 | B |
A9 | NASA POWER (NASA Langley Research Center), daily data: Rainfall, temperature, humidity, wind and radiation, 1981-2024; reference evapotranspiration calculated by the author with FAO-56 (Penman-Monteith) | B |
A10 | Natural Earth, first-level administrative boundaries and country outline | B |
A11 | World Bank, WITS (UNCTAD TRAINS database), European Union, applied MFN duties, subheading 3906.90 (seven national lines), 2023 | A |
A12 | PwC, Worldwide Tax Summaries, Greece, other taxes: VAT rates | C |
A13 | Regulation (EU) 2019/1009 on fertilising products (CE marking), and Delegated Regulation (EU) 2024/2770 setting biodegradability criteria for water-retention polymers, applicable from 17 October 2028 | A |
A14 | Soybean trial, China (yield), manufacturer's website | C |
A15 | Date palm trial, UAE (ICBA, 2021), manufacturer's website | B |
A16 | Watermelon trial, Mexico (2023), manufacturer's website | C |
A17 | Potato trial, South Africa (2025), manufacturer's website | C |
A18 | Maize trial, Türkiye (TIGEM, Konya, 2025), manufacturer's website | B |
A19 | ECOSORB® acrylamide analysis (Polymex laboratory, 2024) | B |
A20 | EVERGREEN® REACH / SVHC screening (SGS, 2023) | B |
A21 | ECOFERT® certificate (SOHISCERT, EU Bio) | A |
A22 | Paulownia ALTIFOLIA® sheet figures (website) | C |
Annex B. Calculation method
1. Agricultural water. Total withdrawals (10,047 Mm³, 2022) × agricultural share (80.47%) = 8,085.3 Mm³.
2. Irrigation. The equipped area (2,001,000 ha) and agricultural water are shared between irrigated groups (vegetables and melons, potato, maize, cotton, rice, fruit, vines and other irrigated land) in proportion to their harvested areas (2,001,000 ha), without exceeding each group's harvested area. Our sources have no irrigation statistic by crop. Other crops are treated as rainfed and receive no irrigation water in the calculation. The crop data used are those of 2023: For 2024, FAOSTAT does not yet give the cotton or olive harvest. The equipped area exceeds the harvested area of the irrigable crops retained: The difference forms an "other irrigated land" group (irrigated olives and vines, lucerne, fodder), with the generic assumption. Maize is treated as irrigated, as on the Greek plains. FAOSTAT does not publish Greece's production value by crop in current US dollars: Values are therefore in current US dollars.
3. Scenarios. Water saved = group water × trial effect: A quarter (cautious), half (central), all of it (high). Without a trial: 5, 10 and 20%.
4. Extra hectares. Water saved ÷ water per equipped hectare (4,041 m³/ha).
6. Value of water. Three assumed prices (0.10; 0.22 and 0.45 $/m³); no national tariff was adopted.
7. Fertilisers. Minimum spending = nitrogen ÷ 0.46 × urea price + phosphate ÷ 0.46 × TSP price + potash ÷ 0.60 × potassium chloride price (A7).
8. Climate. Rainfall, reference evapotranspiration (FAO-56) and temperature: 1991-2020 means of the NASA POWER grid cell containing each city; radiation: PVGIS, 2005-2020. Temperature trends are linear regressions over 1981-2024. NASA POWER combines reanalyses and satellite data on a grid of about 50 km: Two nearby cities can share the same cell, and its rainfall can differ from local station records. On the maps, each region is coloured according to the value of its reference town.
9. Trade. Totals are those of the FAOSTAT crops and livestock line; products are listed one by one, without aggregates. Rice amounts add husked rice, broken rice and milled rice.
Annex C. Photo credits
File (Wikimedia Commons) | Author | Licence |
|---|---|---|
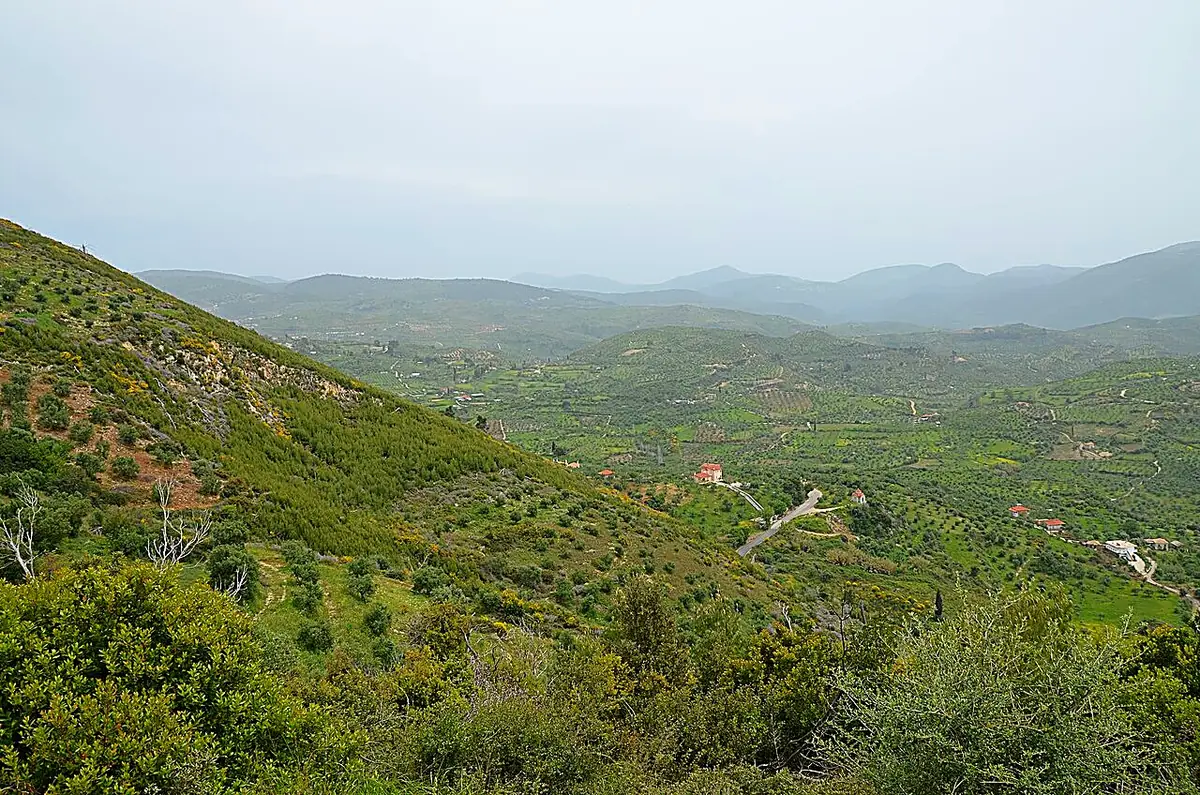
Landscape from Phaistos.jpg | Jebulon | CC0 |
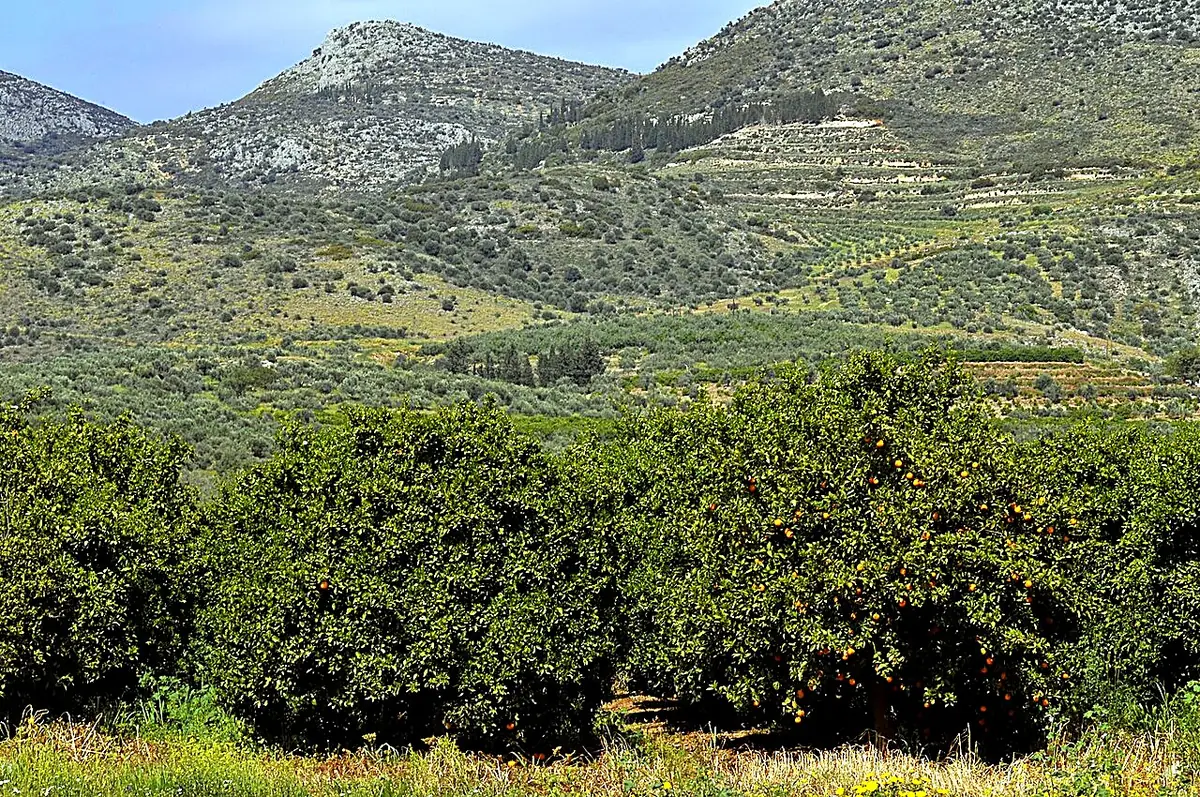
2007 Greece Corinth agriculture.jpg | Nicholas Hartmann | CC BY-SA 4.0 |
Agriculture in the Thessalian Plain.jpg | Αλεξανδρής Αλέξης | CC BY-SA 4.0 |
Arcadian landscape (14136309732).jpg | Carole Raddato from FRANKFURT, Germany | CC BY-SA 2.0 |
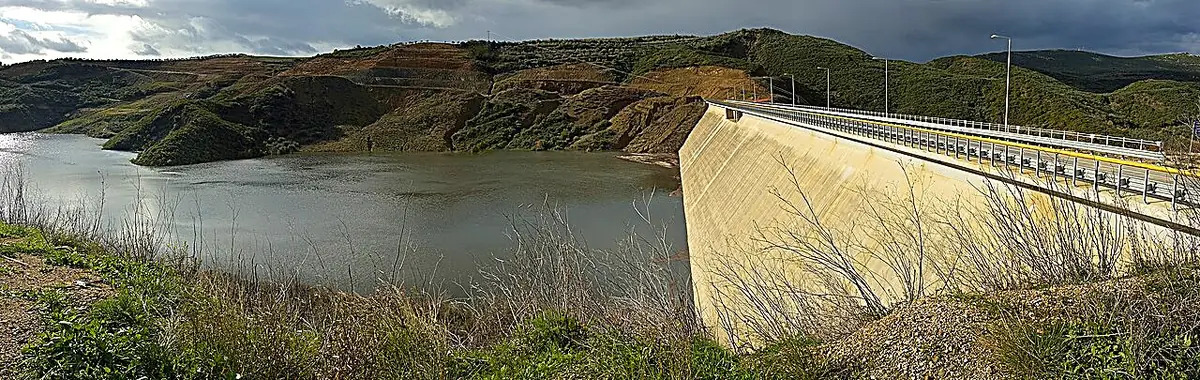
Chistianoupolis' Artificial Lake.jpg | Michalakopoulos Alexis | CC BY-SA 4.0 |
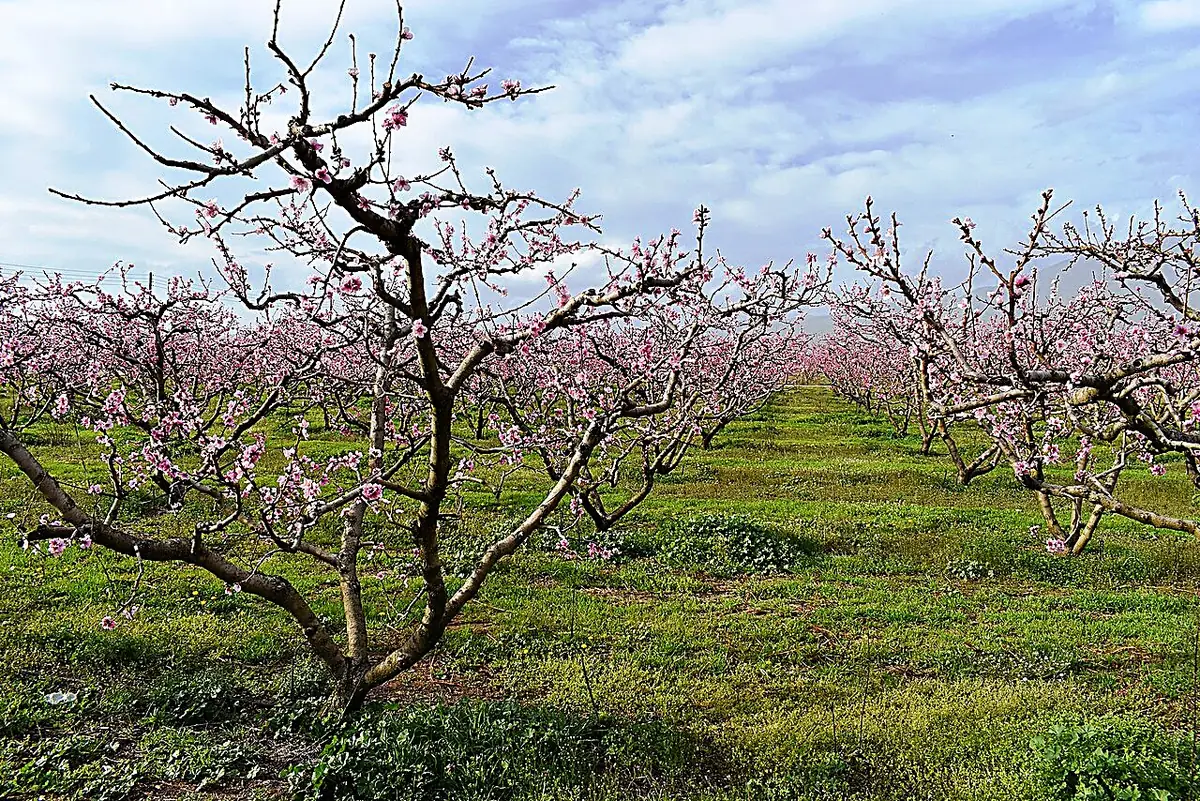
A peach orchard in spring.jpg | Annatsach | CC BY-SA 4.0 |
COTTON PLANTATION (by Socrates) - panoramio.jpg | KARDO.FAMILY | CC BY 3.0 |
Santorini 78.jpg | LBM1948 | CC BY-SA 4.0 |
Micenas, varios 08.jpg | LBM1948 | CC BY-SA 4.0 |
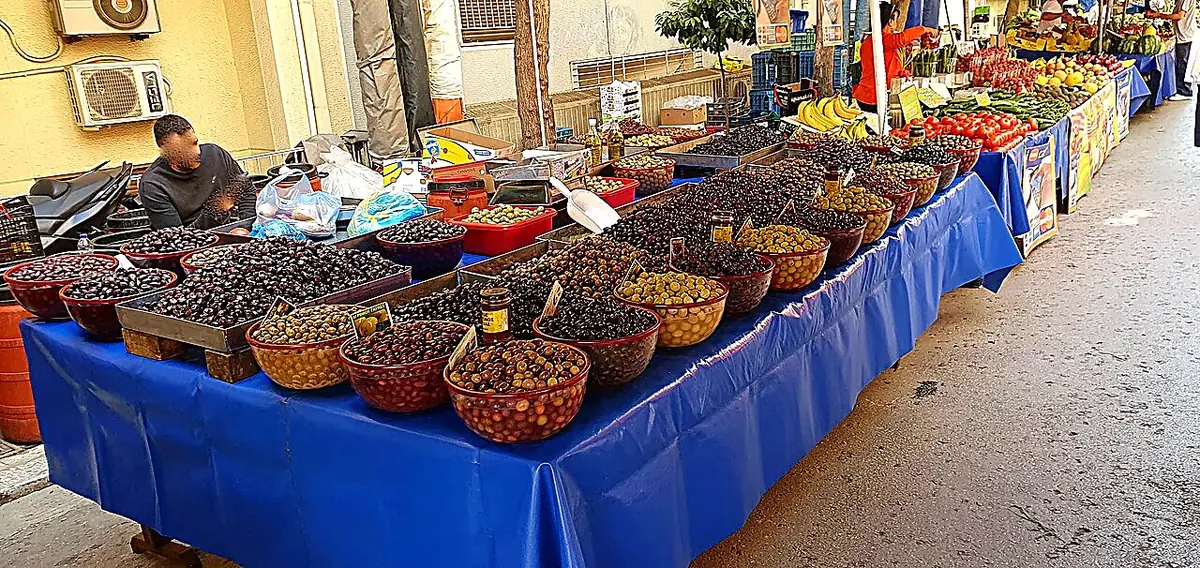
Kolonaki Friday Farmers Market.jpg | Yair-haklai | CC BY-SA 4.0 |
20090801 athina02.jpg | Jeanhousen | CC BY 3.0 |
Fields Messara plain from Phaistos Crete Greece.jpg | Jebulon | CC0 |
Olive-Harvest-Sitia-Lasithi-Crete-Greece.jpg | Petro Stelte | CC BY-SA 4.0 |
Source: Photos published on Wikimedia Commons, colour-adjusted and sharpened, used under their licence.
Πείτε μας για το χωράφι σας
Καλλιέργεια, μέθοδος άρδευσης, τύπος εδάφους, όγκος νερού που χρησιμοποιείτε σήμερα. Επιστρέφουμε με τον κατάλληλο συνδυασμό τεχνολογιών, τις δόσεις και τις δοκιμές που έχουν ήδη γίνει σε παρόμοιες συνθήκες.
Μια πρώτη συζήτηση δεν σας δεσμεύει σε τίποτα.
Πείτε μας για το χωράφι σαςcontact@green-solutions-group.com · Green Solutions Groupe AIM SA, 46, route de la Condémine, 1475 Forel, Ελβετία
Φωτογραφικές πιστώσεις
- Neptuul — CC BY-SA 4.0, « Lavandula fields »
- Bogdan Giuşcă — CC BY-SA 2.5, « Corfu olive grove bgiu »
- Freideriki Dionysopoulou — CC BY-SA 3.0, « 10. Rainbow in olive grove »
- Alastair Rae from London, United Kingdom — CC BY-SA 2.0, « Olive Grove (158100468) »
- vitsoft — CC BY 3.0, « Olive grove - panoramio »
- Jimzoun — CC BY-SA 4.0, « Keri Peninsula with olive groves and view into Keri Bay »
- macrolepis — CC BY 3.0, « Olive grove with grazing sheep - panoramio »
- Paul Lakin — CC BY 3.0, « Olive grove, Amoudi IMG 6928 - panoramio »
Φωτογραφίες από το Wikimedia Commons, σύμφωνα με τις άδειές τους.