ملف سوق
المملكة الأردنية الهاشمية
المملكة الأردنية الهاشمية
خضار الأغوار وزيتون المرتفعات تحت ندرة مائية هيكلية.
ما الذي يغيّره الاحتفاظ بالماء في التربة على مستوى الحقل.
Foreword
This dossier describes Jordan from the angle of water, climate, fertilisers and crops. It is written for the ministries in charge of agriculture, water and trade, the regional directorates of agriculture, cooperatives and producer organisations. It answers three questions: Where is water short, for which crops, and in which regions? It then examines what our products can change, in rainfed as well as irrigated farming, and what that can mean for the country's external trade.
Reading the sources. Every figure refers to a source, named in the text and detailed in Annex A. Each source carries a confidence level:
Summary
The points below summarise the dossier. The figures come from public sources: The World Bank, FAO (FAOSTAT, AQUASTAT), Jordanian public bodies (Department of Statistics, Ministry of Agriculture, Ministry of Water and Irrigation), PVGIS and NASA POWER. The production gains and water savings are scenarios, described in Annex B.
11.52 M Inhabitants in 2025 (World Bank) | 57,840 ha Of olives harvested in 2024, the main crop | 91,239 ha Equipped for irrigation (2024) |
96.5 Mm³ Of irrigation water saved a year, central scenario | 1,018 M$ Of agricultural exports in 2024 (FAOSTAT) |
Key figures
Key indicators for Jordan
Indicator | Value | Year | Source (level) |
|---|---|---|---|
Population | 11.52 M | 2025 | World Bank (A1) |
GDP per capita | 5,348 $ | 2025 | World Bank (A1) |
Agriculture share of GDP | 5.6% | 2025 | World Bank (A1) |
Agricultural employment | 3.1% | 2025 | World Bank (A1) |
Cropland | 285,000 ha | 2024 | FAOSTAT (A6) |
Area equipped for irrigation | 91,239 ha | 2024 | FAOSTAT (A6) |
Harvested area: Olives | 57,840 ha | 2024 | FAOSTAT (A2) |
Certified organic cropland | 580 ha | 2024 | FAOSTAT (A6) |
Agricultural exports | 1,018 M$ | 2024 | FAOSTAT (A4) |
Agricultural imports | 4,533 M$ | 2024 | FAOSTAT (A4) |
Mineral nitrogen, agricultural use | 16,039 t | 2024 | FAOSTAT (A5) |
Source: Table based on the sources indicated.
1. Green Solutions and our products
Green Solutions develops products for water, fertilisation and crop protection. Four families are of interest to this dossier. The yields cited are those published by the manufacturer or by the trials, with their confidence level.
Products covered by this dossier
Product | Claimed use | Published evidence (level) |
|---|---|---|
EVERGREEN® (water-retention polymer) | Holds rain or irrigation water as a gel, near the roots. | Trials on maize, potato, watermelon, date palm and soybean. Level B to C. |
ECOSORB® (water-retention polymer based on corn starch) | Same use; action lasting 2 to 3 years according to the website. | Soybean trial (China); laboratory acrylamide analysis. Level B to C. |
ECOFERT® (fertiliser) | Fertiliser certified by SOHISCERT and EU Bio, usable in organic farming. | Published certificate; potato trial combined with EVERGREEN®. Level A (certificate), C (results). |
Paulownia ALTIFOLIA® | Fast-growing tree for agroforestry. | Website figures; no trial in Jordan. Level C. |
Water Vital®, NAPEMA® | Outside the scope of this dossier. | No independent source in the documents consulted. |
Source: Green Solutions website (product sheets and published trials), Annex A.
The indicative dose published on the website is 30 to 75 kg/ha.
2. Jordan in figures
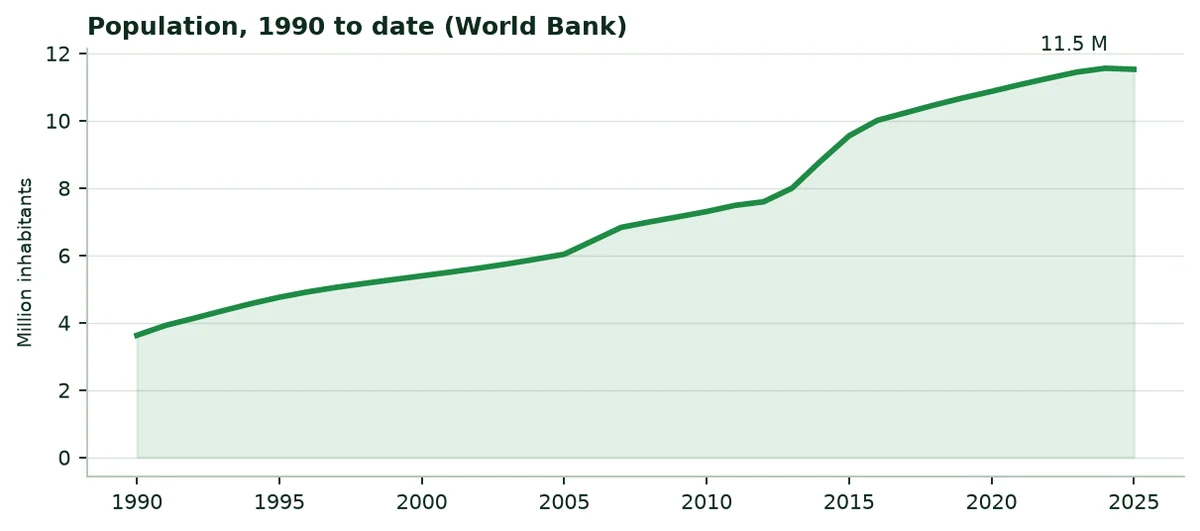
Jordan had 11.52 million inhabitants in 2025, 7% of them in rural areas. Agriculture accounts for 5.6% of gross domestic product and employs 3% of the labour force. The country covers 88.8 thousand km², of which 12% is agricultural land. Undernourishment affects 12.2% of the population.
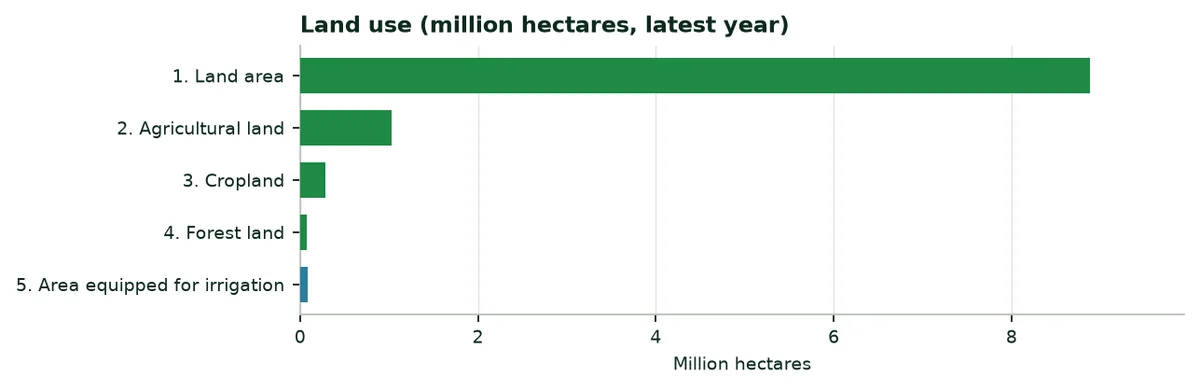
Agricultural and water indicators, latest year published
Indicator | Value | Year | Source |
|---|---|---|---|
Cropland certified organic | 580 ha | 2024 | FAOSTAT (A6) |
Average cereal yield | 1,611 kg/ha | 2024 | World Bank (A1) |
Fertiliser use per hectare of arable land | 111.9 kg/ha | 2024 | World Bank (A1) |
Water withdrawals, agricultural share | 51.6% | 2022 | World Bank (A1) |
Internal freshwater resources | 0.7 km³ | 2022 | World Bank (A1) |
Internal resources per inhabitant | 61 m³ | 2022 | World Bank (A1) |
3. Sunshine, rainfall and climate change
3.1 Sunshine
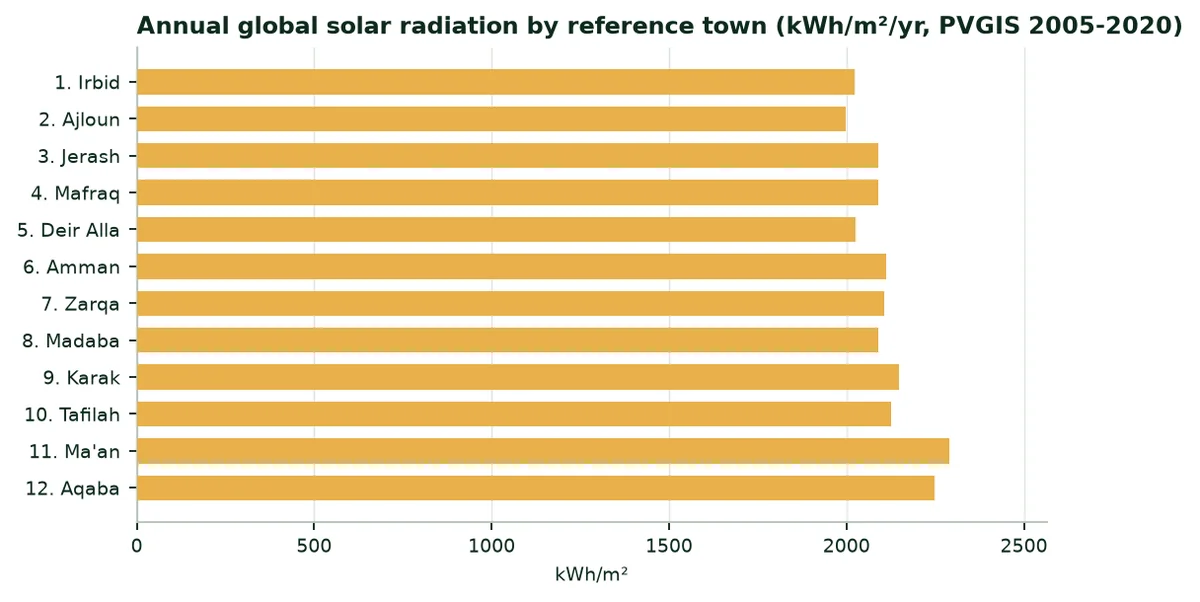
Global solar radiation reaches 1,999 to 2,290 kWh/m² a year depending on the region. Energy is not the limit: Water available at the right time makes the harvest.
3.2 Rainfall and evapotranspiration
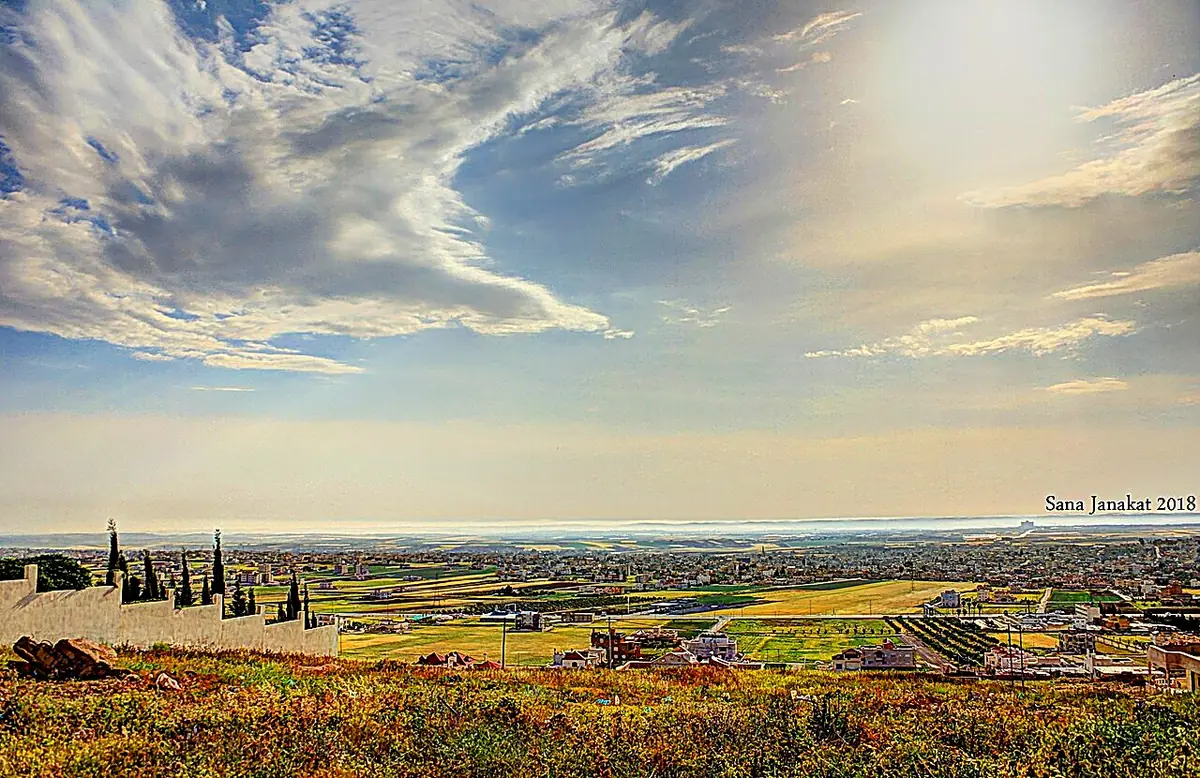
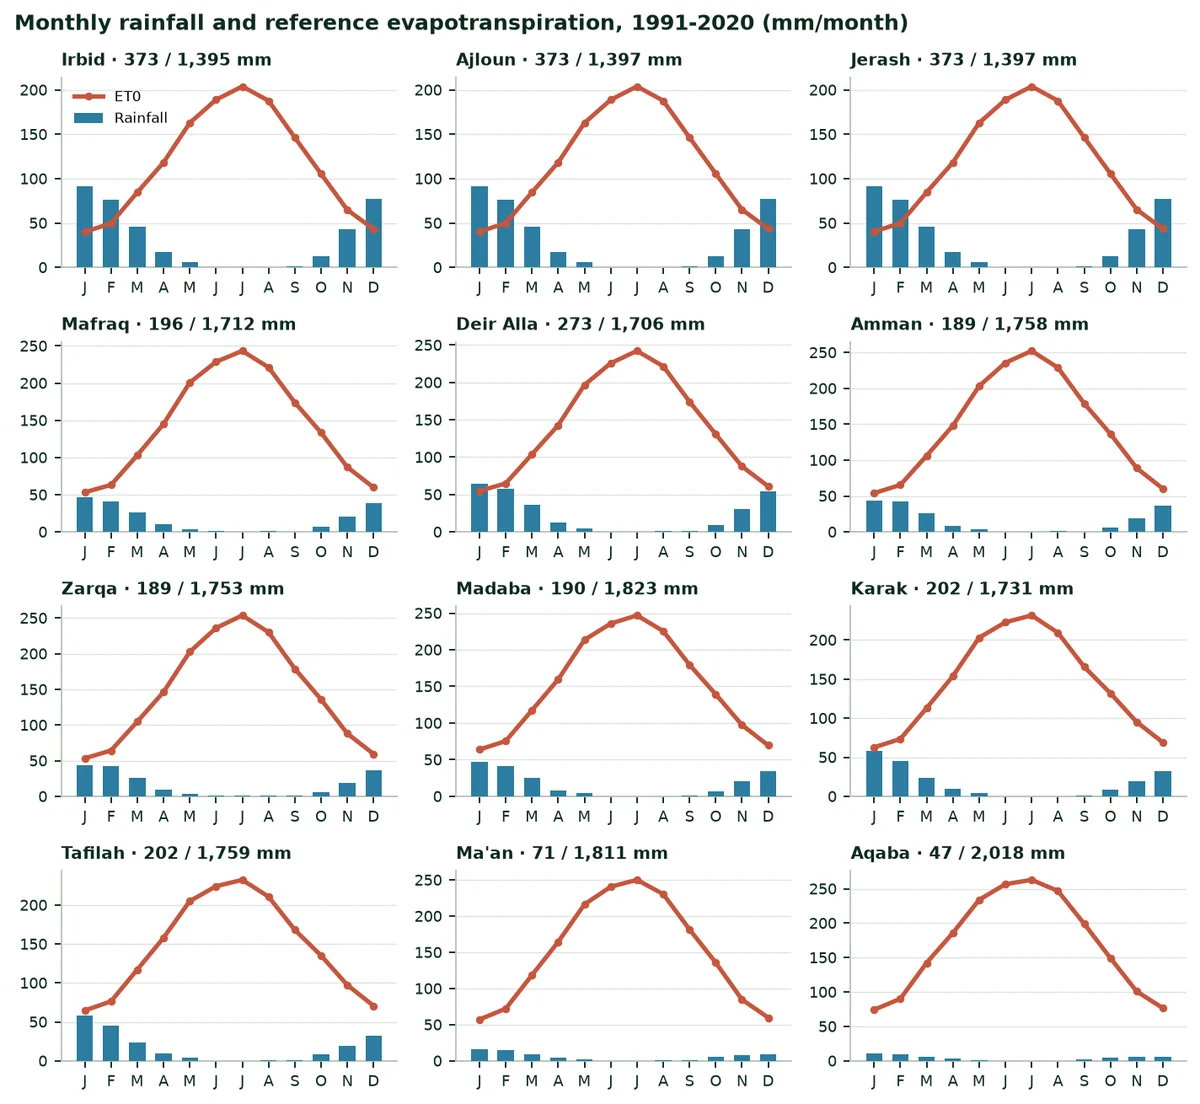
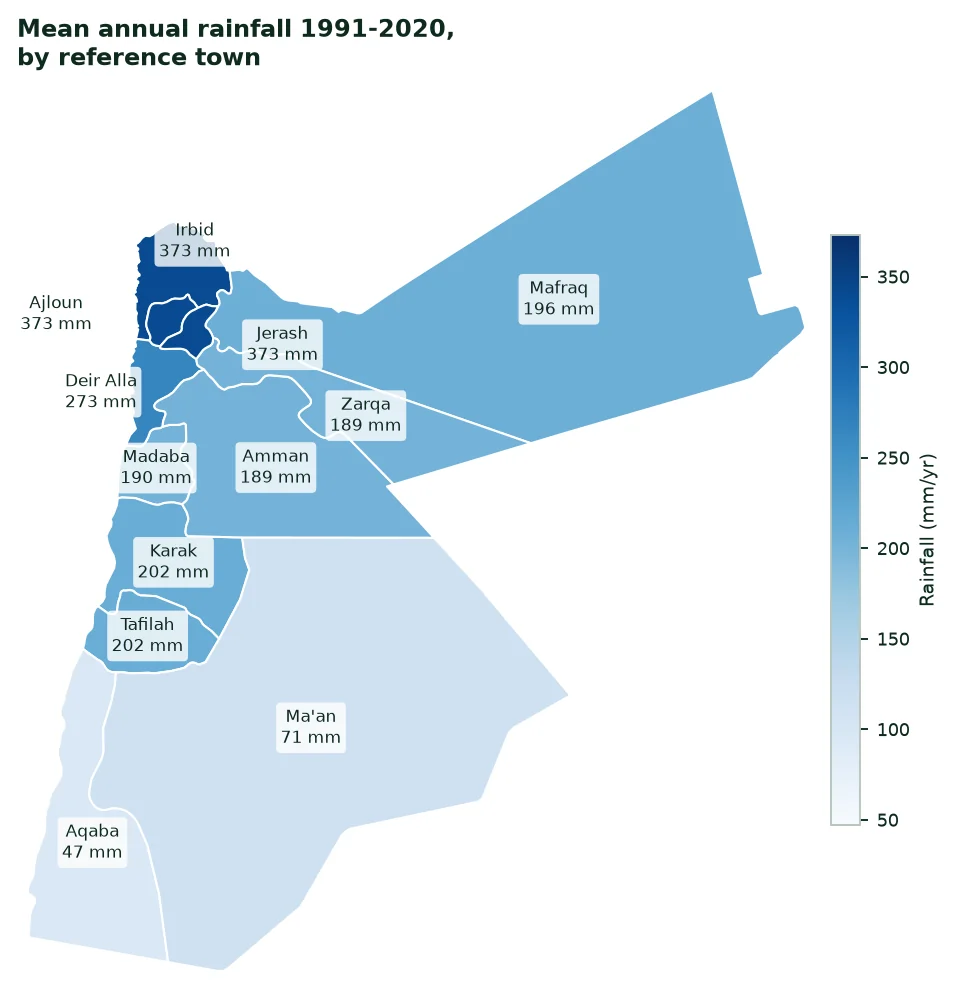
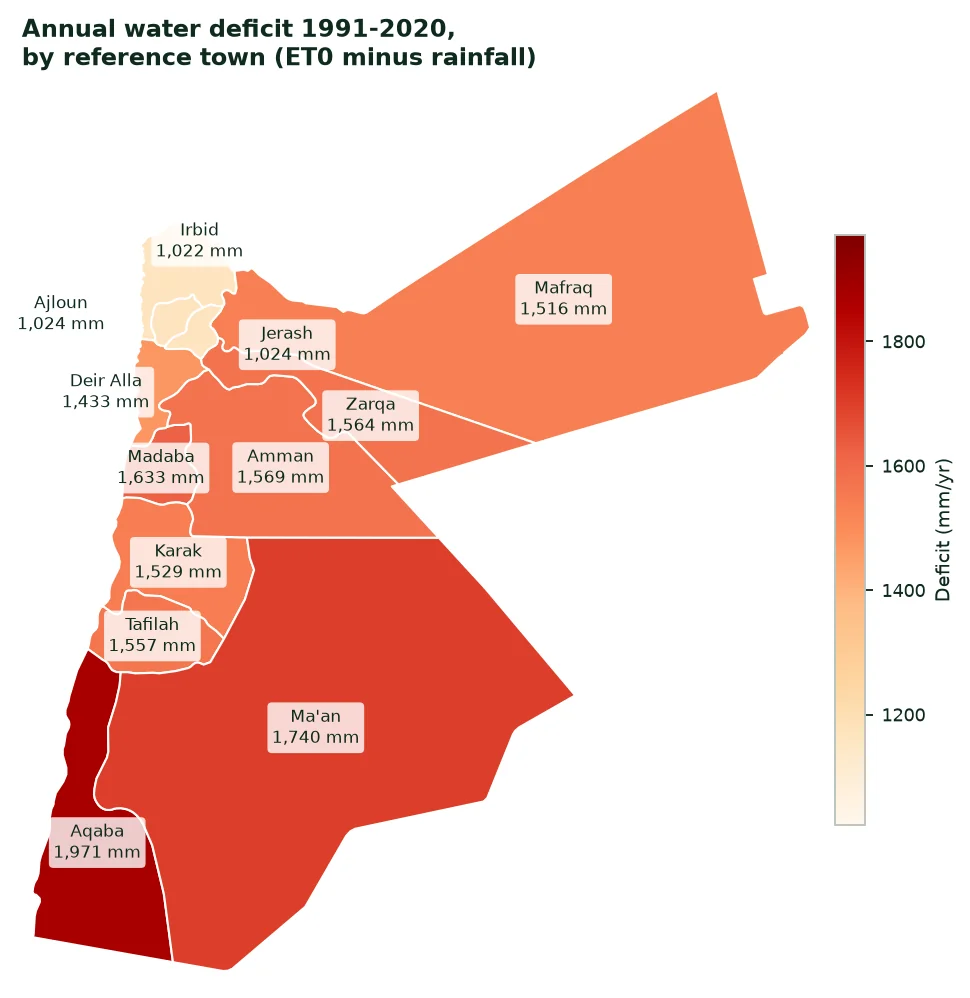
It rains 373 mm a year at Irbid, but only 47 mm at Aqaba, where reference evapotranspiration reaches 2,018 mm. Rain falls from October to April, mostly from December to February, and the summer is completely dry. The north-western heights receive the most water; the east and south are desert.
Mean monthly rainfall, 1991-2020 (mm per month)
City | Jan | Feb | Mar | Apr | May | Jun | Jul | Aug | Sep | Oct | Nov | Dec |
|---|---|---|---|---|---|---|---|---|---|---|---|---|
Irbid | 91 | 77 | 46 | 17 | 6 | 1 | 0 | 1 | 1 | 13 | 43 | 78 |
Ajloun | 91 | 77 | 46 | 17 | 6 | 1 | 0 | 1 | 1 | 13 | 43 | 78 |
Jerash | 91 | 77 | 46 | 17 | 6 | 1 | 0 | 1 | 1 | 13 | 43 | 78 |
Mafraq | 46 | 41 | 26 | 10 | 4 | 1 | 0 | 1 | 1 | 7 | 20 | 39 |
Deir Alla | 65 | 58 | 36 | 12 | 5 | 1 | 0 | 1 | 1 | 10 | 31 | 54 |
Amman | 44 | 42 | 26 | 9 | 4 | 1 | 1 | 1 | 1 | 6 | 19 | 37 |
Zarqa | 44 | 42 | 26 | 9 | 4 | 1 | 1 | 1 | 1 | 6 | 19 | 37 |
Madaba | 46 | 41 | 26 | 8 | 4 | 0 | 0 | 0 | 1 | 7 | 20 | 35 |
Karak | 58 | 45 | 24 | 10 | 4 | 0 | 0 | 0 | 1 | 8 | 19 | 33 |
Tafilah | 58 | 45 | 24 | 10 | 4 | 0 | 0 | 0 | 1 | 8 | 19 | 33 |
Ma'an | 16 | 15 | 8 | 4 | 2 | 0 | 0 | 1 | 1 | 6 | 8 | 9 |
Aqaba | 11 | 9 | 5 | 3 | 1 | 0 | 0 | 0 | 2 | 4 | 6 | 6 |
Source: NASA POWER (A9); author's calculation.
 |  |
|---|
3.3 Climate change
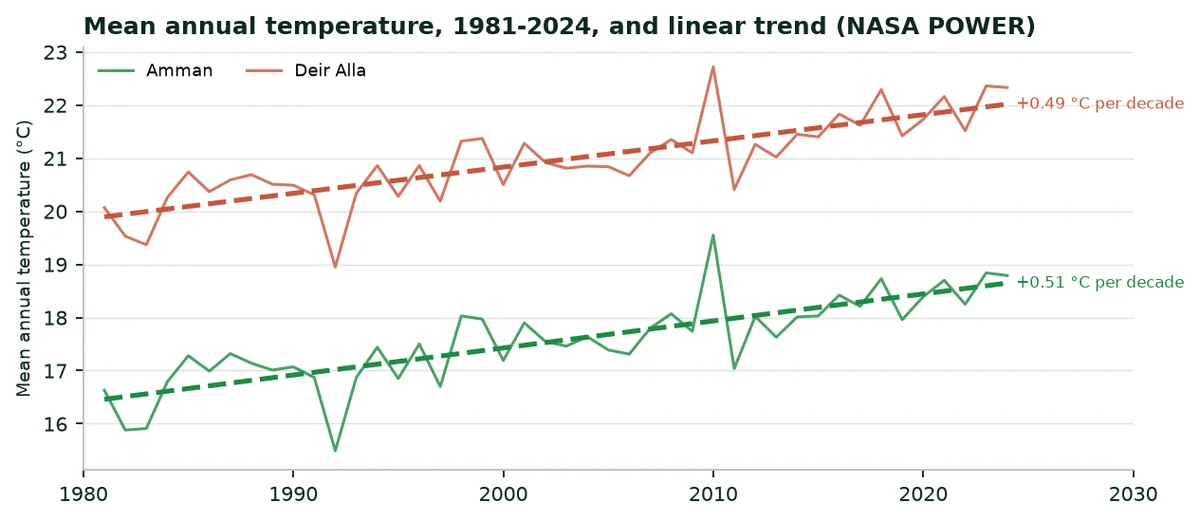
Mean annual temperature is rising. At Amman it went from 16.6 °C in 1981 to 18.8 °C in 2024, a trend of 0.51 °C per decade. At Deir Alla the trend is 0.49 °C per decade, from 20.1 °C to 22.3 °C. Warmer air dries the soil faster between two rains.
4. Water: Resources, irrigated areas, withdrawals
4.1 Resources and withdrawals
Total freshwater withdrawals are 950 million m³ a year (2022). Agriculture withdraws 51.6% of it, that is 491 Mm³. Internal resources are 0.7 km³ a year and water stress is 105.2%: The resource is already heavily used: Every cubic metre kept in the soil counts.
Freshwater: Withdrawals and resources
Indicator | Value | Year | Source |
|---|---|---|---|
Total withdrawals | 950 Mm³ | 2022 | World Bank (A1) |
Agricultural share | 51.6% | 2022 | World Bank (A1) |
Agricultural withdrawals | 490.6 Mm³ | 2022 | Calculated from A1 |
Area equipped for irrigation | 91,239 ha | 2024 | FAOSTAT (A6) |
Agricultural withdrawals per equipped hectare | 5,377 m³/ha | — | Calculation (Annex B) |
Water stress | 105.2% | 2022 | World Bank (A1) |
4.2 Irrigated areas
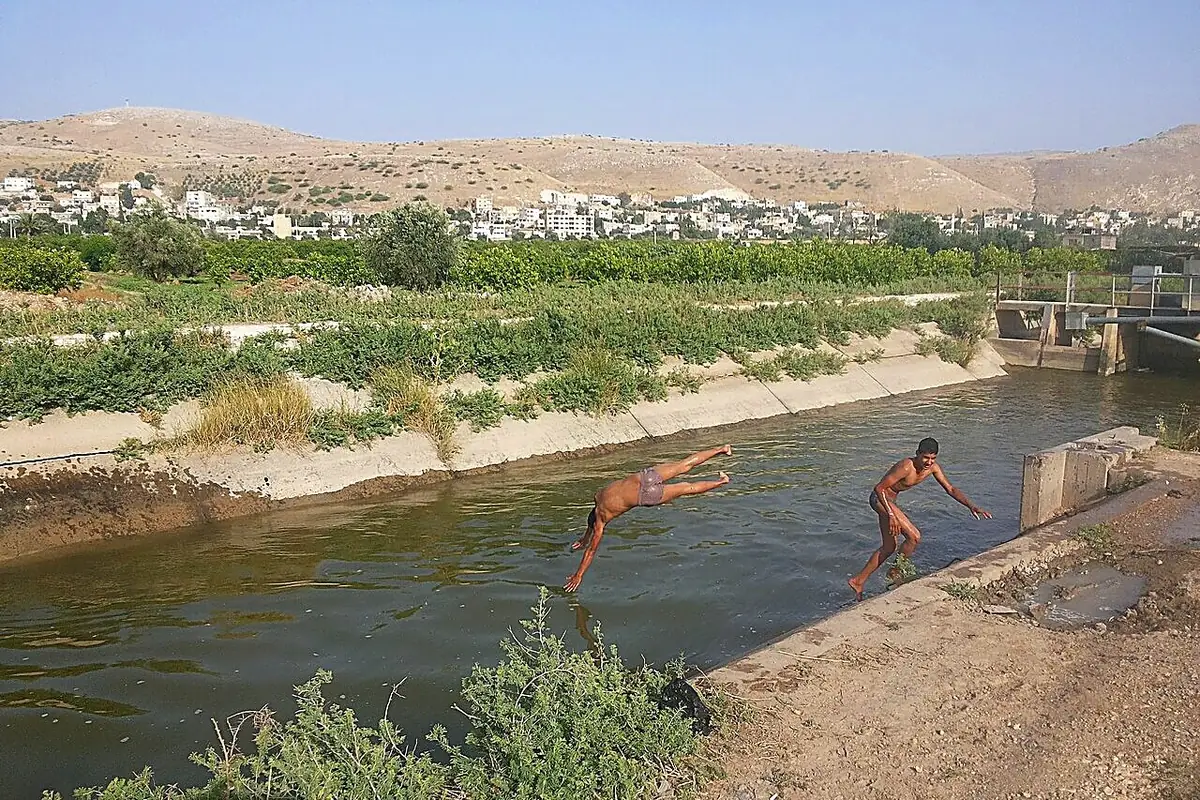
FAOSTAT counts 91,239 hectares equipped for irrigation in 2024. In 2024, the area equipped for irrigation reaches 91,240 ha and the area actually irrigated 92,800 ha; 4,300 ha of crops are under protective cover (A6). Irrigation is concentrated in the Jordan Valley, fed by the King Abdullah Canal, and on borehole farms of the eastern and southern plateaus.
4.3 What the water saving represents
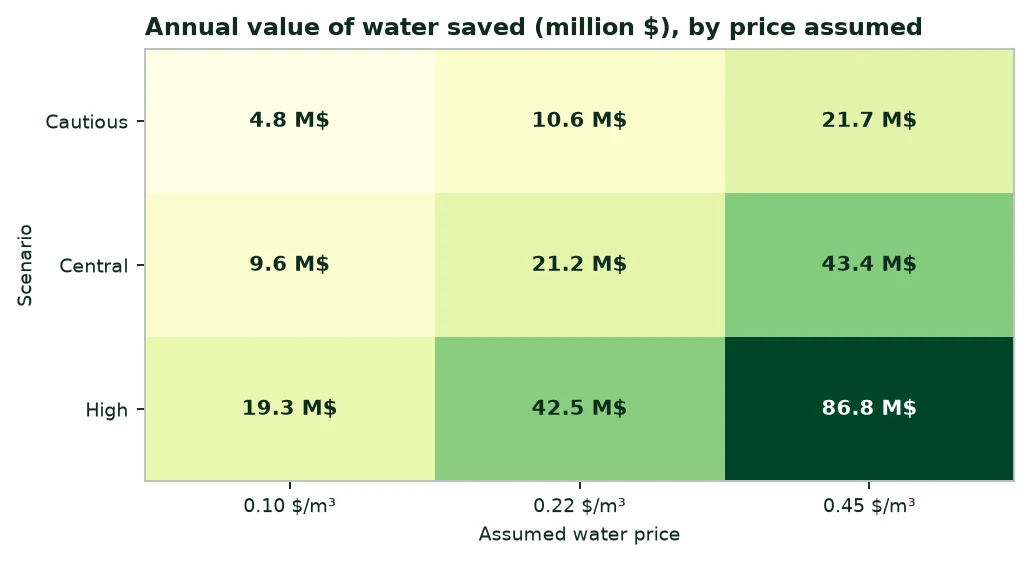
In the central scenario, the saving is 96.5 million m³ a year, or 19.7% of agricultural withdrawals. At 5,377 m³ per equipped hectare, this water would irrigate about 17,947 more hectares, or 19.7% of today's equipped area.
5. Fertilisers: Quantities, purchases, spending
5.1 Quantities used
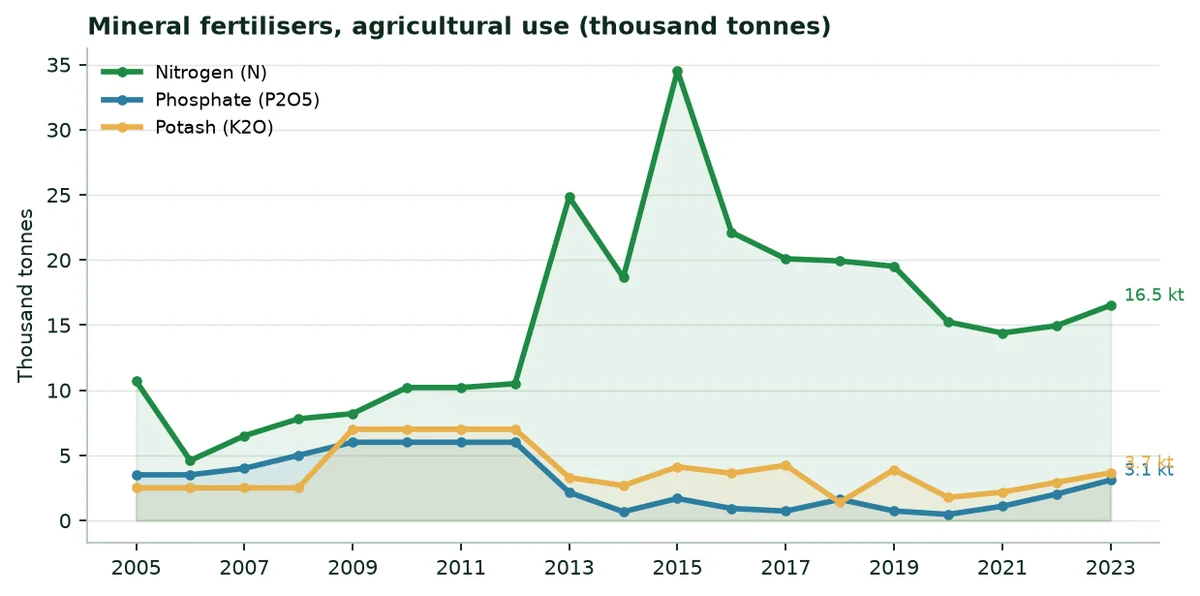
In 2024, agricultural use reaches 16,039 tonnes of nitrogen, 2,945 tonnes of phosphate (P2O5) and 3,515 tonnes of potash (K2O). The country produces 151,100 tonnes of nitrogen and 383,400 tonnes of phosphate (P2O5); it imported 27,264 tonnes of nitrogen in the same year. Per hectare of arable land, use is 111.9 kg per hectare.
5.2 Regulatory framework
Agriculture Law No. 13 of 2015 requires a licence to produce and trade fertilisers, from the Ministry of Agriculture (A13). A water-retaining polymer would come under it according to its classification, to be confirmed with the ministry.
5.3 Indicative spending
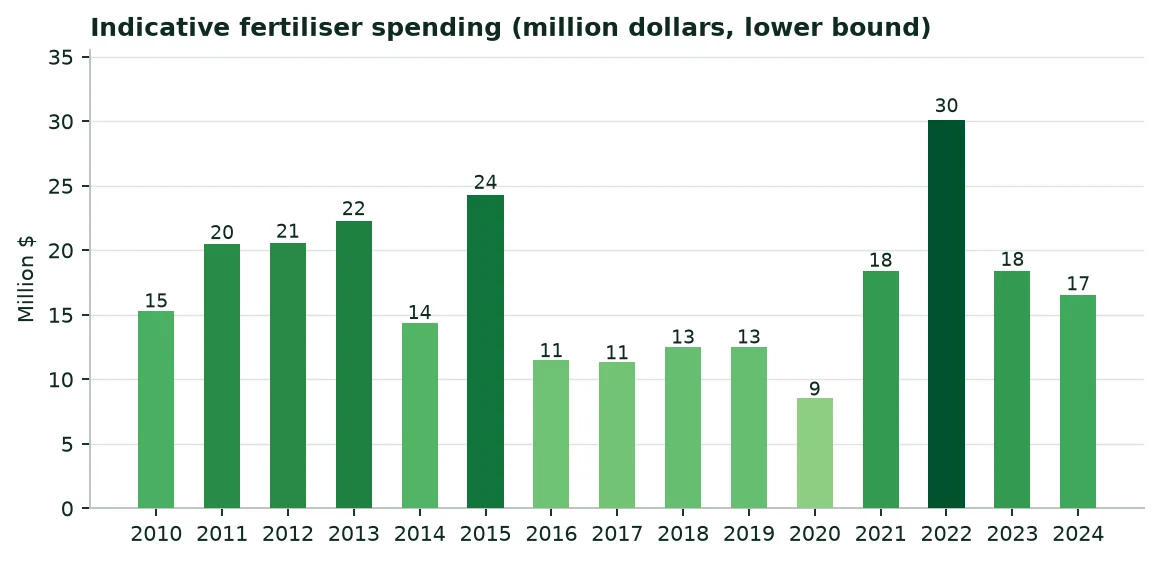
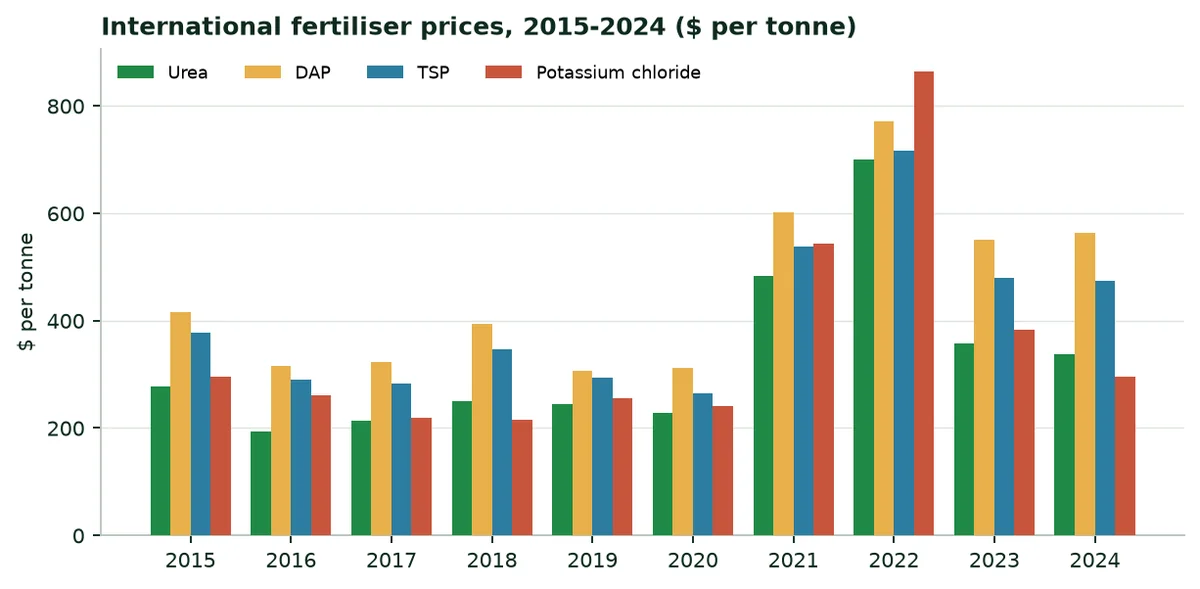
In 2024, the indicative minimum spending on mineral fertilisers reaches $17 million, at international fertiliser prices (calculation in Annex B, lower bound).
6. The regions at a glance
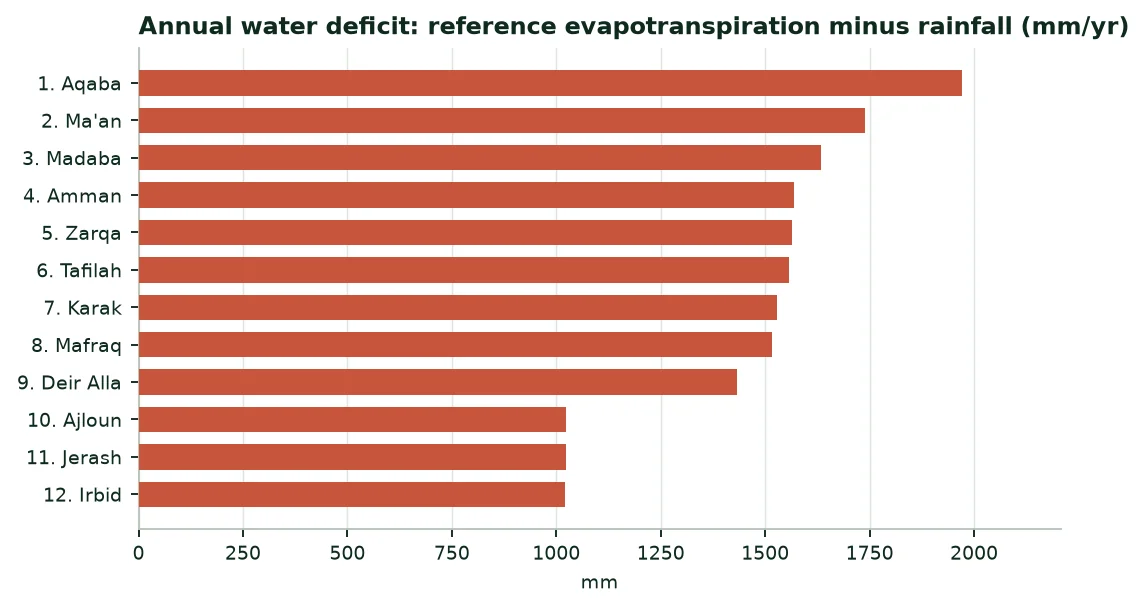
The table compares the twelve governorates, each represented by a reference town. Climate figures are 1991-2020 averages, except radiation (2005-2020).
Climate of the capitals, 1991-2020 means
Region (city) | Rainfall (mm/yr) | ET0 (mm/yr) | Deficit (mm/yr) | Radiation (kWh/m²/yr) | Temperature (°C) |
|---|---|---|---|---|---|
Irbid (Irbid) | 373 | 1,395 | 1,022 | 2,022 | 20.1 |
Ajloun (Ajloun) | 373 | 1,397 | 1,024 | 1,999 | 20.1 |
Jerash (Jerash) | 373 | 1,397 | 1,024 | 2,090 | 20.1 |
Mafraq (Mafraq) | 196 | 1,712 | 1,516 | 2,091 | 17.5 |
Balqa (Deir Alla) | 273 | 1,706 | 1,433 | 2,027 | 21.0 |
Amman (Amman) | 189 | 1,758 | 1,569 | 2,112 | 17.6 |
Zarqa (Zarqa) | 189 | 1,753 | 1,564 | 2,107 | 17.6 |
Madaba (Madaba) | 190 | 1,823 | 1,633 | 2,091 | 21.8 |
Karak (Karak) | 202 | 1,731 | 1,529 | 2,149 | 19.2 |
Tafilah (Tafilah) | 202 | 1,759 | 1,557 | 2,126 | 19.2 |
Ma'an (Ma'an) | 71 | 1,811 | 1,740 | 2,290 | 16.4 |
Aqaba (Aqaba) | 47 | 2,018 | 1,971 | 2,249 | 20.0 |
Source: NASA POWER (A9); PVGIS (A8); author's calculation.
7. The twenty main crops: Three rankings
7.1 By harvested area
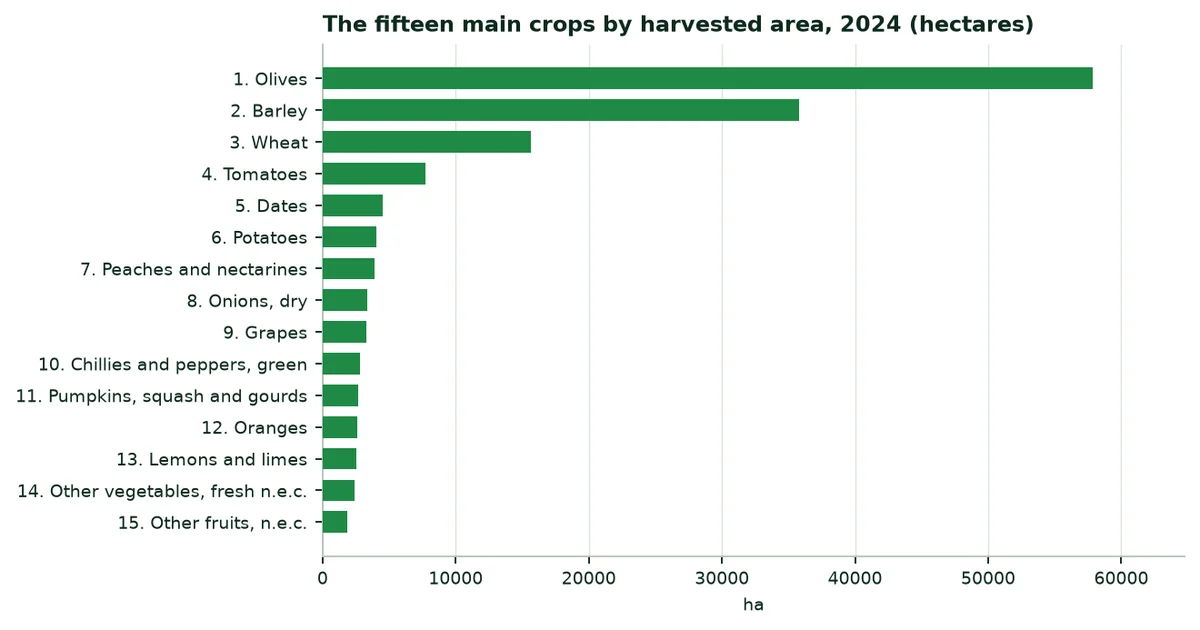
The ten main crops by area, 2024
Crop | Harvested area (ha) | Production (t) | Yield (t/ha) |
|---|---|---|---|
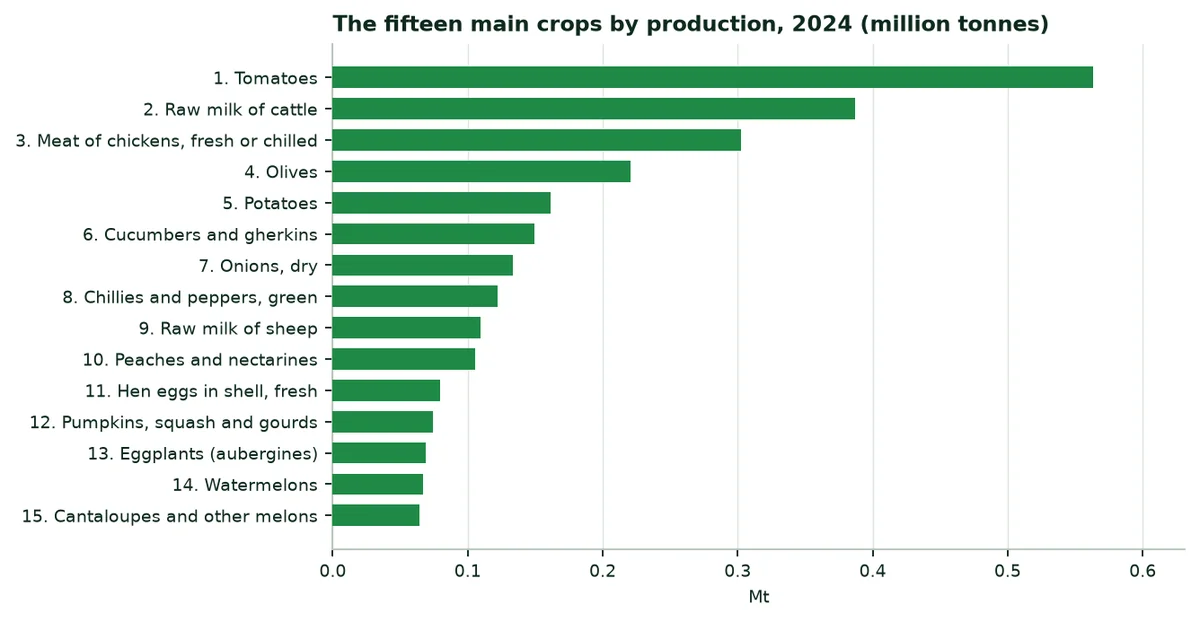
Olives | 57,840 | 220,746 | 3.82 |
Barley | 35,805 | 43,180 | 1.21 |
Wheat | 15,617 | 34,429 | 2.20 |
Tomatoes | 7,717 | 563,548 | 73.03 |
Dates | 4,495 | 32,618 | 7.26 |
Potatoes | 4,043 | 161,367 | 39.91 |
Peaches and nectarines | 3,882 | 105,423 | 27.16 |
Onions, dry | 3,375 | 133,239 | 39.48 |
Grapes | 3,258 | 27,950 | 8.58 |
Chillies and peppers, green | 2,823 | 122,252 | 43.31 |
Source: FAOSTAT (A2).
7.2 By production
7.3 By production value
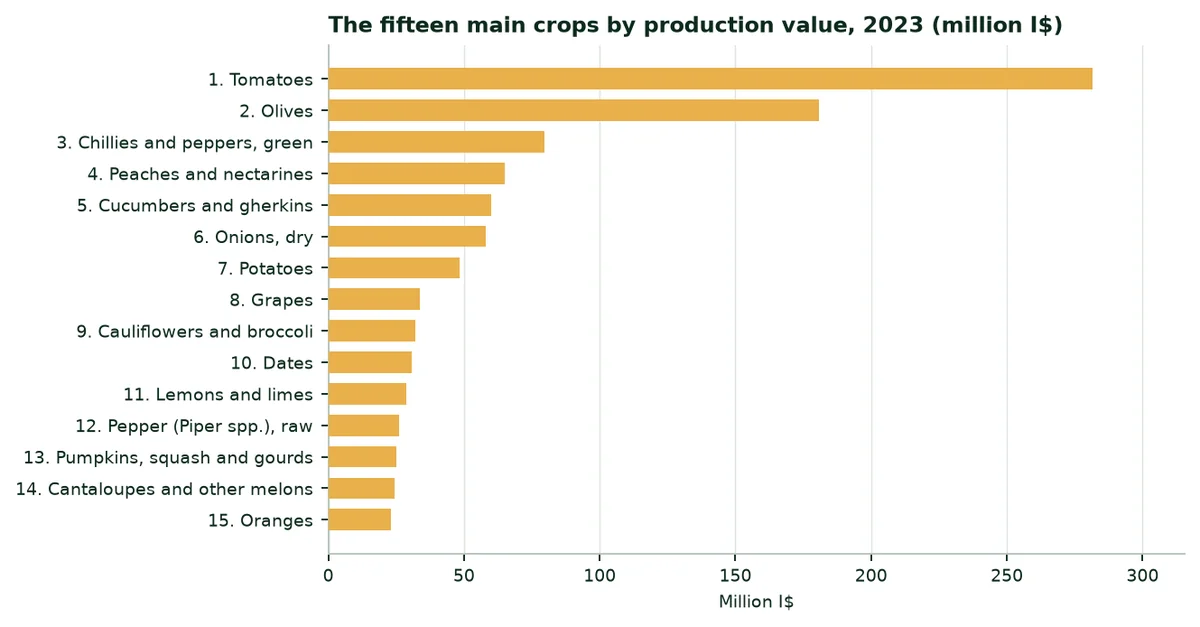
By production value, the three main crops are: Tomatoes, olives and chillies and peppers, green (FAOSTAT, 2023, constant international dollars).
8. Extrapolation by crop: Irrigation and rainfed crops
8.1 Method
8.2 Trials used as analogues
Trials cited and their use in the calculation
Trial | Crop | Water | Yield | Use in the calculation |
|---|---|---|---|---|
Maize, Türkiye (TIGEM, Konya, 2025) | Maize | -38.9% | +17.1% | Not used; cited for reference |
Soybean, China | Soybean | Assumption | +11.3% | Not used; cited for reference |
Watermelon, Mexico (2023) | Watermelon | -60.5% | +30.0% | Vegetables and melons: Water and yield |
Potato, South Africa (2025) | Potato | -52.0% | +31.4% | Potato: Water and yield |
Date palm, UAE (ICBA, 2021) | Palm | -82.0% | +20.0% | Date palm: Water and yield |
Source: A14 to A18 (published trials and manufacturer's website, levels B and C).
No trial has yet been conducted in Jordan: The figures below apply the trials cited to the country's average yields.
8.3 Irrigation: Vegetables and melons, Potato, Date palm and Citrus
Equipped area assigned, trial used and water saved (central scenario)
Crop group | Equipped area (ha) | Share | Trial or assumption | Water saved (Mm³/yr) |
|---|---|---|---|---|
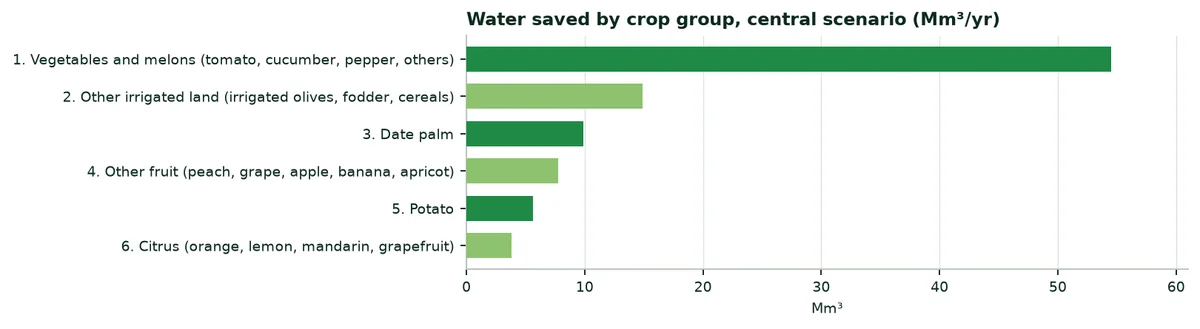
Vegetables and melons (tomato, cucumber, pepper, others) | 33,497 | 36.7% | Watermelon, Mexico (2023) | 54.5 |
Potato | 4,043 | 4.4% | Potato, South Africa (2025) | 5.7 |
Date palm | 4,495 | 4.9% | Date palm, UAE (ICBA, 2021) | 9.9 |
Citrus (orange, lemon, mandarin, grapefruit) | 7,054 | 7.7% | Generic assumption, no trial | 3.8 |
Other fruit (peach, grape, apple, banana, apricot) | 14,434 | 15.8% | Generic assumption, no trial | 7.8 |
Other irrigated land (irrigated olives, fodder, cereals) | 27,716 | 30.4% | Generic assumption, no trial | 14.9 |
Source: Author's calculation (Annex B).
Water saved, extra irrigable hectares and production gain, by scenario
Scenario | Water (Mm³/yr) | Extra hectares | Production (t/yr) |
|---|---|---|---|
Cautious | 48.2 | 8,974 | 129,129 |
Central | 96.5 | 17,947 | 258,259 |
High | 193.0 | 35,895 | 516,517 |
Source: Author's calculation (Annex B).
8.4 Reading the results
9. Potential benefits of our products
The table lists what the products may bring according to the documents available, with their confidence level and their limit.
Potential benefits, by situation
Benefit | Published figures | Source (level) | Limit |
|---|---|---|---|
Irrigation water saving | Date palm −82%; watermelon −60.5%; potato −52%; maize −38.9% | A14 to A18 (B, C) | One trial per crop; none in Jordan |
Yield | Maize +17.1%; potato +31.4%; watermelon +30%; date palm +20%; soybean +11.2 to +11.4% | A14 to A18 (B, C) | Trials conducted under irrigation or in other climates |
Organic farming (ECOFERT®) | Certified by SOHISCERT and EU Bio | A21 (A) | Valid for the certified product |
Safety: Acrylamide (ECOSORB®) | Below 3.0 µg/g | A19 (B) | One laboratory, one date |
REACH compliance (EVERGREEN®) | ≤ 0.1% of substances of very high concern in 233 substances tested | A20 (B) | Screening, not an approval |
Agroforestry (Paulownia ALTIFOLIA®) | 13 to 15 m in 6 to 8 years (website) | A22 (C) | No trial in Jordan |
Source: Annex A.
10. External trade: Exports, imports, importing
10.1 Overview, 2023 and 2024
Agricultural products and total merchandise trade (million $)
Indicator | 2023 | 2024 |
|---|---|---|
Agricultural exports (crops and livestock) | 1,638 | 1,018 |
Agricultural imports (crops and livestock) | 5,053 | 4,533 |
Exports, all merchandise | 12,763 | 13,292 |
Imports, all merchandise | 25,470 | 26,792 |
Source: FAOSTAT (A4).
10.2 Exports
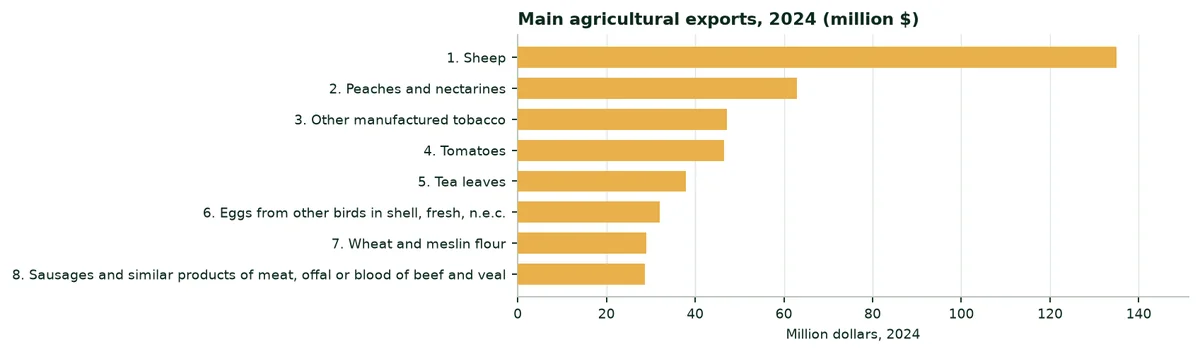
The three main farm products exported in 2024 are: Sheep ($135 million), peaches and nectarines ($63 million) and other manufactured tobacco ($47 million).
10.3 Imports
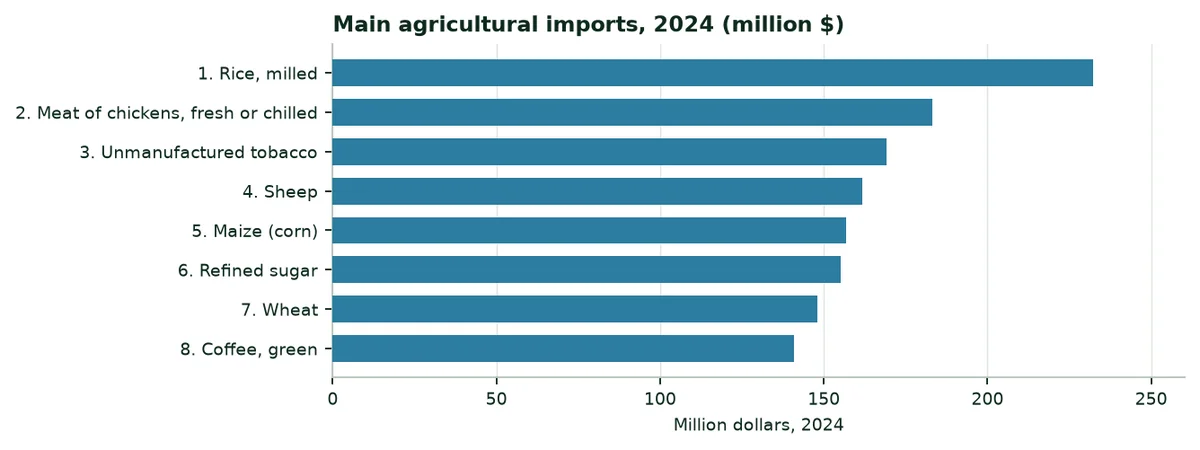
The main farm purchases are: Meat of chickens, fresh or chilled ($183 million), unmanufactured tobacco ($169 million) and sheep ($162 million). Rice weighs $232 million (husked, broken and milled rice): Every tonne grown locally reduces this bill.
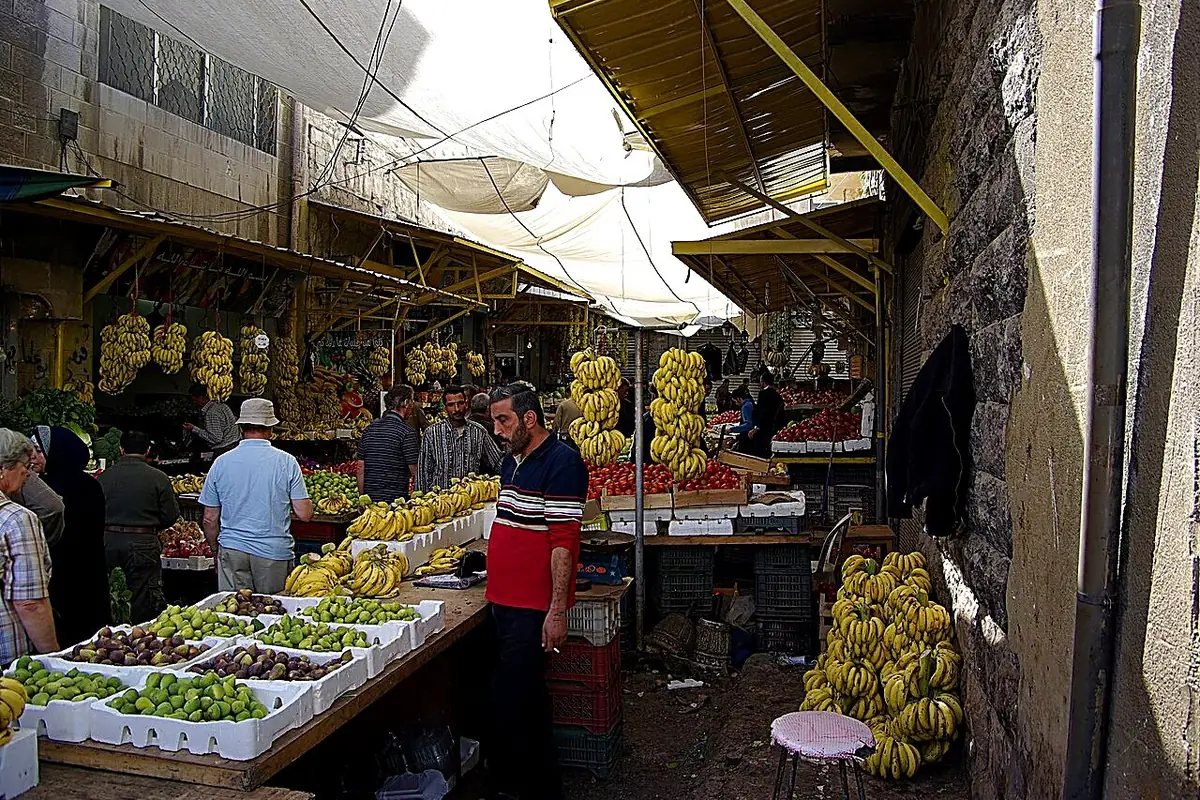 | 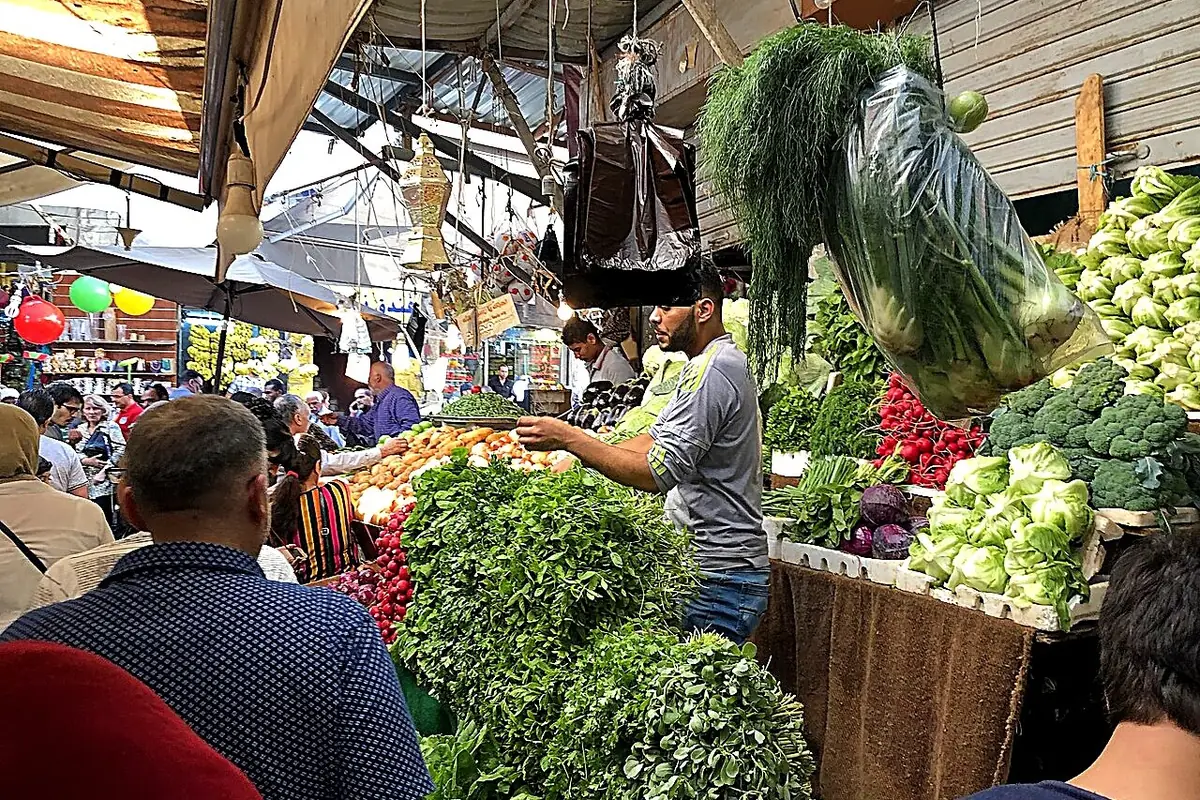 |
|---|
10.4 Importing water-retention polymers into Jordan
11. A study of each region
Each region is described through the city that represents it. The figures describe the climate; the water deficit (evapotranspiration minus rainfall) shows where water is most short. The description of crops is qualitative.
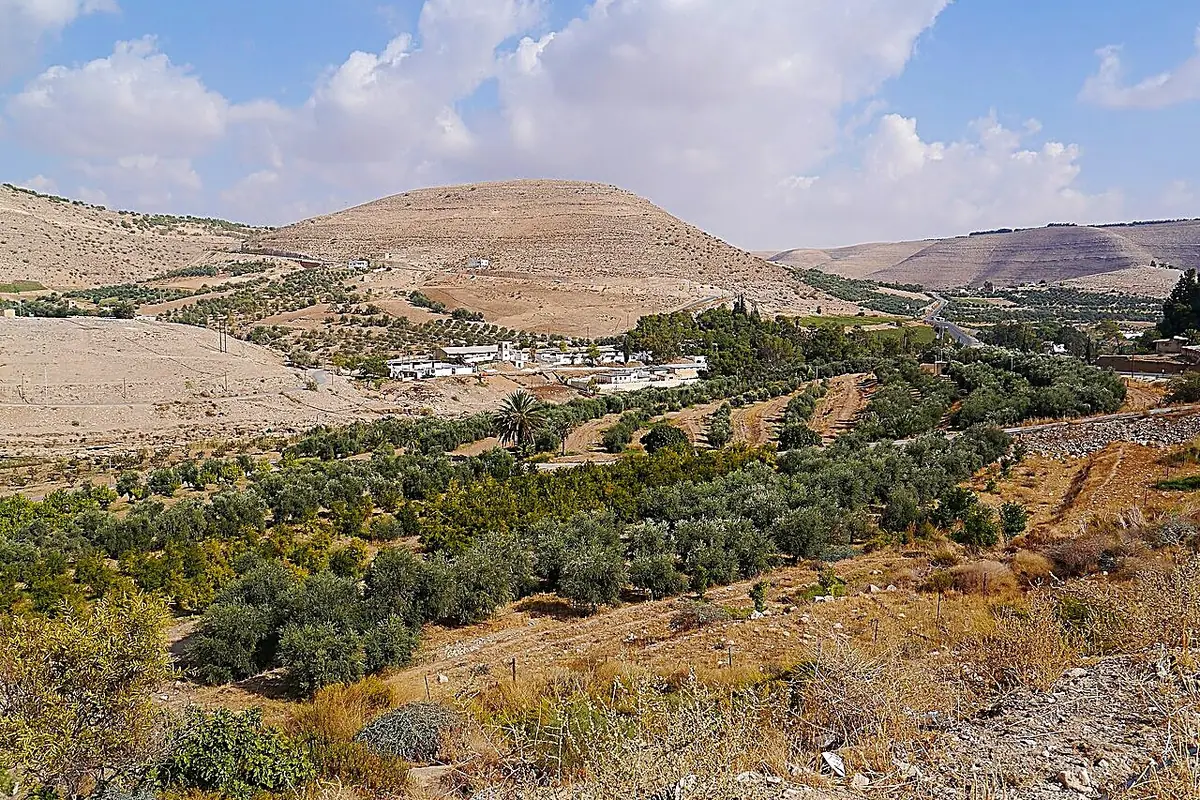
Irbid (Irbid)
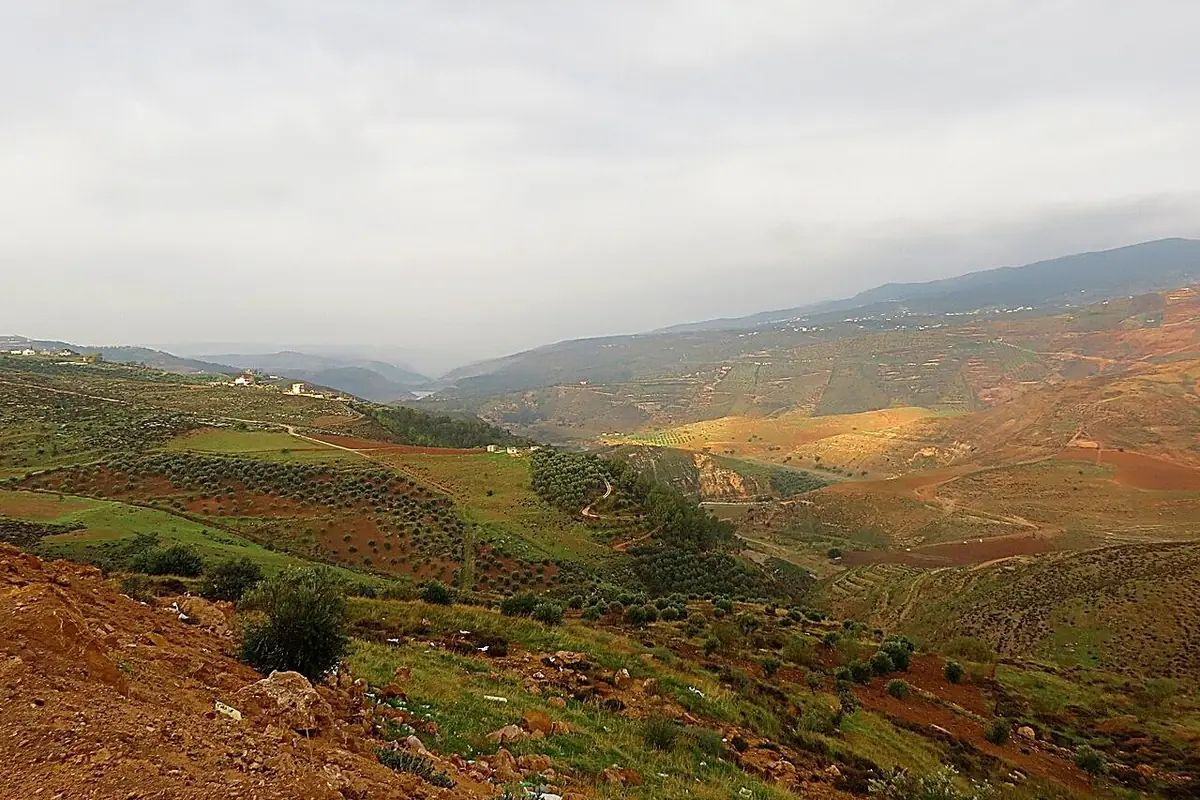
Northern plateau and Jordan Valley: Rainfed wheat and barley, olive groves on the heights, and below, the irrigated vegetables and citrus of the Northern Ghor.
Indicator | Value |
|---|---|
Annual rainfall, 1991-2020 | 373 mm |
Reference evapotranspiration | 1,395 mm |
Annual water deficit | 1,022 mm |
Months with less than 50 mm of rain | 9 |
Global solar radiation | 2,022 kWh/m² |
Mean temperature | 20.1 °C |
Source: NASA POWER (A9); PVGIS (A8); author's calculation.
Ajloun (Ajloun)
Wooded hills, the wettest in the country: Olive groves, fruit trees and small family farms on terraces.
Indicator | Value |
|---|---|
Annual rainfall, 1991-2020 | 373 mm |
Reference evapotranspiration | 1,397 mm |
Annual water deficit | 1,024 mm |
Months with less than 50 mm of rain | 9 |
Global solar radiation | 1,999 kWh/m² |
Mean temperature | 20.1 °C |
Source: NASA POWER (A9); PVGIS (A8); author's calculation.
Jerash (Jerash)
Northern highlands: Olive groves, orchards and poultry, with enough winter rain for rainfed crops.
Indicator | Value |
|---|---|
Annual rainfall, 1991-2020 | 373 mm |
Reference evapotranspiration | 1,397 mm |
Annual water deficit | 1,024 mm |
Months with less than 50 mm of rain | 9 |
Global solar radiation | 2,090 kWh/m² |
Mean temperature | 20.1 °C |
Source: NASA POWER (A9); PVGIS (A8); author's calculation.
Mafraq (Mafraq)
Eastern steppe and desert: Farms irrigated from boreholes (vegetables, fruit, olives) and sheep, on a heavily used aquifer.
Indicator | Value |
|---|---|
Annual rainfall, 1991-2020 | 196 mm |
Reference evapotranspiration | 1,712 mm |
Annual water deficit | 1,516 mm |
Months with less than 50 mm of rain | 12 |
Global solar radiation | 2,091 kWh/m² |
Mean temperature | 17.5 °C |
Source: NASA POWER (A9); PVGIS (A8); author's calculation.
Balqa (Deir Alla)
Central Jordan Valley, below sea level: Winter vegetables, citrus and bananas irrigated from the King Abdullah Canal.
Indicator | Value |
|---|---|
Annual rainfall, 1991-2020 | 273 mm |
Reference evapotranspiration | 1,706 mm |
Annual water deficit | 1,433 mm |
Months with less than 50 mm of rain | 9 |
Global solar radiation | 2,027 kWh/m² |
Mean temperature | 21.0 °C |
Source: NASA POWER (A9); PVGIS (A8); author's calculation.
Amman (Amman)
Capital region: Olive groves, peri-urban vegetables and poultry in the west, steppe and livestock in the east.
Indicator | Value |
|---|---|
Annual rainfall, 1991-2020 | 189 mm |
Reference evapotranspiration | 1,758 mm |
Annual water deficit | 1,569 mm |
Months with less than 50 mm of rain | 12 |
Global solar radiation | 2,112 kWh/m² |
Mean temperature | 17.6 °C |
Source: NASA POWER (A9); PVGIS (A8); author's calculation.
Zarqa (Zarqa)
Zarqa basin: Fodder and crops irrigated partly with treated wastewater, livestock and industry.
Indicator | Value |
|---|---|
Annual rainfall, 1991-2020 | 189 mm |
Reference evapotranspiration | 1,753 mm |
Annual water deficit | 1,564 mm |
Months with less than 50 mm of rain | 12 |
Global solar radiation | 2,107 kWh/m² |
Mean temperature | 17.6 °C |
Source: NASA POWER (A9); PVGIS (A8); author's calculation.
Madaba (Madaba)
Central plateau: Rainfed wheat and barley, olive groves and sheep, with yields that follow the year's rain.
Indicator | Value |
|---|---|
Annual rainfall, 1991-2020 | 190 mm |
Reference evapotranspiration | 1,823 mm |
Annual water deficit | 1,633 mm |
Months with less than 50 mm of rain | 12 |
Global solar radiation | 2,091 kWh/m² |
Mean temperature | 21.8 °C |
Source: NASA POWER (A9); PVGIS (A8); author's calculation.
Karak (Karak)
Plateau and Southern Ghor: Cereals and olives on the heights, irrigated vegetables and bananas by the Dead Sea.
Indicator | Value |
|---|---|
Annual rainfall, 1991-2020 | 202 mm |
Reference evapotranspiration | 1,731 mm |
Annual water deficit | 1,529 mm |
Months with less than 50 mm of rain | 11 |
Global solar radiation | 2,149 kWh/m² |
Mean temperature | 19.2 °C |
Source: NASA POWER (A9); PVGIS (A8); author's calculation.
Tafilah (Tafilah)
Southern highlands: Rainfed cereals, olive groves and small irrigated plots in the valleys.
Indicator | Value |
|---|---|
Annual rainfall, 1991-2020 | 202 mm |
Reference evapotranspiration | 1,759 mm |
Annual water deficit | 1,557 mm |
Months with less than 50 mm of rain | 11 |
Global solar radiation | 2,126 kWh/m² |
Mean temperature | 19.2 °C |
Source: NASA POWER (A9); PVGIS (A8); author's calculation.
Ma'an (Ma'an)
Southern desert: Large borehole-irrigated farms, olives and livestock, with almost no rain.
Indicator | Value |
|---|---|
Annual rainfall, 1991-2020 | 71 mm |
Reference evapotranspiration | 1,811 mm |
Annual water deficit | 1,740 mm |
Months with less than 50 mm of rain | 12 |
Global solar radiation | 2,290 kWh/m² |
Mean temperature | 16.4 °C |
Source: NASA POWER (A9); PVGIS (A8); author's calculation.
Aqaba (Aqaba)
Desert and Wadi Araba: Irrigated date palms and vegetables, under the country's highest heat.
Indicator | Value |
|---|---|
Annual rainfall, 1991-2020 | 47 mm |
Reference evapotranspiration | 2,018 mm |
Annual water deficit | 1,971 mm |
Months with less than 50 mm of rain | 12 |
Global solar radiation | 2,249 kWh/m² |
Mean temperature | 20.0 °C |
Source: NASA POWER (A9); PVGIS (A8); author's calculation.
Annex A. Sources and confidence levels
Ref. | Source | Level |
|---|---|---|
A1 | World Bank, World Development Indicators (WDI), Jordan | A |
A2 | FAOSTAT, crops and livestock (QCL), areas, production, 2014-2024 | A |
A3 | FAOSTAT, value of production (QV), constant 2014-2016 I$, 2019-2024 | A |
A4 | FAOSTAT, trade in crops and livestock products, 2018-2024 | A |
A5 | FAOSTAT, mineral fertilisers, agricultural use, production and imports, 2005-2023 | A |
A6 | FAOSTAT, land use, areas equipped for irrigation, organic farming | A |
A7 | World Bank, Pink Sheet (world prices of urea, DAP, TSP and potassium chloride) | A |
A8 | PVGIS (European Commission Joint Research Centre), radiation, 2005-2020 | B |
A9 | NASA POWER (NASA Langley Research Center), daily data: Rainfall, temperature, humidity, wind and radiation, 1981-2024; reference evapotranspiration calculated by the author with FAO-56 (Penman-Monteith) | B |
A10 | Natural Earth, first-level administrative boundaries and country outline | B |
A11 | World Bank, WITS (UNCTAD TRAINS database), Jordan, applied MFN duties, subheading 3906.90, 2023 | A |
A12 | PwC, Worldwide Tax Summaries, Jordan, other taxes: General sales tax | C |
A13 | Agriculture Law No. 13 of 2015 (Jordan), as summarised in FAO's FAOLEX database: Licences to produce and trade seeds, fertilisers and plant growth regulators | A |
A14 | Soybean trial, China (yield), manufacturer's website | C |
A15 | Date palm trial, UAE (ICBA, 2021), manufacturer's website | B |
A16 | Watermelon trial, Mexico (2023), manufacturer's website | C |
A17 | Potato trial, South Africa (2025), manufacturer's website | C |
A18 | Maize trial, Türkiye (TIGEM, Konya, 2025), manufacturer's website | B |
A19 | ECOSORB® acrylamide analysis (Polymex laboratory, 2024) | B |
A20 | EVERGREEN® REACH / SVHC screening (SGS, 2023) | B |
A21 | ECOFERT® certificate (SOHISCERT, EU Bio) | A |
A22 | Paulownia ALTIFOLIA® sheet figures (website) | C |
Annex B. Calculation method
1. Agricultural water. Total withdrawals (950 Mm³, 2022) × agricultural share (51.65%) = 490.6 Mm³.
2. Irrigation. The equipped area (91,239 ha) and agricultural water are shared between irrigated groups (vegetables and melons, potato, date palm, citrus, other fruit and other irrigated land) in proportion to their harvested areas (91,239 ha), without exceeding each group's harvested area. Our sources have no irrigation statistic by crop. Other crops are treated as rainfed and receive no irrigation water in the calculation. The equipped area exceeds the harvested area of the irrigable crops retained: The difference forms an "other irrigated land" group (irrigated olives, fodder, irrigated cereals), with the generic assumption. Olives and cereals are otherwise treated as rainfed for the rest of their area.
3. Scenarios. Water saved = group water × trial effect: A quarter (cautious), half (central), all of it (high). Without a trial: 5, 10 and 20%.
4. Extra hectares. Water saved ÷ water per equipped hectare (5,377 m³/ha).
6. Value of water. Three assumed prices (0.10; 0.22 and 0.45 $/m³); no national tariff was adopted.
7. Fertilisers. Minimum spending = nitrogen ÷ 0.46 × urea price + phosphate ÷ 0.46 × TSP price + potash ÷ 0.60 × potassium chloride price (A7).
8. Climate. Rainfall, reference evapotranspiration (FAO-56) and temperature: 1991-2020 means of the NASA POWER grid cell containing each city; radiation: PVGIS, 2005-2020. Temperature trends are linear regressions over 1981-2024. NASA POWER combines reanalyses and satellite data on a grid of about 50 km: Two nearby cities can share the same cell, and its rainfall can differ from local station records. On the maps, each governorate is coloured according to the value of its reference town.
9. Trade. Totals are those of the FAOSTAT crops and livestock line; products are listed one by one, without aggregates. Rice amounts add husked rice, broken rice and milled rice.
Annex C. Photo credits
File (Wikimedia Commons) | Author | Licence |
|---|---|---|
Wheat fields in Al-Taybeh District 01.jpg | Mohammad hajeer | CC BY-SA 4.0 |
Aidoun heights at Irbid Governorate Northern Jordan. 07.jpg | Sana Janakat | CC BY-SA 4.0 |
Wheat fields in Al Mashargah 04.jpg | Mohammad hajeer | CC BY-SA 4.0 |
Jordan, Wadi Rum Desert, Rock Formations.jpg | Vyacheslav Argenberg | CC BY 4.0 |
King Abdalla I Canal 2.jpg | Freedom's Falcon | CC BY-SA 3.0 |
Jordanien Wadi Mujib 02.JPG | Zairon | CC BY-SA 3.0 |
A collection of landscape views from Sakib, a town in Jerash, Jordan 0 | Ibrahim Ayasra | CC BY 4.0 |
Aqaba, pěstování zeleniny.jpg | I would appreciate being notified if you use m | CC BY-SA 4.0 |
Tafilah, Jordan3994.JPG | יעקב | CC BY-SA 4.0 |
Amman BW 26.JPG | Berthold Werner | CC BY 3.0 |
Amman fruit and vegetables market 02.jpg | Davide Mauro | CC BY-SA 4.0 |
Jordanien Wadi Mujib 03.JPG | Zairon | CC BY-SA 3.0 |
9 Umm Qais (3) (13252490343).jpg | Xorge | CC BY-SA 2.0 |
Source: Photos published on Wikimedia Commons, colour-adjusted and sharpened, used under their licence.
حدّثونا عن قطعتكم
المحصول، وأسلوب الري، وطبيعة التربة، وحجم المياه المستهلك اليوم. نعود إليكم بتركيبة التقنيات المناسبة، والجرعات، والتجارب التي أُجريت في أوضاع مشابهة.
التواصل الأول لا يرتّب أي التزام.
حدّثونا عن قطعتكمcontact@green-solutions-group.com · Green Solutions Groupe AIM SA, 46, route de la Condémine, 1475 Forel, Switzerland
اعتمادات الصور
- User:Issagm — CC BY-SA 3.0, « Farm, Al-Hisn, Jordan »
- Omarbrodsd — CC BY-SA 4.0, « Irbid Farm 2026 »
صور من ويكيميديا كومنز، معاد استخدامها وفق تراخيصها.