دراسة سوق
مصر
جمهورية مصر العربية
زراعة مروية بالكامل تعتمد على نهر واحد وحصة مائية ثابتة.
ما الذي يغيّره احتباس الماء في التربة لمنتج يصدّر إلى أوروبا والخليج.
Foreword
This dossier describes Egypt from the angle of water, climate, fertilisers and crops. It is written for the ministries in charge of agriculture, water and trade, the regional directorates of agriculture, cooperatives and producer organisations. It answers three questions: Where is water short, for which crops, and in which regions? It then examines what our products can change, in rainfed as well as irrigated farming, and what that can mean for the country's external trade.
Reading the sources. Every figure refers to a source, named in the text and detailed in Annex A. Each source carries a confidence level:
Summary
The points below summarise the dossier. The figures come from public sources: The World Bank, FAO (FAOSTAT, AQUASTAT), Egyptian public bodies (CAPMAS, Ministry of Agriculture and Land Reclamation), PVGIS and ERA5. The production gains and water savings are scenarios, described in Annex B.
118.37 M Inhabitants in 2025 (World Bank) | 1.39 M ha Of wheat harvested in 2024, the main crop | 4.01 M ha Equipped for irrigation (2024) |
9,469 Mm³ Of irrigation water saved a year, central scenario | 10,014 M$ Of agricultural exports in 2024 (FAOSTAT) |
Key figures
Key indicators for Egypt
Indicator | Value | Year | Source (level) |
|---|---|---|---|
Population | 118.37 M | 2025 | World Bank (A1) |
GDP per capita | 3,086 $ | 2025 | World Bank (A1) |
Agriculture share of GDP | 16.6% | 2025 | World Bank (A1) |
Agricultural employment | 17.5% | 2025 | World Bank (A1) |
Cropland | 4,229,000 ha | 2024 | FAOSTAT (A6) |
Area equipped for irrigation | 4,013,710 ha | 2024 | FAOSTAT (A6) |
Harvested area: Wheat | 1,386,892 ha | 2024 | FAOSTAT (A2) |
Certified organic cropland | 115,490 ha | 2024 | FAOSTAT (A6) |
Agricultural exports | 10,014 M$ | 2024 | FAOSTAT (A4) |
Agricultural imports | 18,981 M$ | 2024 | FAOSTAT (A4) |
Mineral nitrogen, agricultural use | 1,586,809 t | 2024 | FAOSTAT (A5) |
Source: Table based on the sources indicated.
1. Green Solutions and our products
Green Solutions develops products for water, fertilisation and crop protection. Four families are of interest to this dossier. The yields cited are those published by the manufacturer or by the trials, with their confidence level.
Products covered by this dossier
Product | Claimed use | Published evidence (level) |
|---|---|---|
EVERGREEN® (water-retention polymer) | Holds rain or irrigation water as a gel, near the roots. | Trials on maize, potato, watermelon, date palm and soybean. Level B to C. |
ECOSORB® (water-retention polymer based on corn starch) | Same use; action lasting 2 to 3 years according to the website. | Soybean trial (China); laboratory acrylamide analysis. Level B to C. |
ECOFERT® (fertiliser) | Fertiliser certified by SOHISCERT and EU Bio, usable in organic farming. | Published certificate; potato trial combined with EVERGREEN®. Level A (certificate), C (results). |
Paulownia ALTIFOLIA® | Fast-growing tree for agroforestry. | Website figures; no trial in Egypt. Level C. |
Water Vital®, NAPEMA® | Outside the scope of this dossier. | No independent source in the documents consulted. |
Source: Green Solutions website (product sheets and published trials), Annex A.
The indicative dose published on the website is 30 to 75 kg/ha.
2. Egypt in figures
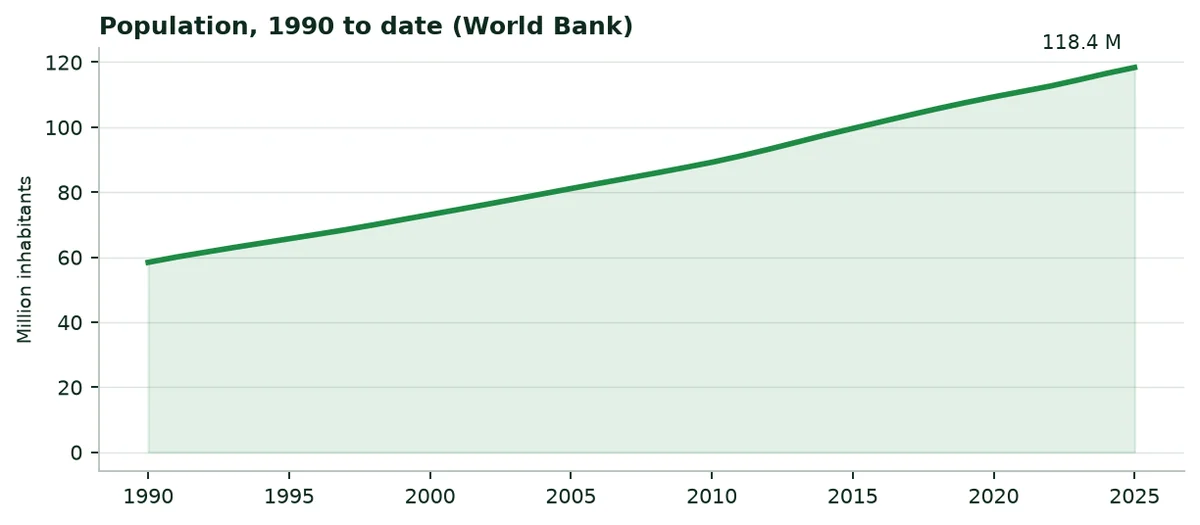
Egypt had 118.37 million inhabitants in 2025, 57% of them in rural areas. Agriculture accounts for 16.6% of gross domestic product and employs 18% of the labour force. The country covers 995.5 thousand km², of which 4% is agricultural land. Undernourishment affects 8.4% of the population.
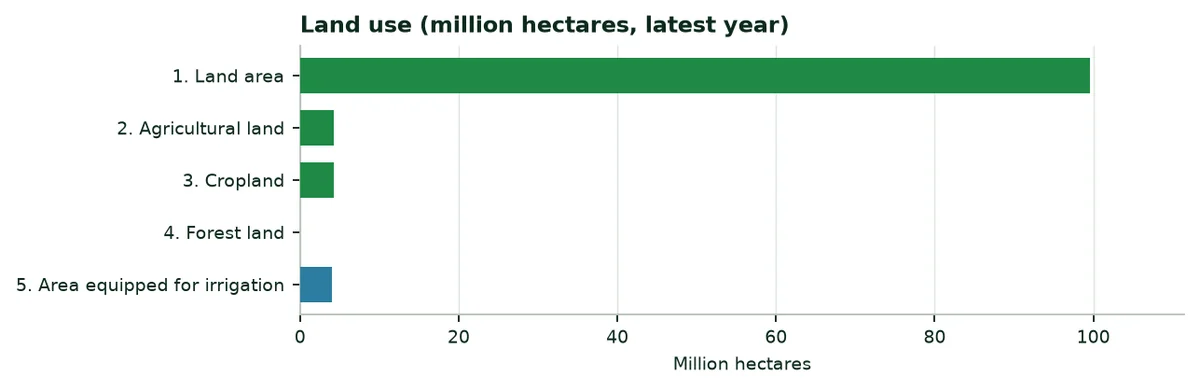
Agricultural and water indicators, latest year published
Indicator | Value | Year | Source |
|---|---|---|---|
Cropland certified organic | 115,490 ha | 2024 | FAOSTAT (A6) |
Average cereal yield | 7,360 kg/ha | 2024 | World Bank (A1) |
Fertiliser use per hectare of arable land | 597.8 kg/ha | 2024 | World Bank (A1) |
Water withdrawals, agricultural share | 79.2% | 2022 | World Bank (A1) |
Internal freshwater resources | 1.0 km³ | 2022 | World Bank (A1) |
Internal resources per inhabitant | 9 m³ | 2022 | World Bank (A1) |
3. Sunshine, rainfall and climate change
3.1 Sunshine
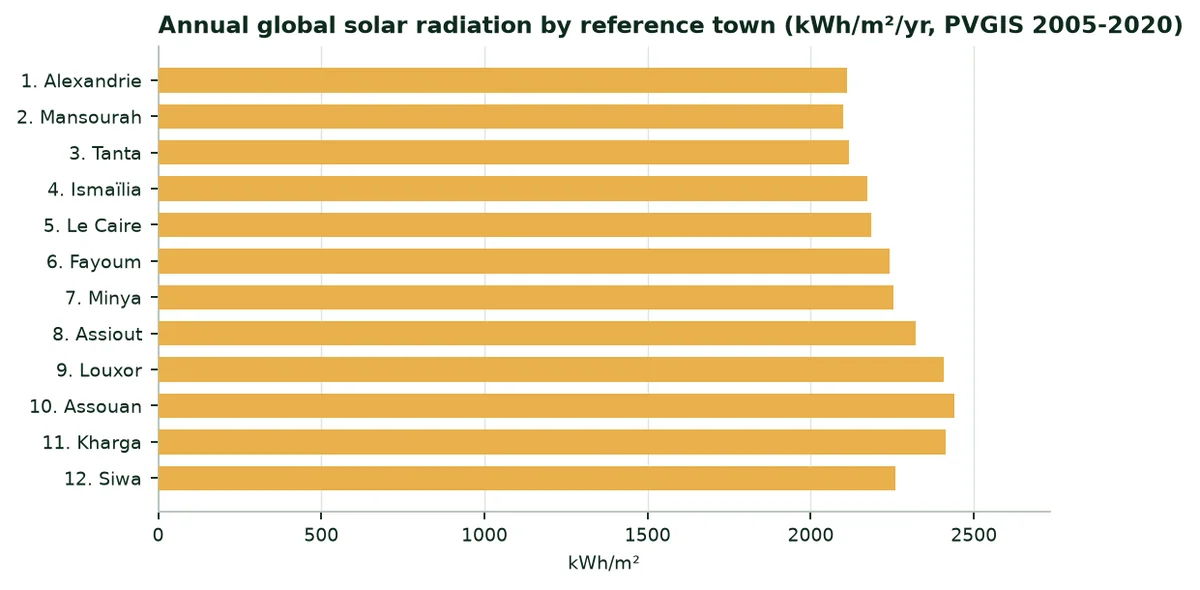
Global solar radiation reaches 2,101 to 2,440 kWh/m² a year depending on the region. Energy is not the limit: Water available at the right time makes the harvest.
3.2 Rainfall and evapotranspiration
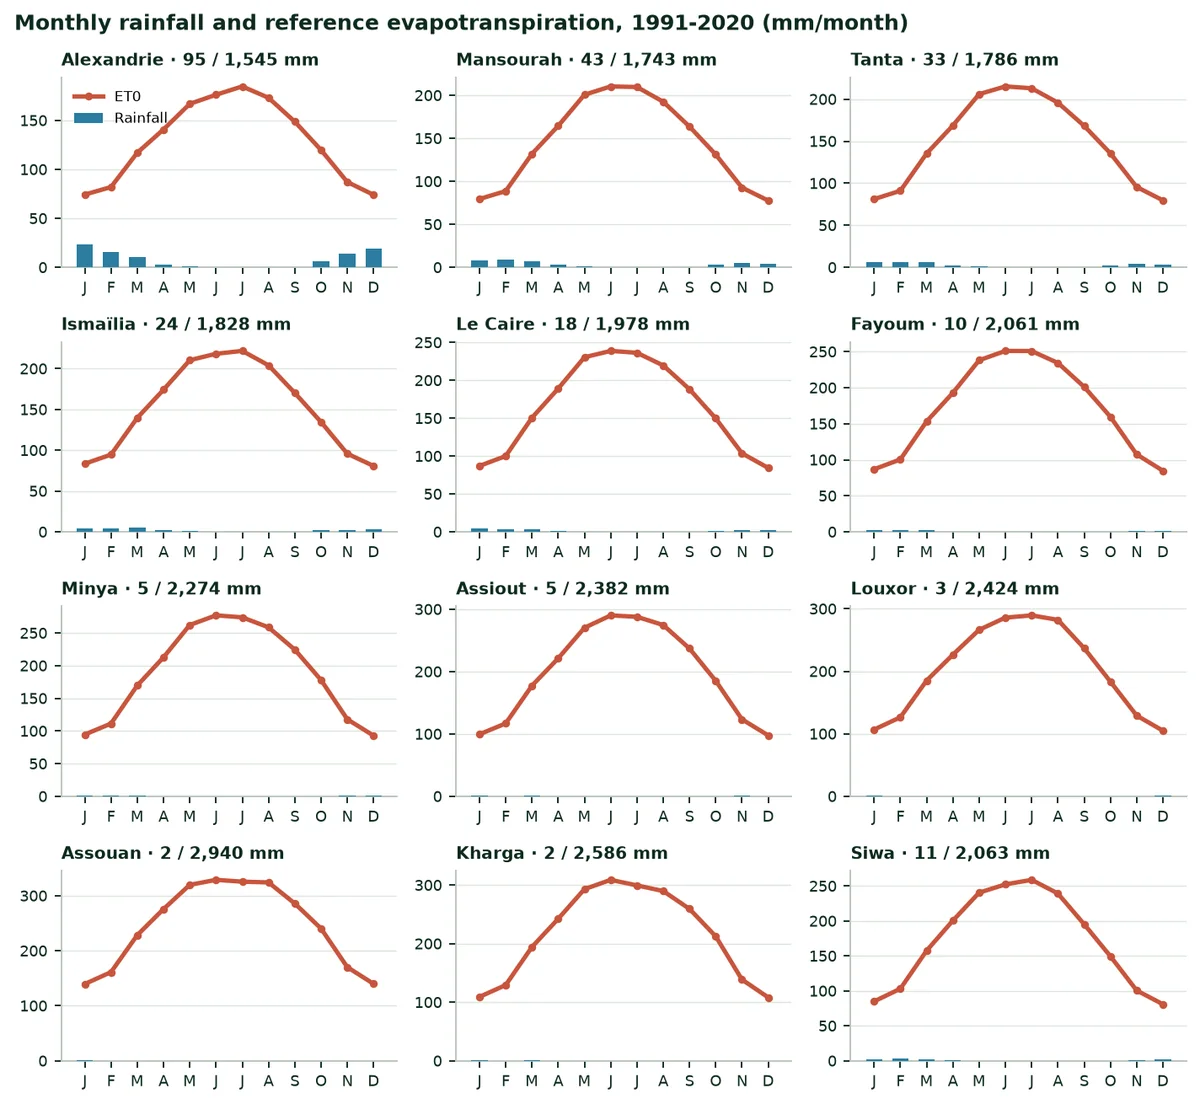
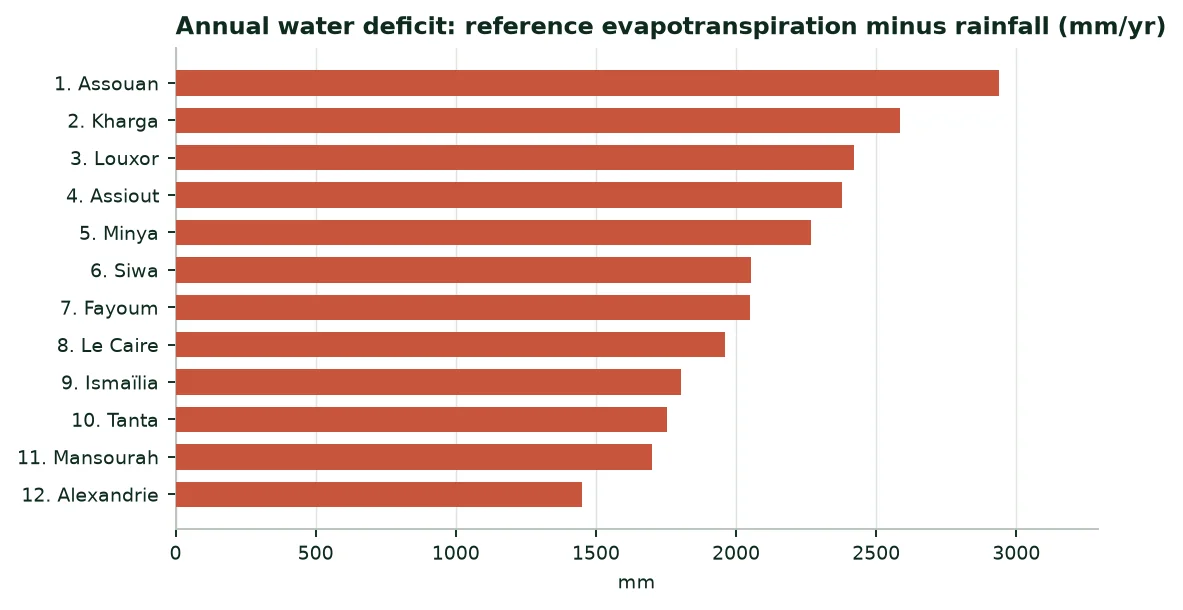
It rains 95 mm a year at Alexandrie, but only 2 mm at Assouan, where reference evapotranspiration reaches 2,940 mm. Rain is almost limited to the north coast, between autumn and spring; further south it is negligible and farming lives on irrigation. Summer is hot everywhere and the heat of Upper Egypt is the strongest.
Mean monthly rainfall, 1991-2020 (mm per month)
City | Jan | Feb | Mar | Apr | May | Jun | Jul | Aug | Sep | Oct | Nov | Dec |
|---|---|---|---|---|---|---|---|---|---|---|---|---|
Alexandrie | 24 | 16 | 11 | 3 | 1 | 0 | 0 | 0 | 1 | 6 | 14 | 19 |
Mansourah | 8 | 9 | 7 | 3 | 1 | 0 | 0 | 0 | 0 | 3 | 6 | 4 |
Tanta | 7 | 7 | 6 | 2 | 1 | 0 | 0 | 0 | 0 | 2 | 4 | 4 |
Ismaïlia | 4 | 4 | 6 | 2 | 1 | 0 | 0 | 0 | 0 | 2 | 2 | 3 |
Le Caire | 4 | 4 | 4 | 1 | 0 | 0 | 0 | 0 | 0 | 1 | 2 | 2 |
Fayoum | 2 | 2 | 3 | 0 | 0 | 0 | 0 | 0 | 0 | 0 | 1 | 1 |
Minya | 1 | 1 | 2 | 0 | 0 | 0 | 0 | 0 | 0 | 0 | 1 | 1 |
Assiout | 1 | 0 | 2 | 0 | 0 | 0 | 0 | 0 | 0 | 0 | 1 | 0 |
Louxor | 1 | 0 | 0 | 0 | 0 | 0 | 0 | 0 | 0 | 0 | 0 | 1 |
Assouan | 0 | 0 | 0 | 0 | 0 | 0 | 0 | 0 | 0 | 0 | 0 | 0 |
Kharga | 0 | 0 | 1 | 0 | 0 | 0 | 0 | 0 | 0 | 0 | 0 | 0 |
Siwa | 2 | 3 | 2 | 1 | 0 | 0 | 0 | 0 | 0 | 0 | 0 | 2 |
Source: ERA5 via Open-Meteo (A9); author's calculation.
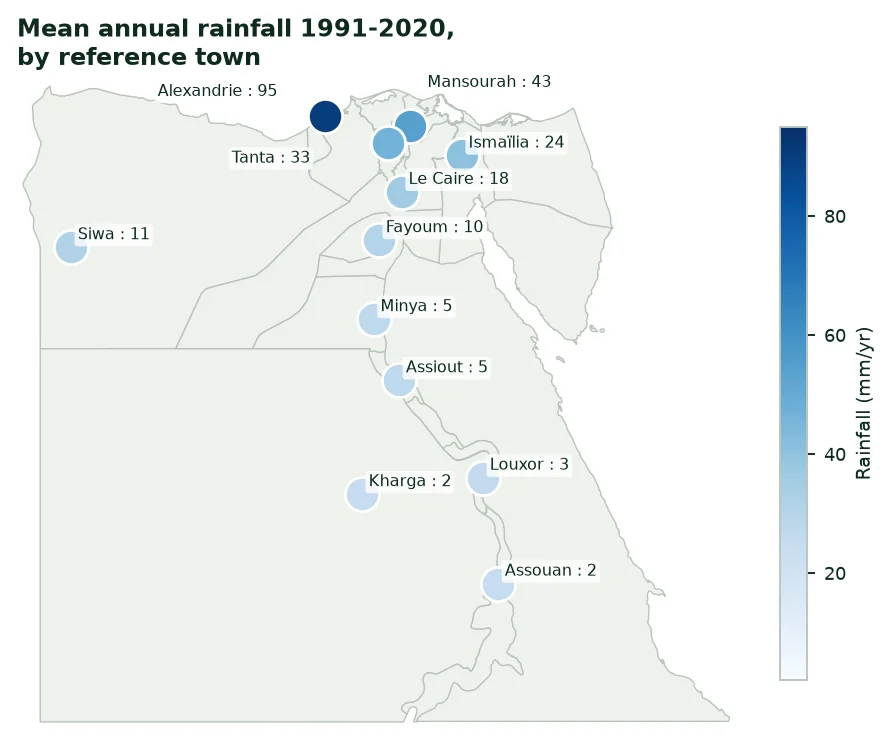 | 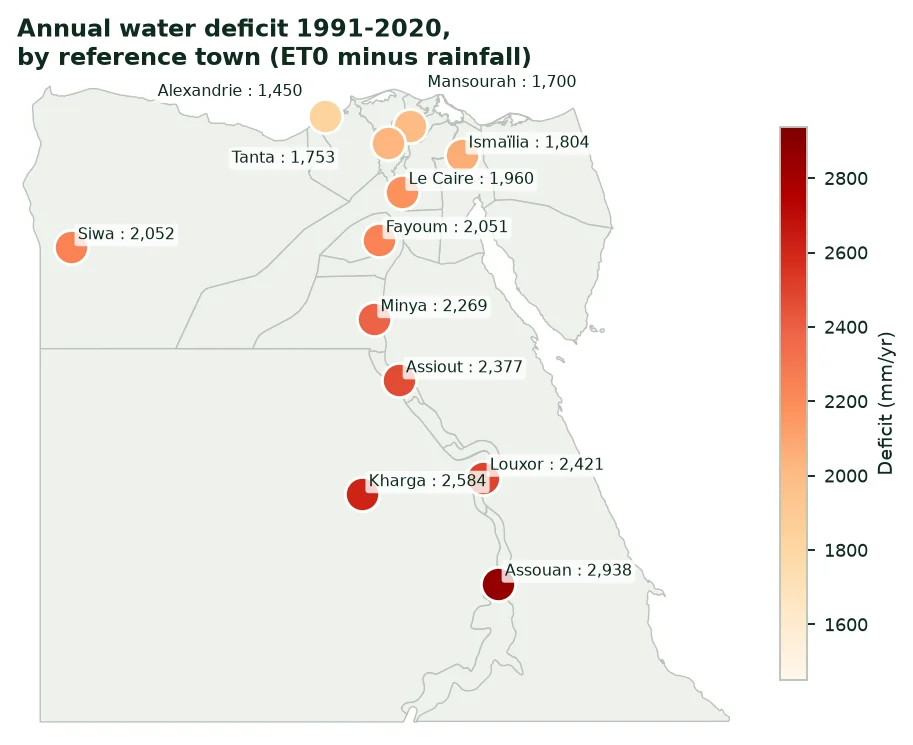 |
|---|
3.3 Climate change
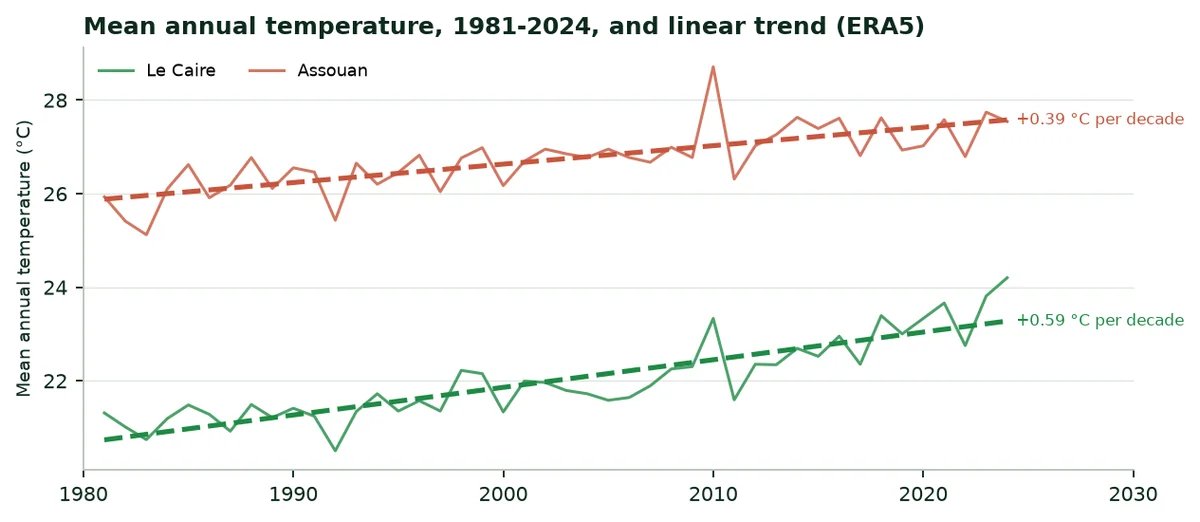
Mean annual temperature is rising. At Le Caire it went from 21.3 °C in 1981 to 24.2 °C in 2024, a trend of 0.59 °C per decade. At Assouan the trend is 0.39 °C per decade, from 25.9 °C to 27.5 °C. Warmer air dries the soil faster between two rains.
4. Water: Resources, irrigated areas, withdrawals
4.1 Resources and withdrawals
Total freshwater withdrawals are 77,500 million m³ a year (2022). Agriculture withdraws 79.2% of it, that is 61,350 Mm³. Internal resources are 1.0 km³ a year and water stress is 141.2%: The resource is already heavily used: Every cubic metre kept in the soil counts.
Freshwater: Withdrawals and resources
Indicator | Value | Year | Source |
|---|---|---|---|
Total withdrawals | 77,500 Mm³ | 2022 | World Bank (A1) |
Agricultural share | 79.2% | 2022 | World Bank (A1) |
Agricultural withdrawals | 61,350.0 Mm³ | 2022 | Calculated from A1 |
Area equipped for irrigation | 4,013,710 ha | 2024 | FAOSTAT (A6) |
Agricultural withdrawals per equipped hectare | 15,285 m³/ha | — | Calculation (Annex B) |
Water stress | 141.2% | 2022 | World Bank (A1) |
4.2 Irrigated areas
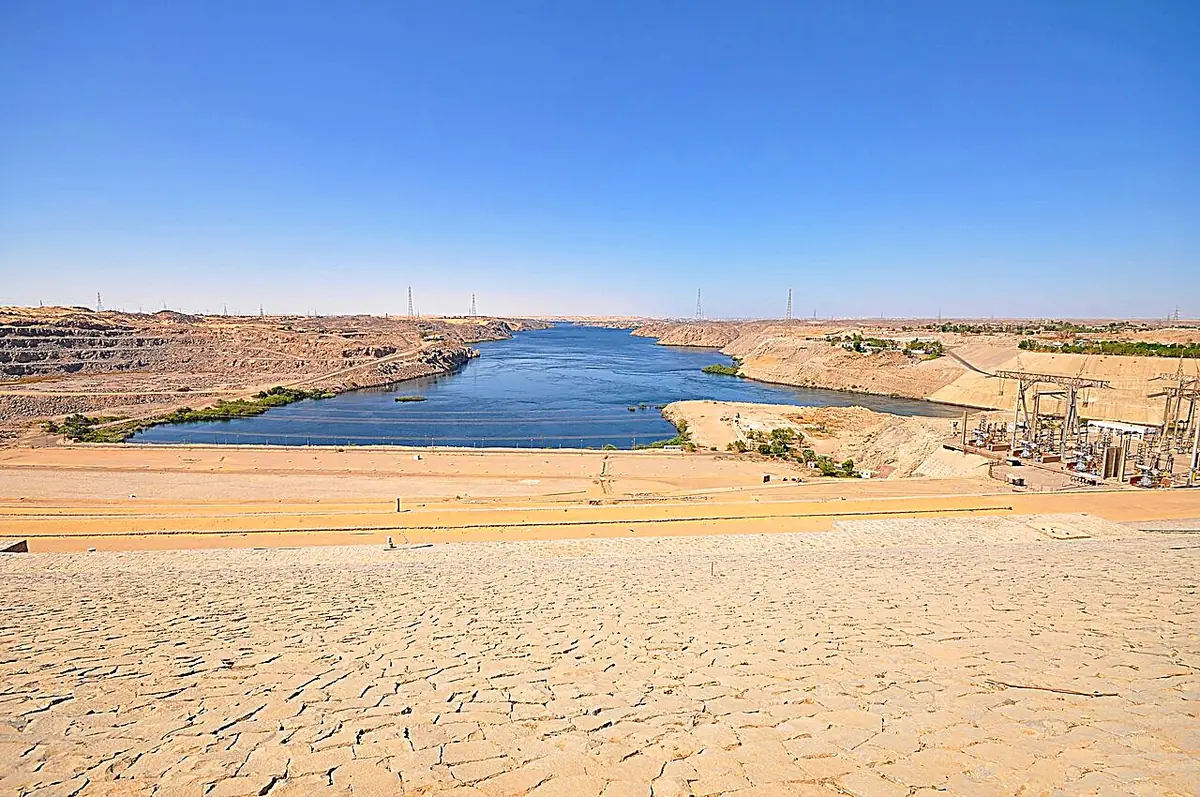
FAOSTAT counts 4,013,710 hectares equipped for irrigation in 2024. FAO estimated the irrigation potential at 4,435,000 ha in 1993, for 3,246,000 ha equipped, of which 3,046,000 ha under surface irrigation (A11). Egypt receives 55.5 km³ a year from the Nile under the 1959 agreement with Sudan (A11). Water is therefore a quantity fixed by treaty: Hectares won from the desert are paid for with water saved elsewhere.
4.3 What the water saving represents
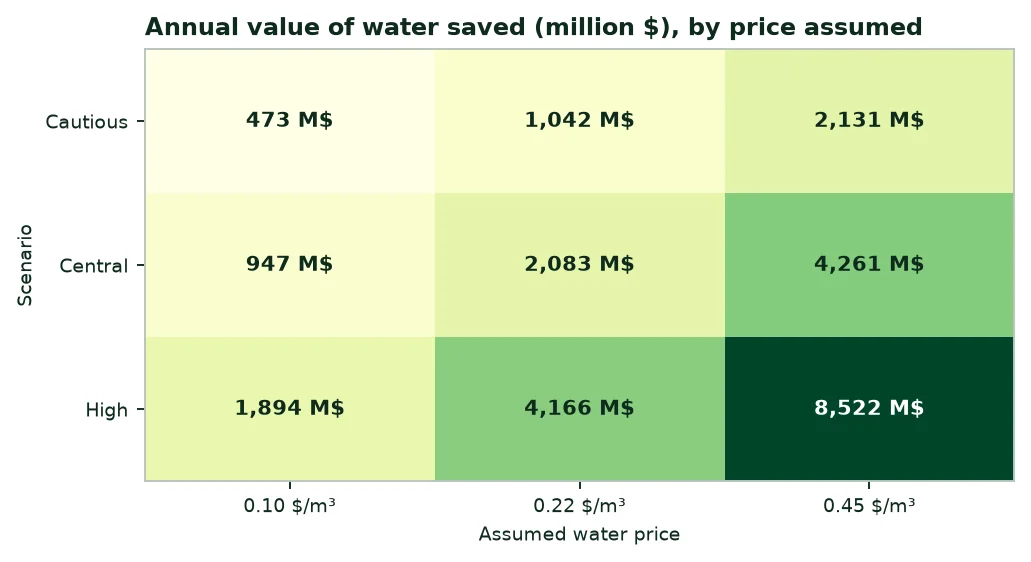
In the central scenario, the saving is 9,469.0 million m³ a year, or 15.4% of agricultural withdrawals. At 15,285 m³ per equipped hectare, this water would irrigate about 619,489 more hectares, or 15.4% of today's equipped area.
5. Fertilisers: Quantities, purchases, spending
5.1 Quantities used
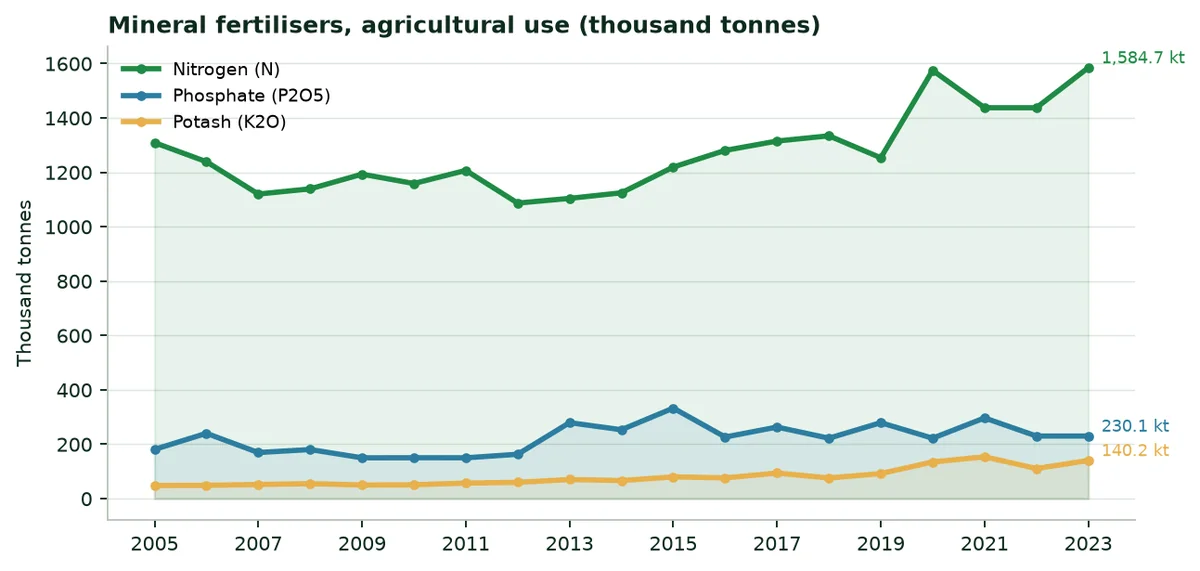
In 2024, agricultural use reaches 1,586,809 tonnes of nitrogen, 230,114 tonnes of phosphate (P2O5) and 140,200 tonnes of potash (K2O). The country produces 3,198,000 tonnes of nitrogen and 230,114 tonnes of phosphate (P2O5); it imported 23,852 tonnes of nitrogen in the same year. Per hectare of arable land, use is 597.8 kg per hectare.
5.2 Regulatory framework
A fertiliser and soil conditioner control department exists at the Soil, Water and Environment Research Institute, and the Egyptian standards body publishes standards in the field (A13). The exact registration procedure for a water-retaining polymer was not found.
5.3 Indicative spending
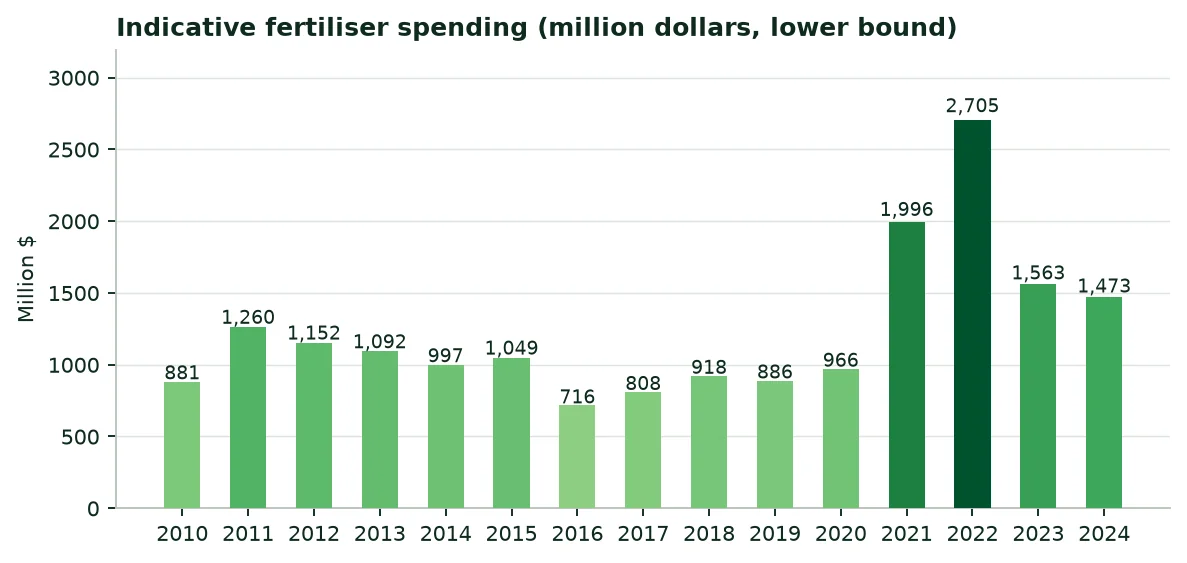
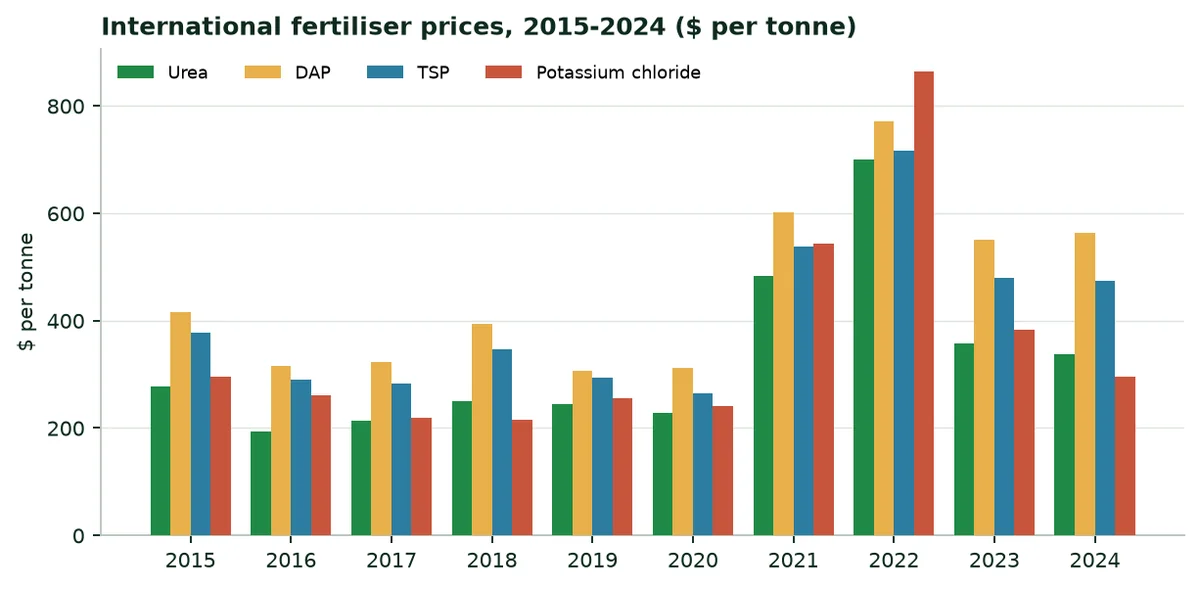
In 2024, the indicative minimum spending on mineral fertilisers reaches $1,473 million, at international fertiliser prices (calculation in Annex B, lower bound).
6. The regions at a glance
The table compares twelve reference towns, from the Mediterranean coast to Aswan. Climate figures are 1991-2020 averages, except radiation (2005-2020).
Climate of the capitals, 1991-2020 means
Region (city) | Rainfall (mm/yr) | ET0 (mm/yr) | Deficit (mm/yr) | Radiation (kWh/m²/yr) | Temperature (°C) |
|---|---|---|---|---|---|
Alexandria (Alexandrie) | 95 | 1,545 | 1,450 | 2,110 | 20.5 |
Mansoura (Mansourah) | 43 | 1,743 | 1,700 | 2,101 | 21.3 |
Tanta (Tanta) | 33 | 1,786 | 1,753 | 2,116 | 21.4 |
Ismailia (Ismaïlia) | 24 | 1,828 | 1,804 | 2,175 | 21.3 |
Cairo (Le Caire) | 18 | 1,978 | 1,960 | 2,186 | 22.0 |
Faiyum (Fayoum) | 10 | 2,061 | 2,051 | 2,241 | 22.7 |
Minya (Minya) | 5 | 2,274 | 2,269 | 2,254 | 23.1 |
Asyut (Assiout) | 5 | 2,382 | 2,377 | 2,323 | 23.8 |
Luxor (Louxor) | 3 | 2,424 | 2,421 | 2,406 | 25.3 |
Aswan (Assouan) | 2 | 2,940 | 2,938 | 2,440 | 26.8 |
Kharga (Kharga) | 2 | 2,586 | 2,584 | 2,414 | 23.7 |
Siwa (Siwa) | 11 | 2,063 | 2,052 | 2,260 | 21.7 |
Source: ERA5 via Open-Meteo (A9); PVGIS (A8); author's calculation.
7. The twenty main crops: Three rankings
7.1 By harvested area
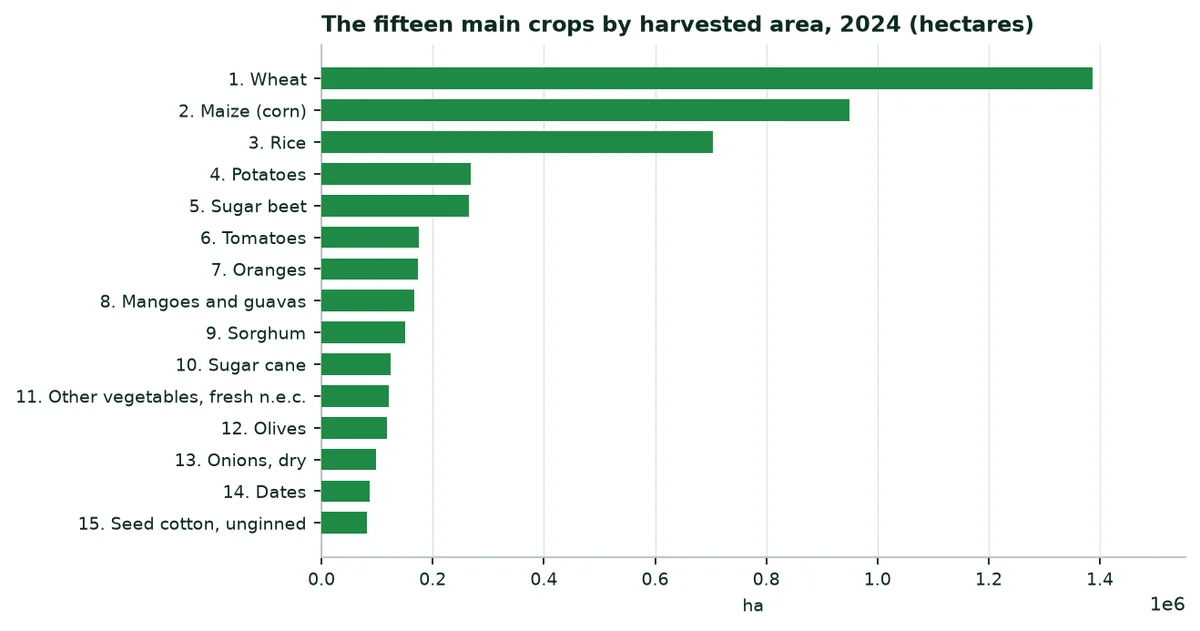
The ten main crops by area, 2024
Crop | Harvested area (ha) | Production (t) | Yield (t/ha) |
|---|---|---|---|
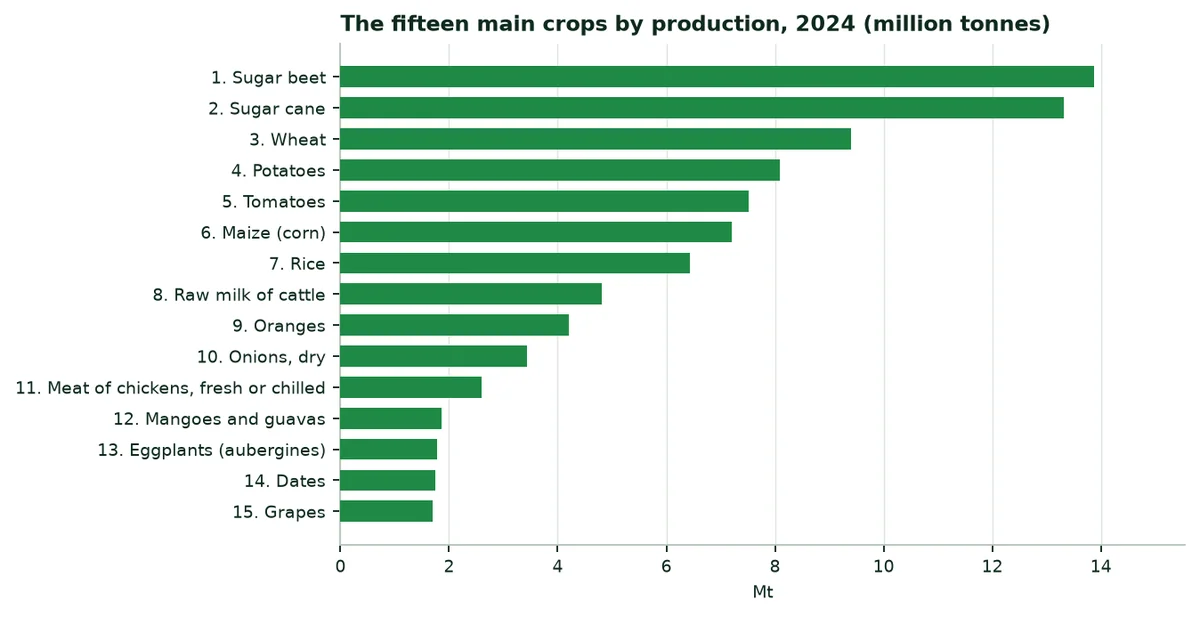
Wheat | 1,386,892 | 9,400,000 | 6.78 |
Maize (corn) | 950,000 | 7,206,000 | 7.59 |
Rice | 704,158 | 6,430,000 | 9.13 |
Potatoes | 268,565 | 8,082,291 | 30.09 |
Sugar beet | 264,840 | 13,880,842 | 52.41 |
Tomatoes | 175,397 | 7,521,071 | 42.88 |
Oranges | 173,711 | 4,200,000 | 24.18 |
Mangoes and guavas | 167,276 | 1,863,396 | 11.14 |
Sorghum | 150,000 | 780,000 | 5.20 |
Sugar cane | 124,299 | 13,314,260 | 107.11 |
Source: FAOSTAT (A2).
7.2 By production
7.3 By production value
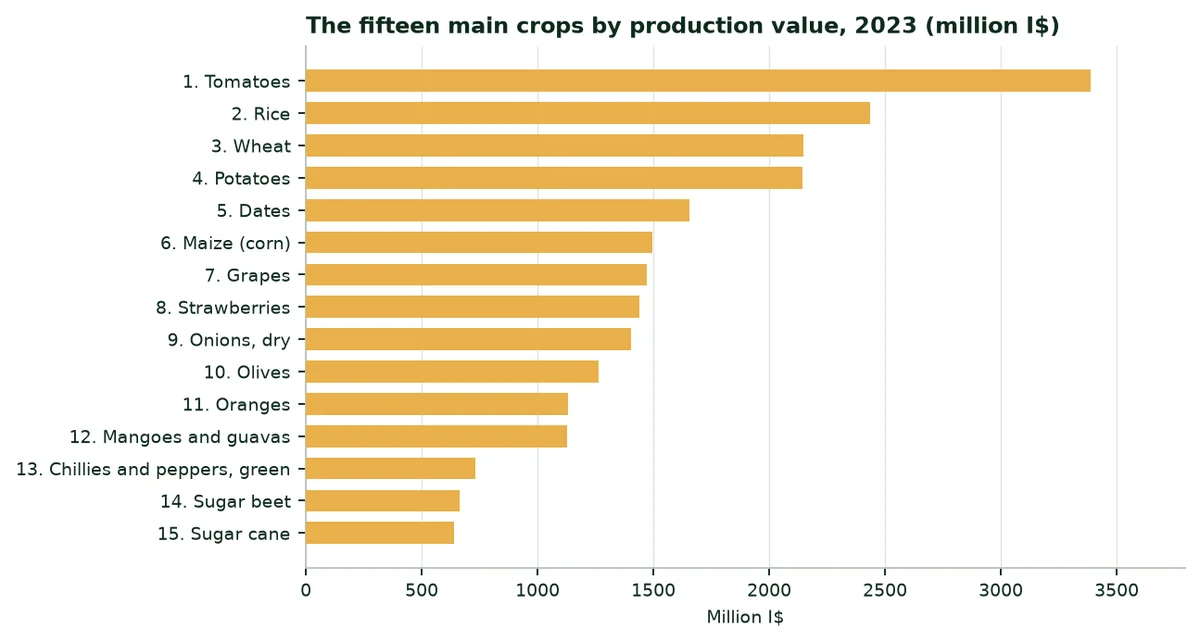
By production value, the three main crops are: Tomatoes, rice and wheat (FAOSTAT, 2023, constant international dollars).
8. Extrapolation by crop: Irrigation and rainfed crops
8.1 Method
8.2 Trials used as analogues
Trials cited and their use in the calculation
Trial | Crop | Water | Yield | Use in the calculation |
|---|---|---|---|---|
Maize, Türkiye (TIGEM, Konya, 2025) | Maize | -38.9% | +17.1% | Maize: Water and yield |
Soybean, China | Soybean | Assumption | +11.3% | Not used; cited for reference |
Watermelon, Mexico (2023) | Watermelon | -60.5% | +30.0% | Vegetables and melons: Water and yield |
Potato, South Africa (2025) | Potato | -52.0% | +31.4% | Potato: Water and yield |
Date palm, UAE (ICBA, 2021) | Palm | -82.0% | +20.0% | Date palm: Water and yield |
Source: A14 to A18 (published trials and manufacturer's website, levels B and C).
No trial has yet been conducted in Egypt: The figures below apply the trials cited to the country's average yields.
8.3 Irrigation: Wheat, barley, sorghum, Maize, Rice and Sugar cane and sugar beet
Equipped area assigned, trial used and water saved (central scenario)
Crop group | Equipped area (ha) | Share | Trial or assumption | Water saved (Mm³/yr) |
|---|---|---|---|---|
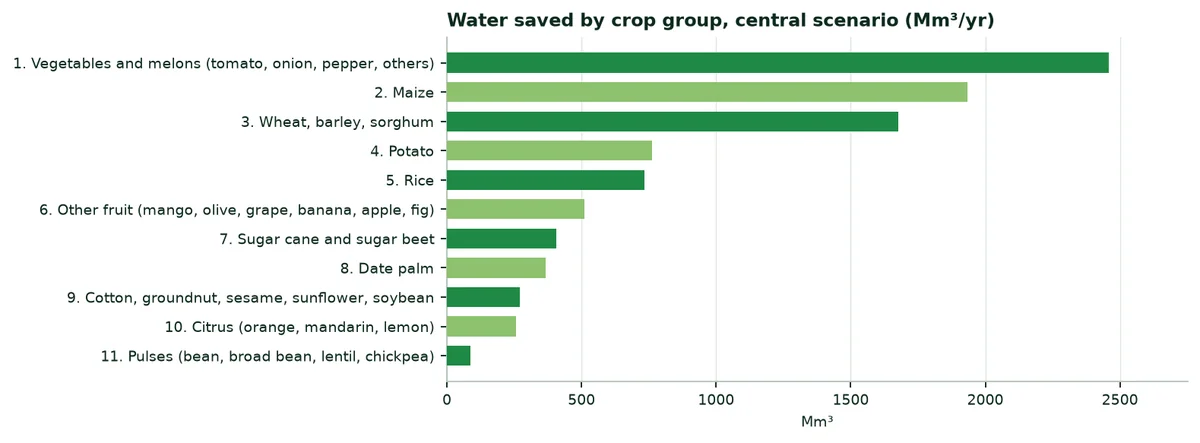
Wheat, barley, sorghum | 1,097,429 | 27.3% | Generic assumption, no trial | 1,677.4 |
Maize | 648,857 | 16.2% | Maize, Türkiye (TIGEM, 2025) | 1,934.0 |
Rice | 480,945 | 12.0% | Generic assumption, no trial | 735.1 |
Sugar cane and sugar beet | 265,785 | 6.6% | Generic assumption, no trial | 406.3 |
Potato | 191,620 | 4.8% | Potato, South Africa (2025) | 761.5 |
Vegetables and melons (tomato, onion, pepper, others) | 531,455 | 13.2% | Watermelon, Mexico (2023) | 2,457.3 |
Citrus (orange, mandarin, lemon) | 168,291 | 4.2% | Generic assumption, no trial | 257.2 |
Date palm | 58,703 | 1.5% | Date palm, UAE (ICBA, 2021) | 367.9 |
Other fruit (mango, olive, grape, banana, apple, fig) | 335,085 | 8.3% | Generic assumption, no trial | 512.2 |
Cotton, groundnut, sesame, sunflower, soybean | 178,075 | 4.4% | Generic assumption, no trial | 272.2 |
Pulses (bean, broad bean, lentil, chickpea) | 57,464 | 1.4% | Generic assumption, no trial | 87.8 |
Source: Author's calculation (Annex B).
Water saved, extra irrigable hectares and production gain, by scenario
Scenario | Water (Mm³/yr) | Extra hectares | Production (t/yr) |
|---|---|---|---|
Cautious | 4,734.5 | 309,745 | 1,800,785 |
Central | 9,469.0 | 619,489 | 3,601,569 |
High | 18,937.9 | 1,238,979 | 7,203,139 |
Source: Author's calculation (Annex B).
8.4 Reading the results
9. Potential benefits of our products
The table lists what the products may bring according to the documents available, with their confidence level and their limit.
Potential benefits, by situation
Benefit | Published figures | Source (level) | Limit |
|---|---|---|---|
Irrigation water saving | Date palm −82%; watermelon −60.5%; potato −52%; maize −38.9% | A14 to A18 (B, C) | One trial per crop; none in Egypt |
Yield | Maize +17.1%; potato +31.4%; watermelon +30%; date palm +20%; soybean +11.2 to +11.4% | A14 to A18 (B, C) | Trials conducted under irrigation or in other climates |
Organic farming (ECOFERT®) | Certified by SOHISCERT and EU Bio | A21 (A) | Valid for the certified product |
Safety: Acrylamide (ECOSORB®) | Below 3.0 µg/g | A19 (B) | One laboratory, one date |
REACH compliance (EVERGREEN®) | ≤ 0.1% of substances of very high concern in 233 substances tested | A20 (B) | Screening, not an approval |
Agroforestry (Paulownia ALTIFOLIA®) | 13 to 15 m in 6 to 8 years (website) | A22 (C) | No trial in Egypt |
Source: Annex A.
10. External trade: Exports, imports, importing
10.1 Overview, 2023 and 2024
Agricultural products and total merchandise trade (million $)
Indicator | 2023 | 2024 |
|---|---|---|
Agricultural exports (crops and livestock) | 8,732 | 10,014 |
Agricultural imports (crops and livestock) | 17,641 | 18,981 |
Exports, all merchandise | 39,853 | 42,137 |
Imports, all merchandise | 78,895 | 86,333 |
Source: FAOSTAT (A4).
10.2 Exports
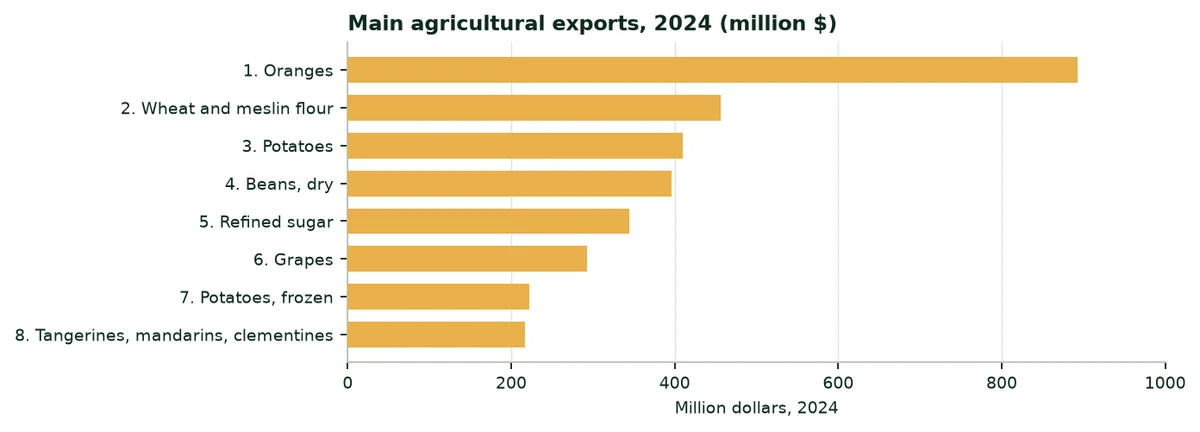
The three main farm products exported in 2024 are: Oranges ($893 million), wheat and meslin flour ($456 million) and potatoes ($410 million).
10.3 Imports
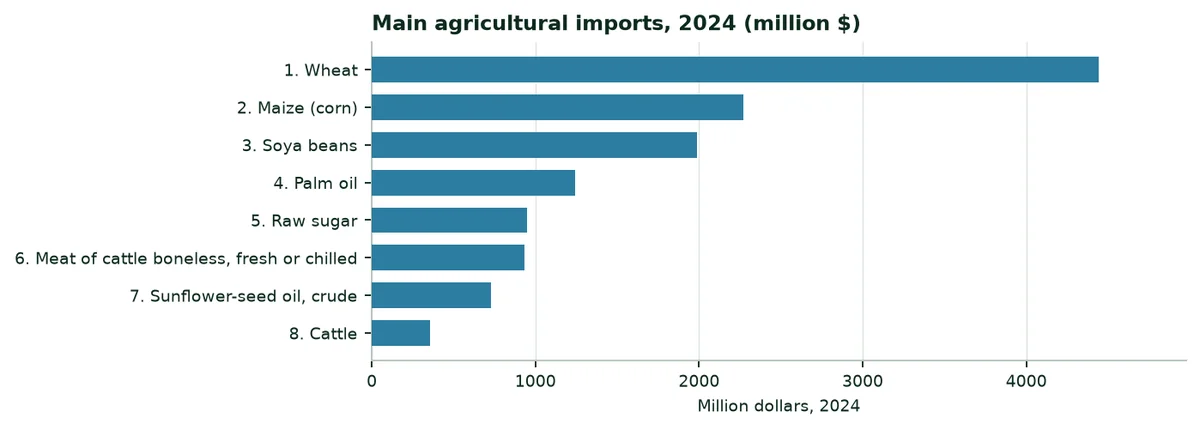
The main farm purchases are: Wheat ($4,443 million), maize (corn) ($2,272 million) and soya beans ($1,989 million).
 |  |
|---|
10.4 Importing water-retention polymers into Egypt
11. A study of each region
Each region is described through the city that represents it. The figures describe the climate; the water deficit (evapotranspiration minus rainfall) shows where water is most short. The description of crops is qualitative.
Alexandria (Alexandrie)
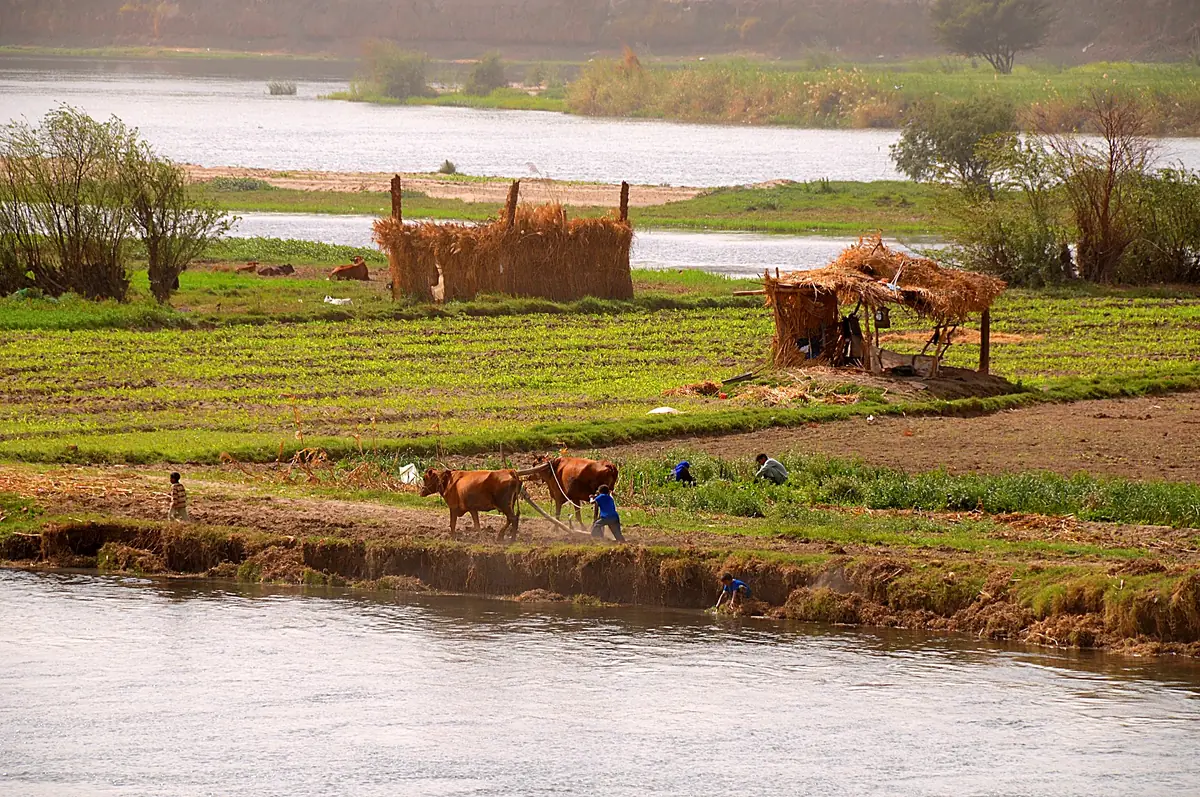
The north coast: The only region to receive rain, in winter; market gardening, orchards, olive and vines on the sandy soils of reclaimed desert land.
Indicator | Value |
|---|---|
Annual rainfall, 1991-2020 | 95 mm |
Reference evapotranspiration | 1,545 mm |
Annual water deficit | 1,450 mm |
Months with less than 50 mm of rain | 12 |
Global solar radiation | 2,110 kWh/m² |
Mean temperature | 20.5 °C |
Source: ERA5 via Open-Meteo (A9); PVGIS (A8); author's calculation.
Mansoura (Mansourah)
The eastern Delta: Rice, maize, cotton, vegetables and citrus, on small farms watered by a dense network of canals.
Indicator | Value |
|---|---|
Annual rainfall, 1991-2020 | 43 mm |
Reference evapotranspiration | 1,743 mm |
Annual water deficit | 1,700 mm |
Months with less than 50 mm of rain | 12 |
Global solar radiation | 2,101 kWh/m² |
Mean temperature | 21.3 °C |
Source: ERA5 via Open-Meteo (A9); PVGIS (A8); author's calculation.
Tanta (Tanta)
The heart of the Delta: Wheat, rice, maize, berseem clover, cotton and onion; the oldest and most intensive land in the country.
Indicator | Value |
|---|---|
Annual rainfall, 1991-2020 | 33 mm |
Reference evapotranspiration | 1,786 mm |
Annual water deficit | 1,753 mm |
Months with less than 50 mm of rain | 12 |
Global solar radiation | 2,116 kWh/m² |
Mean temperature | 21.4 °C |
Source: ERA5 via Open-Meteo (A9); PVGIS (A8); author's calculation.
Ismailia (Ismaïlia)
The Suez Canal zone: Citrus, mango and new-land crops, irrigated from the freshwater canal.
Indicator | Value |
|---|---|
Annual rainfall, 1991-2020 | 24 mm |
Reference evapotranspiration | 1,828 mm |
Annual water deficit | 1,804 mm |
Months with less than 50 mm of rain | 12 |
Global solar radiation | 2,175 kWh/m² |
Mean temperature | 21.3 °C |
Source: ERA5 via Open-Meteo (A9); PVGIS (A8); author's calculation.
Cairo (Le Caire)
The Delta apex and Giza: Vegetables, fruit and fodder next to the country's largest city, on land that urbanisation is eating away.
Indicator | Value |
|---|---|
Annual rainfall, 1991-2020 | 18 mm |
Reference evapotranspiration | 1,978 mm |
Annual water deficit | 1,960 mm |
Months with less than 50 mm of rain | 12 |
Global solar radiation | 2,186 kWh/m² |
Mean temperature | 22.0 °C |
Source: ERA5 via Open-Meteo (A9); PVGIS (A8); author's calculation.
Faiyum (Fayoum)
The Fayoum depression: An oasis fed by the Bahr Yussef canal; olive, citrus, vegetables and spring crops.
Indicator | Value |
|---|---|
Annual rainfall, 1991-2020 | 10 mm |
Reference evapotranspiration | 2,061 mm |
Annual water deficit | 2,051 mm |
Months with less than 50 mm of rain | 12 |
Global solar radiation | 2,241 kWh/m² |
Mean temperature | 22.7 °C |
Source: ERA5 via Open-Meteo (A9); PVGIS (A8); author's calculation.
Minya (Minya)
Middle Egypt: Sugar cane, wheat, maize, vegetables and onion in the narrow Nile valley, and new desert land along its edge.
Indicator | Value |
|---|---|
Annual rainfall, 1991-2020 | 5 mm |
Reference evapotranspiration | 2,274 mm |
Annual water deficit | 2,269 mm |
Months with less than 50 mm of rain | 12 |
Global solar radiation | 2,254 kWh/m² |
Mean temperature | 23.1 °C |
Source: ERA5 via Open-Meteo (A9); PVGIS (A8); author's calculation.
Asyut (Assiout)
Upper Egypt, north: Wheat, maize, pulses and sugar cane; basin irrigation has given way to year-round irrigation.
Indicator | Value |
|---|---|
Annual rainfall, 1991-2020 | 5 mm |
Reference evapotranspiration | 2,382 mm |
Annual water deficit | 2,377 mm |
Months with less than 50 mm of rain | 12 |
Global solar radiation | 2,323 kWh/m² |
Mean temperature | 23.8 °C |
Source: ERA5 via Open-Meteo (A9); PVGIS (A8); author's calculation.
Luxor (Louxor)
Upper Egypt, centre: Sugar cane, wheat, fenugreek and aromatic plants, under very strong summer heat.
Indicator | Value |
|---|---|
Annual rainfall, 1991-2020 | 3 mm |
Reference evapotranspiration | 2,424 mm |
Annual water deficit | 2,421 mm |
Months with less than 50 mm of rain | 12 |
Global solar radiation | 2,406 kWh/m² |
Mean temperature | 25.3 °C |
Source: ERA5 via Open-Meteo (A9); PVGIS (A8); author's calculation.
Aswan (Assouan)
The far south: Sugar cane, dates and new-land crops near Lake Nasser, under a hot desert climate.
Indicator | Value |
|---|---|
Annual rainfall, 1991-2020 | 2 mm |
Reference evapotranspiration | 2,940 mm |
Annual water deficit | 2,938 mm |
Months with less than 50 mm of rain | 12 |
Global solar radiation | 2,440 kWh/m² |
Mean temperature | 26.8 °C |
Source: ERA5 via Open-Meteo (A9); PVGIS (A8); author's calculation.
Kharga (Kharga)
The New Valley: Western Desert oases irrigated from the deep aquifer; dates, olive, wheat and new farms.
Indicator | Value |
|---|---|
Annual rainfall, 1991-2020 | 2 mm |
Reference evapotranspiration | 2,586 mm |
Annual water deficit | 2,584 mm |
Months with less than 50 mm of rain | 12 |
Global solar radiation | 2,414 kWh/m² |
Mean temperature | 23.7 °C |
Source: ERA5 via Open-Meteo (A9); PVGIS (A8); author's calculation.
Siwa (Siwa)
The Siwa oasis: Dates and olives in a salty depression, where the water table is close to the surface but salty.
Indicator | Value |
|---|---|
Annual rainfall, 1991-2020 | 11 mm |
Reference evapotranspiration | 2,063 mm |
Annual water deficit | 2,052 mm |
Months with less than 50 mm of rain | 12 |
Global solar radiation | 2,260 kWh/m² |
Mean temperature | 21.7 °C |
Source: ERA5 via Open-Meteo (A9); PVGIS (A8); author's calculation.
Annex A. Sources and confidence levels
Ref. | Source | Level |
|---|---|---|
A1 | World Bank, World Development Indicators (WDI), Egypt | A |
A2 | FAOSTAT, crops and livestock (QCL), areas, production, 2014-2024 | A |
A3 | FAOSTAT, value of production (QV), constant 2014-2016 I$, 2019-2024 | A |
A4 | FAOSTAT, trade in crops and livestock products, 2018-2024 | A |
A5 | FAOSTAT, mineral fertilisers, agricultural use, production and imports, 2005-2023 | A |
A6 | FAOSTAT, land use, areas equipped for irrigation, organic farming | A |
A7 | World Bank, Pink Sheet (world prices of urea, DAP, TSP and potassium chloride) | A |
A8 | PVGIS (European Commission Joint Research Centre), radiation, 2005-2020 | B |
A9 | ERA5 (Copernicus), via Open-Meteo: Rainfall, reference evapotranspiration, temperature, 1981-2024 | B |
A10 | Natural Earth, first-level administrative boundaries and country outline | B |
A11 | FAO, "Irrigation in the Near East Region in figures" (Water Report No. 9, 1997), Egypt profile: Irrigation potential and equipped area (1993 data); 1959 Nile waters agreement | A |
A12 | PwC, Worldwide Tax Summaries, Egypt, "Other taxes": Import VAT, calculated on the CIF value plus customs duty. The customs duty rate for heading 3906.90 was not found in an official source | C |
A13 | Egypt Trade Portal, administration contacts: Fertilisers and Agricultural Soil Conditioners Control Department, Soil, Water and Environment Research Institute (Giza); Egyptian Organization for Standards and Quality (EOS), fertiliser and soil conditioner standards | C |
A14 | Soybean trial, China (yield), manufacturer's website | C |
A15 | Date palm trial, UAE (ICBA, 2021), manufacturer's website | B |
A16 | Watermelon trial, Mexico (2023), manufacturer's website | C |
A17 | Potato trial, South Africa (2025), manufacturer's website | C |
A18 | Maize trial, Türkiye (TIGEM, Konya, 2025), manufacturer's website | B |
A19 | ECOSORB® acrylamide analysis (Polymex laboratory, 2024) | B |
A20 | EVERGREEN® REACH / SVHC screening (SGS, 2023) | B |
A21 | ECOFERT® certificate (SOHISCERT, EU Bio) | A |
A22 | Paulownia ALTIFOLIA® sheet figures (website) | C |
Annex B. Calculation method
1. Agricultural water. Total withdrawals (77,500 Mm³, 2022) × agricultural share (79.16%) = 61,350.0 Mm³.
2. Irrigation. The equipped area (4,013,710 ha) and agricultural water are shared between irrigated groups (wheat, barley, sorghum, maize, rice, sugar cane and sugar beet, potato, vegetables and melons, citrus, date palm, other fruit, cotton, groundnut, sesame, sunflower, soybean and pulses) in proportion to their harvested areas (5,876,526 ha), without exceeding each group's harvested area. Our sources have no irrigation statistic by crop. Other crops are treated as rainfed and receive no irrigation water in the calculation. The equipped area is smaller than the sum of harvested areas of the irrigable crops, because several crops follow each other on the same land: Agricultural water is therefore shared pro rata to harvested areas, and the irrigated area attributed to each group is capped at its harvested area. Wheat, rice, maize and cane are treated as irrigated, Egyptian farming being almost entirely irrigated.
3. Scenarios. Water saved = group water × trial effect: A quarter (cautious), half (central), all of it (high). Without a trial: 5, 10 and 20%.
4. Extra hectares. Water saved ÷ water per equipped hectare (15,285 m³/ha).
6. Value of water. Three assumed prices (0.10; 0.22 and 0.45 $/m³); no national tariff was adopted.
7. Fertilisers. Minimum spending = nitrogen ÷ 0.46 × urea price + phosphate ÷ 0.46 × TSP price + potash ÷ 0.60 × potassium chloride price (A7).
8. Climate. Rainfall, reference evapotranspiration (FAO-56) and temperature: 1991-2020 means of the ERA5 grid cell containing each city; radiation: PVGIS, 2005-2020. Temperature trends are linear regressions over 1981-2024. ERA5 is a reanalysis: Its rainfall can differ from local station records. On the maps, each broad area is shown as a point at its reference town: The twenty-seven governorates are too small for a readable map.
9. Trade. Totals are those of the FAOSTAT crops and livestock line; products are listed one by one, without aggregates. Rice amounts add husked rice, broken rice and milled rice.
Annex C. Photo credits
File (Wikimedia Commons) | Author | Licence |
|---|---|---|
Egyptian farmers.jpg | Hbegzee | CC BY-SA 4.0 |
Harvesting strawberries - Egypt.jpg | Doaa Adel | CC BY-SA 4.0 |
Wheat ploughing.jpg | Ahmed Flex777 | CC BY-SA 4.0 |
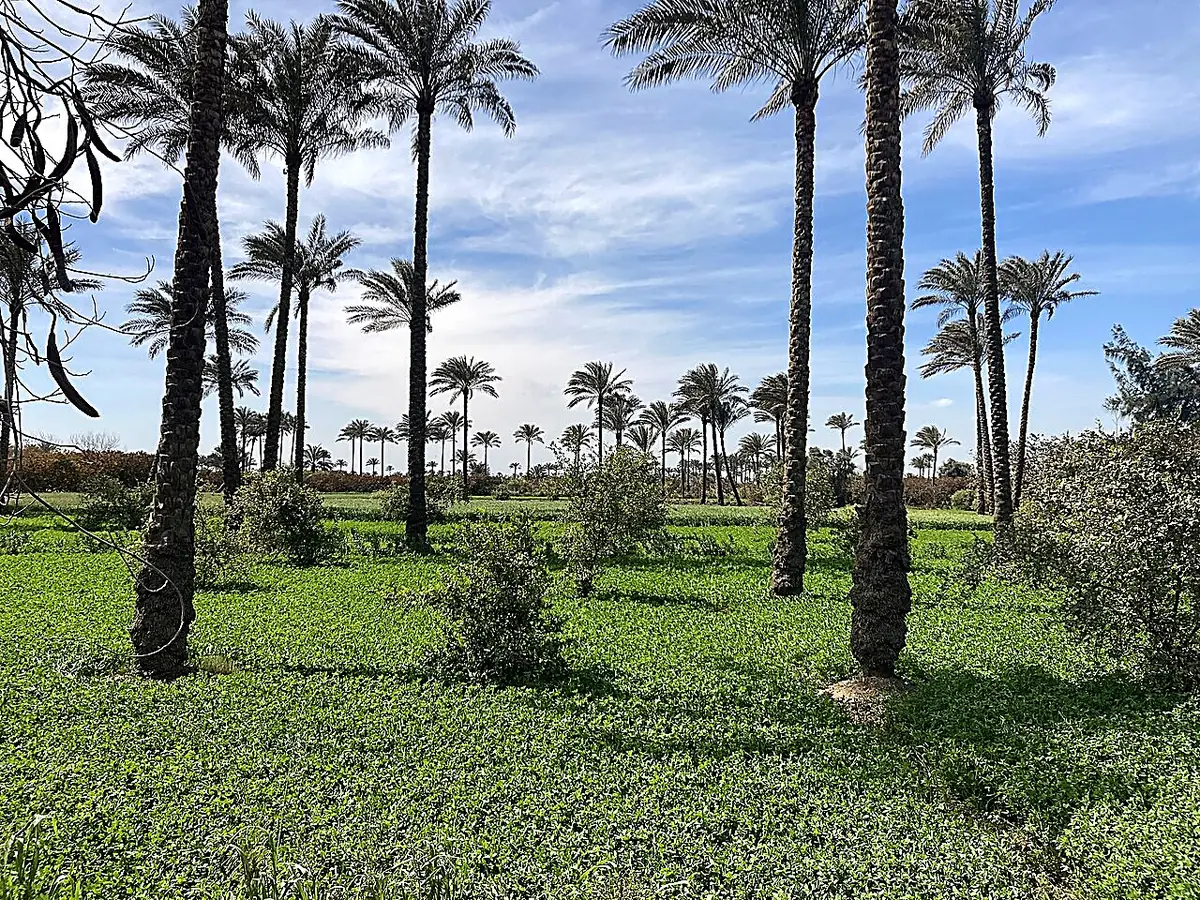
Palm date trees sunny afternoon.jpg | Hesham sheir | CC BY-SA 4.0 |
Aswan High Dam, built to control the Nile floods, store water and prod | Jorge Láscar from Melbourne, Australia | CC BY 2.0 |
Farmer in a cloudy day.jpg | Mona Hassan Abo-Abda | CC BY-SA 4.0 |
Upper Egypt palm farm.jpg | Mmelouk | CC BY-SA 4.0 |
Sugar can farm.jpg | Hbegzee | CC BY-SA 4.0 |
The egyptian farmer.jpg | Hbegzee | CC BY-SA 4.0 |
Sundried Tomatoes in Luxor.jpg | Ksjaw | CC BY-SA 4.0 |
Corn harvest0.jpg | BySummer kamal | CC BY-SA 4.0 |
Farmers on the Nile - panoramio (1).jpg | David Broad | CC BY 3.0 |
Paradise of Egypt (Fayoum).jpg | Shams radwan | CC BY-SA 4.0 |
Source: Photos published on Wikimedia Commons, colour-adjusted and sharpened, used under their licence.
احكِ لنا عن أرضك
المحصول، أسلوب الري، طبيعة التربة، كمية الماء المستهلكة اليوم. نعود إليك بتركيبة التقنيات المناسبة، والجرعات، والتجارب التي أُجريت في أوضاع مشابهة.
أول تبادل لا يلزمك بشيء.
احكِ لنا عن أرضكcontact@green-solutions-group.com · Green Solutions Groupe AIM SA, 46, route de la Condémine, 1475 Forel, Switzerland
اعتمادات الصور
- Myousry6666 — CC BY-SA 4.0, « Agricultural Farmland (4) »
صور من ويكيميديا كومنز، معاد استخدامها وفق تراخيصها.