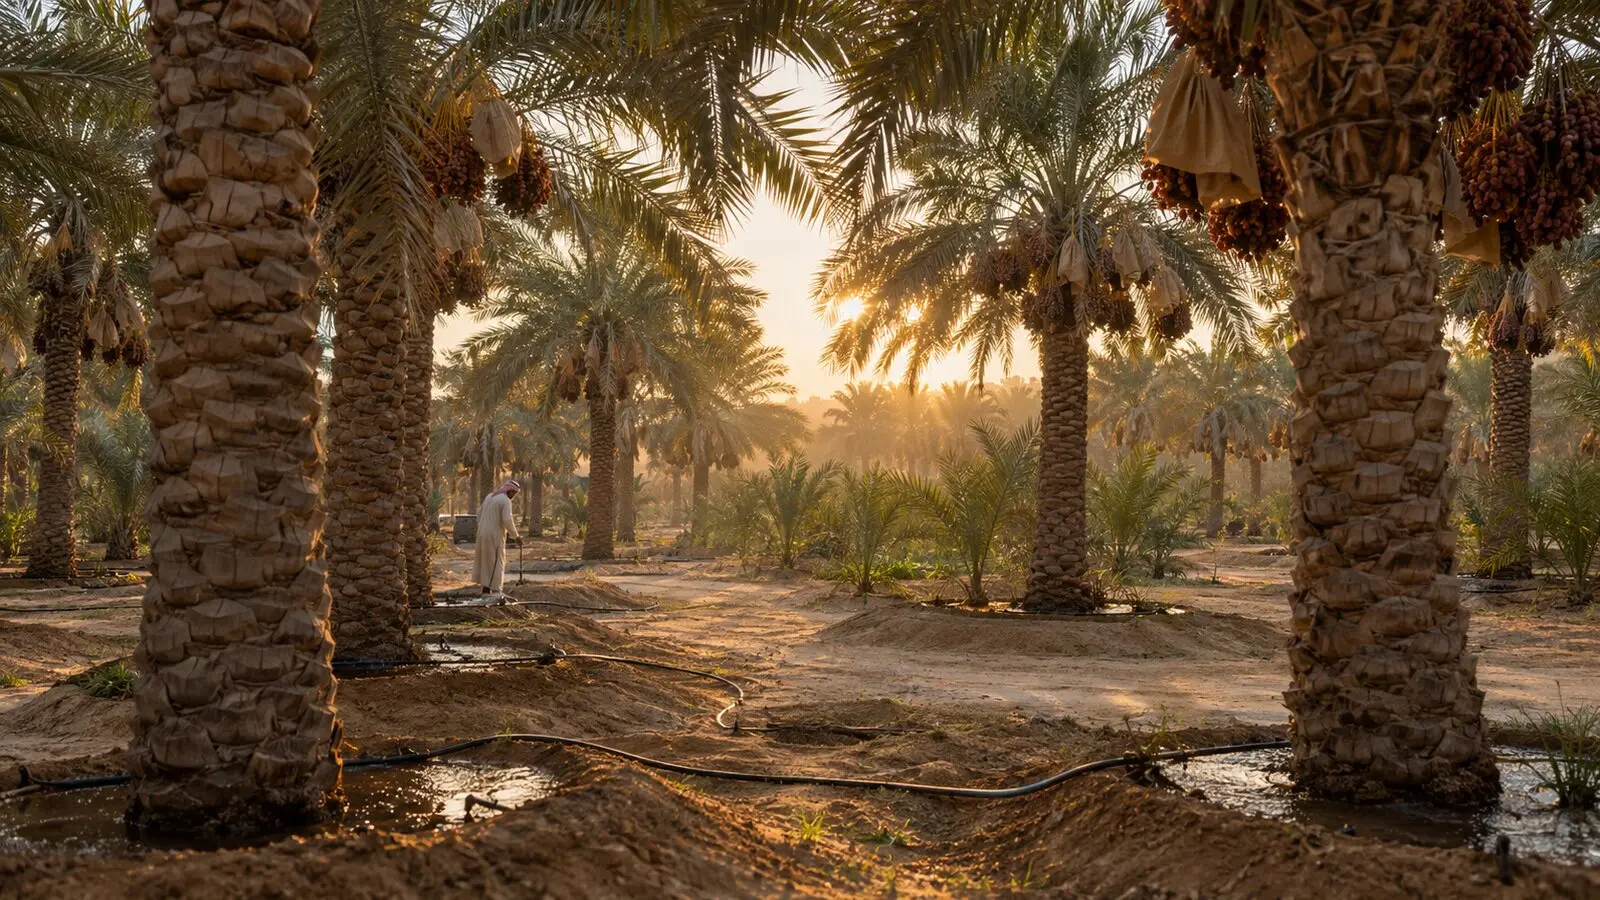

ملف السوق الزراعي
المملكة العربية السعودية
المملكة العربية السعودية
التمور والخضروات المحمية والزراعة المروية تحت قيد مائي دائم.
ما الذي يغيّره احتباس الماء في التربة على مستوى الحقل.
Foreword
This dossier describes Saudi Arabia from the angle of water, climate, fertilisers and crops. It is written for the ministries in charge of agriculture, water and trade, the regional directorates of agriculture, cooperatives and producer organisations. It answers three questions: Where is water short, for which crops, and in which regions? It then examines what our products can change, in rainfed as well as irrigated farming, and what that can mean for the country's external trade.
Reading the sources. Every figure refers to a source, named in the text and detailed in Annex A. Each source carries a confidence level:
Summary
The points below summarise the dossier. The figures come from public sources: The World Bank, FAO (FAOSTAT, AQUASTAT), Saudi public bodies (GASTAT, Ministry of Environment, Water and Agriculture, Zakat, Tax and Customs Authority), PVGIS and NASA POWER. The production gains and water savings are scenarios, described in Annex B.
36.97 M Inhabitants in 2025 (World Bank) | 257,613 ha Of dates harvested in 2024, the main crop | 3.28 M ha Equipped for irrigation (2024) |
2,425 Mm³ Of irrigation water saved a year, central scenario | 5,719 M$ Of agricultural exports in 2024 (FAOSTAT) |
Key figures
Key indicators for Saudi Arabia
Indicator | Value | Year | Source (level) |
|---|---|---|---|
Population | 36.97 M | 2025 | World Bank (A1) |
GDP per capita | 34,537 $ | 2025 | World Bank (A1) |
Agriculture share of GDP | 2.6% | 2025 | World Bank (A1) |
Agricultural employment | 2.5% | 2025 | World Bank (A1) |
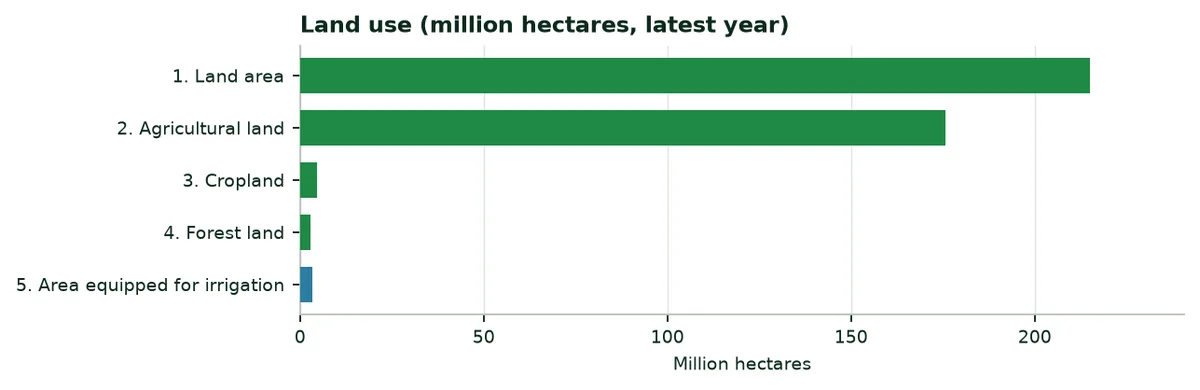
Cropland | 4,590,000 ha | 2024 | FAOSTAT (A6) |
Area equipped for irrigation | 3,278,920 ha | 2024 | FAOSTAT (A6) |
Harvested area: Dates | 257,613 ha | 2024 | FAOSTAT (A2) |
Certified organic cropland | 20,064 ha | 2024 | FAOSTAT (A6) |
Agricultural exports | 5,719 M$ | 2024 | FAOSTAT (A4) |
Agricultural imports | 29,523 M$ | 2024 | FAOSTAT (A4) |
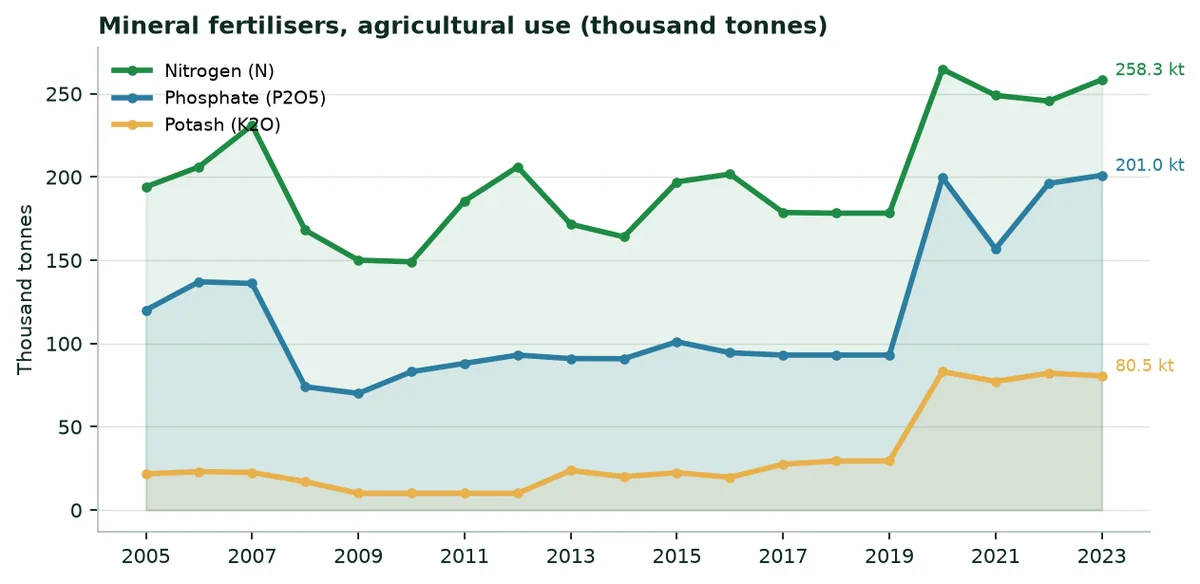
Mineral nitrogen, agricultural use | 258,330 t | 2024 | FAOSTAT (A5) |
Source: Table based on the sources indicated.
1. Green Solutions and our products
Green Solutions develops products for water, fertilisation and crop protection. Four families are of interest to this dossier. The yields cited are those published by the manufacturer or by the trials, with their confidence level.
Products covered by this dossier
Product | Claimed use | Published evidence (level) |
|---|---|---|
EVERGREEN® (water-retention polymer) | Holds rain or irrigation water as a gel, near the roots. | Trials on maize, potato, watermelon, date palm and soybean. Level B to C. |
ECOSORB® (water-retention polymer based on corn starch) | Same use; action lasting 2 to 3 years according to the website. | Soybean trial (China); laboratory acrylamide analysis. Level B to C. |
ECOFERT® (fertiliser) | Fertiliser certified by SOHISCERT and EU Bio, usable in organic farming. | Published certificate; potato trial combined with EVERGREEN®. Level A (certificate), C (results). |
Paulownia ALTIFOLIA® | Fast-growing tree for agroforestry. | Website figures; no trial in Saudi Arabia. Level C. |
Water Vital®, NAPEMA® | Outside the scope of this dossier. | No independent source in the documents consulted. |
Source: Green Solutions website (product sheets and published trials), Annex A.
The indicative dose published on the website is 30 to 75 kg/ha.
2. Saudi Arabia in figures
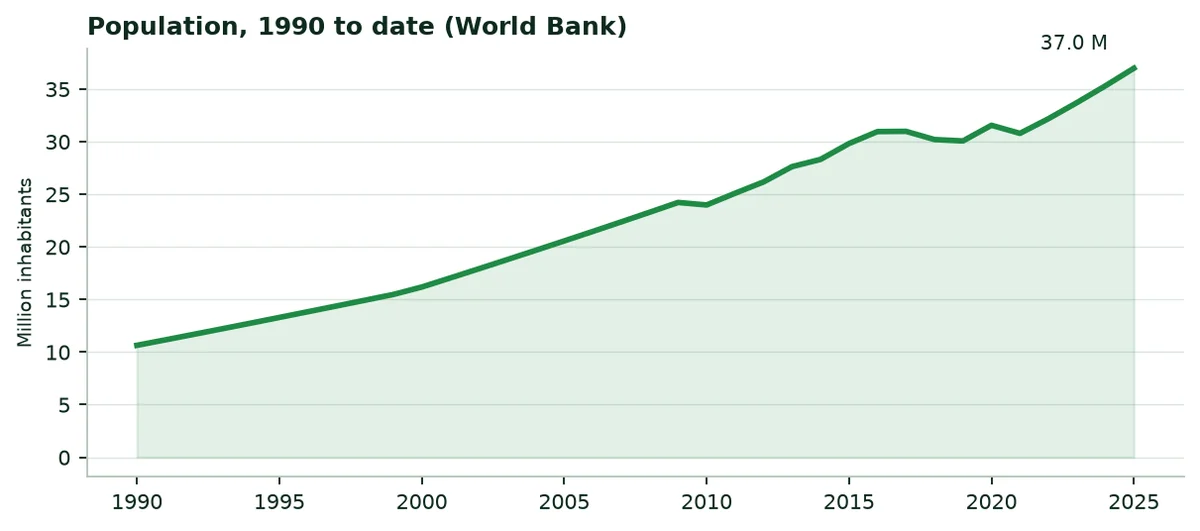
Saudi Arabia had 36.97 million inhabitants in 2025, 15% of them in rural areas. Agriculture accounts for 2.6% of gross domestic product and employs 2% of the labour force. The country covers 2,149.7 thousand km², of which 82% is agricultural land. Undernourishment affects 2.5% of the population.
Agricultural and water indicators, latest year published
Indicator | Value | Year | Source |
|---|---|---|---|
Cropland certified organic | 20,064 ha | 2024 | FAOSTAT (A6) |
Average cereal yield | 5,105 kg/ha | 2024 | World Bank (A1) |
Fertiliser use per hectare of arable land | 125.5 kg/ha | 2024 | World Bank (A1) |
Water withdrawals, agricultural share | 81.6% | 2022 | World Bank (A1) |
Internal freshwater resources | 2.4 km³ | 2022 | World Bank (A1) |
Internal resources per inhabitant | 75 m³ | 2022 | World Bank (A1) |
3. Sunshine, rainfall and climate change
3.1 Sunshine
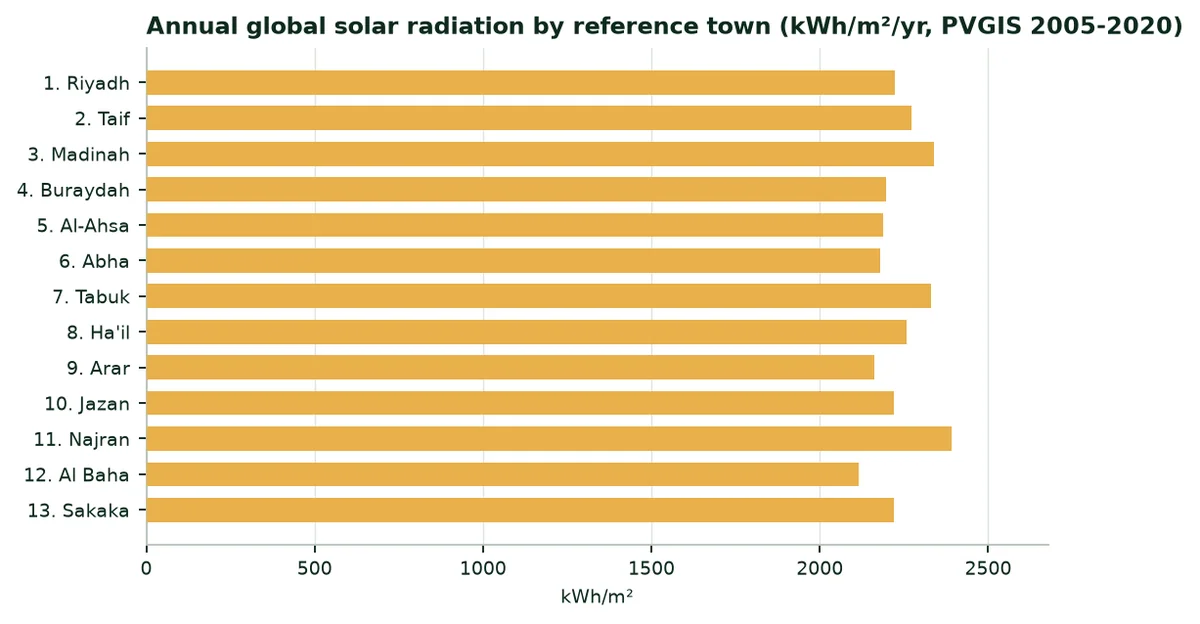
Global solar radiation reaches 2,116 to 2,391 kWh/m² a year depending on the region. Energy is not the limit: Water available at the right time makes the harvest.
3.2 Rainfall and evapotranspiration
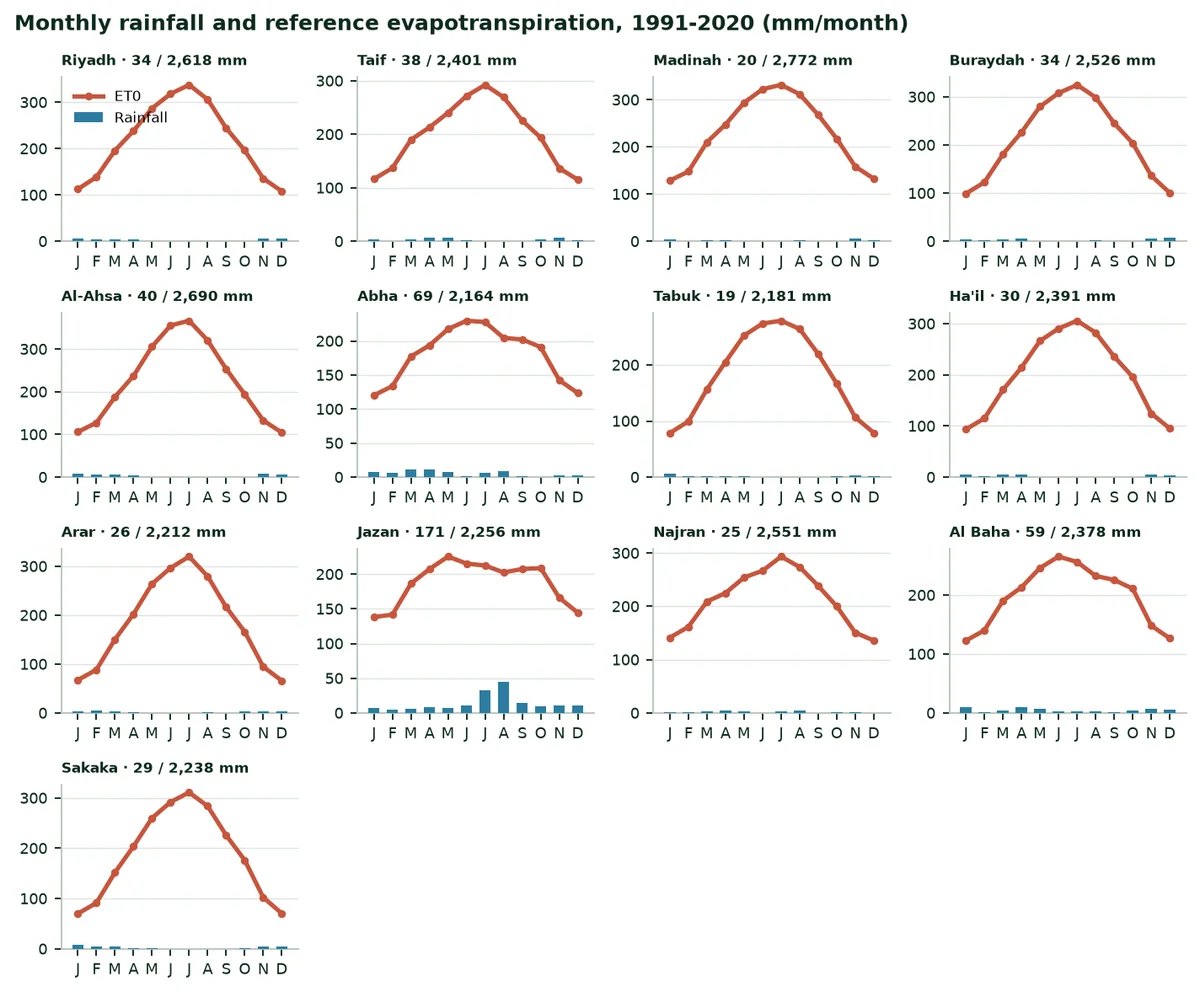
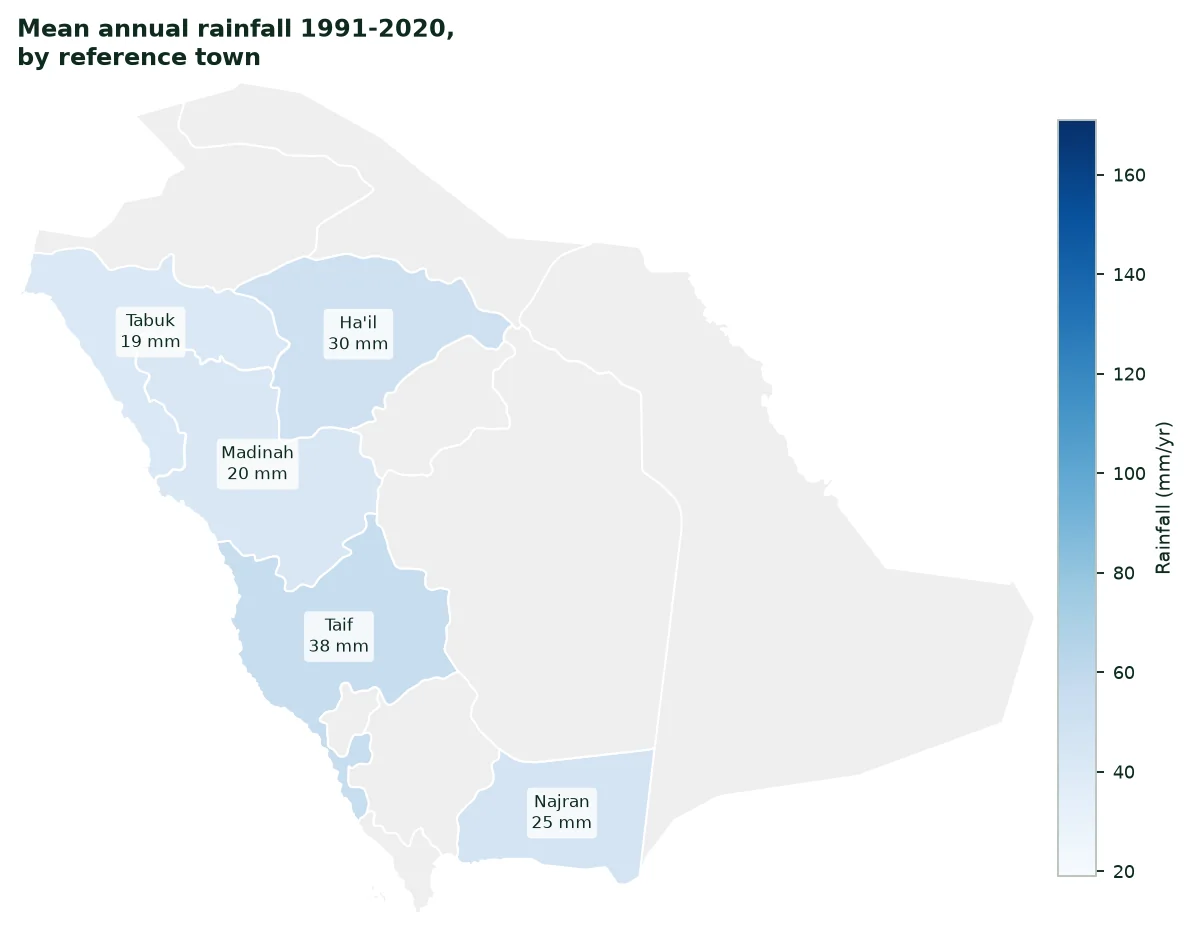
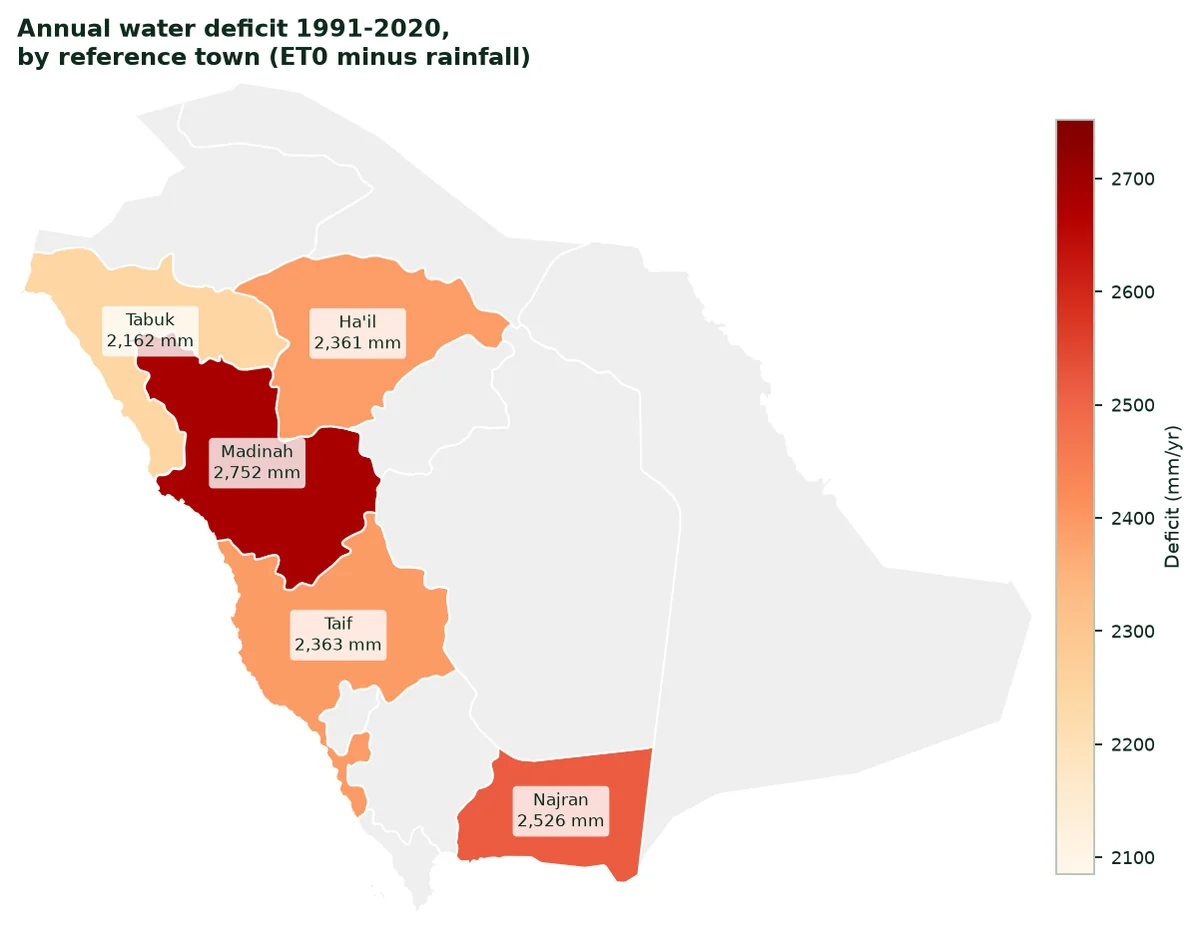
It rains 171 mm a year at Jazan, but only 19 mm at Tabuk, where reference evapotranspiration reaches 2,181 mm. Rain is scarce and irregular over most of the country: It falls mostly from winter to spring in the north and centre, and in spring and summer in the south-west. Almost all farming therefore depends on irrigation.
Mean monthly rainfall, 1991-2020 (mm per month)
City | Jan | Feb | Mar | Apr | May | Jun | Jul | Aug | Sep | Oct | Nov | Dec |
|---|---|---|---|---|---|---|---|---|---|---|---|---|
Riyadh | 6 | 5 | 4 | 5 | 1 | 0 | 0 | 0 | 0 | 1 | 6 | 5 |
Taif | 3 | 0 | 3 | 7 | 7 | 3 | 1 | 1 | 1 | 3 | 7 | 2 |
Madinah | 3 | 1 | 1 | 2 | 1 | 0 | 0 | 2 | 0 | 1 | 6 | 2 |
Buraydah | 4 | 2 | 4 | 6 | 1 | 0 | 0 | 2 | 0 | 1 | 6 | 8 |
Al-Ahsa | 8 | 6 | 6 | 4 | 0 | 0 | 0 | 0 | 0 | 1 | 7 | 7 |
Abha | 8 | 6 | 11 | 12 | 8 | 1 | 7 | 8 | 1 | 1 | 3 | 3 |
Tabuk | 6 | 2 | 2 | 1 | 2 | 0 | 0 | 0 | 0 | 1 | 3 | 1 |
Ha'il | 5 | 2 | 6 | 6 | 1 | 0 | 0 | 0 | 0 | 1 | 6 | 3 |
Arar | 4 | 4 | 4 | 2 | 0 | 0 | 0 | 1 | 0 | 3 | 4 | 4 |
Jazan | 7 | 4 | 7 | 9 | 8 | 11 | 33 | 45 | 15 | 10 | 11 | 11 |
Najran | 1 | 1 | 3 | 5 | 4 | 0 | 3 | 5 | 0 | 1 | 1 | 1 |
Al Baha | 10 | 2 | 4 | 11 | 6 | 3 | 2 | 3 | 1 | 5 | 7 | 5 |
Sakaka | 9 | 4 | 4 | 1 | 0 | 0 | 0 | 0 | 0 | 1 | 5 | 5 |
Source: NASA POWER (A9); author's calculation.
 |  |
|---|
3.3 Climate change
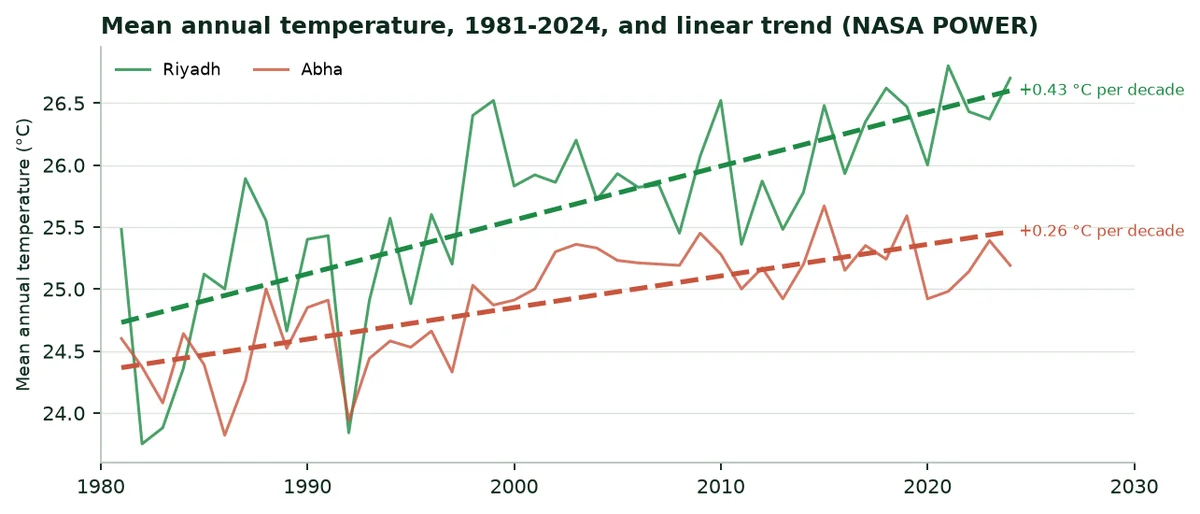
Mean annual temperature is rising. At Riyadh it went from 25.5 °C in 1981 to 26.7 °C in 2024, a trend of 0.43 °C per decade. At Abha the trend is 0.26 °C per decade, from 24.6 °C to 25.2 °C. Warmer air dries the soil faster between two rains.
4. Water: Resources, irrigated areas, withdrawals
4.1 Resources and withdrawals
Total freshwater withdrawals are 23,380 million m³ a year (2022). Agriculture withdraws 81.6% of it, that is 19,070 Mm³. Internal resources are 2.4 km³ a year and water stress is 974.2%: The resource is already heavily used: Every cubic metre kept in the soil counts.
Freshwater: Withdrawals and resources
Indicator | Value | Year | Source |
|---|---|---|---|
Total withdrawals | 23,380 Mm³ | 2022 | World Bank (A1) |
Agricultural share | 81.6% | 2022 | World Bank (A1) |
Agricultural withdrawals | 19,069.6 Mm³ | 2022 | Calculated from A1 |
Area equipped for irrigation | 3,278,920 ha | 2024 | FAOSTAT (A6) |
Agricultural withdrawals per equipped hectare | 5,816 m³/ha | — | Calculation (Annex B) |
Water stress | 974.2% | 2022 | World Bank (A1) |
4.2 Irrigated areas
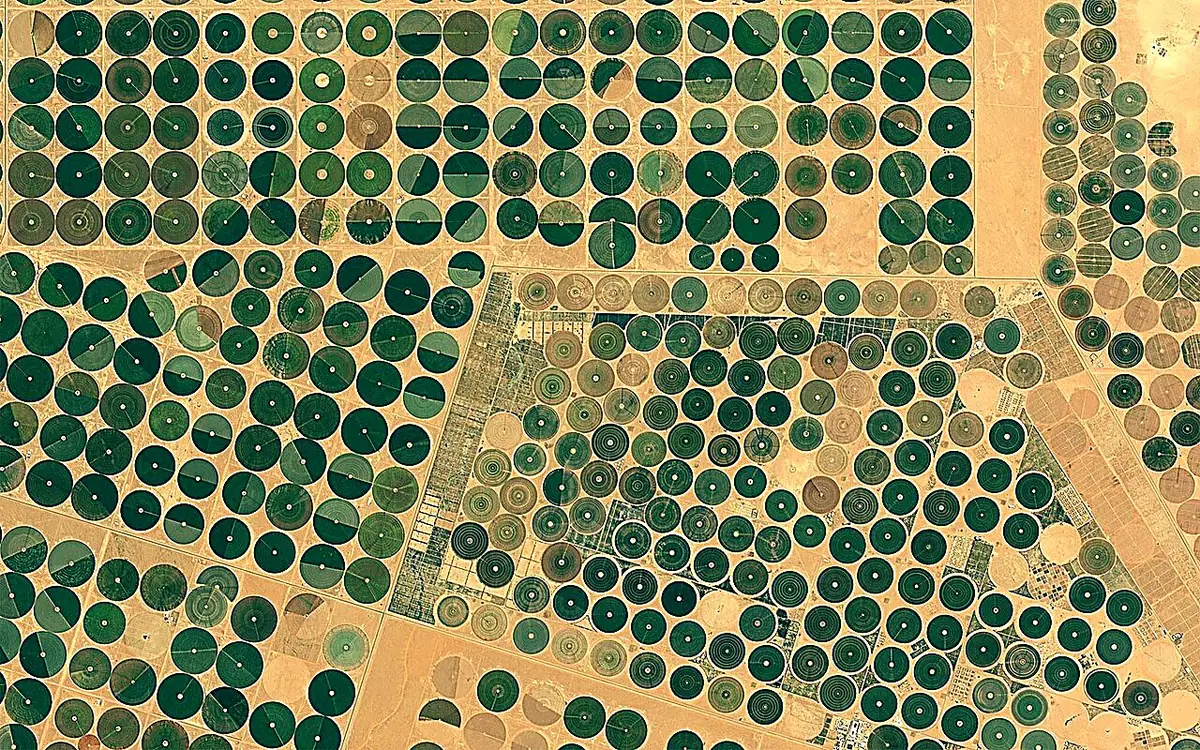
FAOSTAT counts 3,278,920 hectares equipped for irrigation in 2024. Irrigation relies mostly on non-renewable groundwater: According to a 2024 study, it supplies 62.4% of the country's water supply (A11). Every cubic metre kept in the soil therefore counts, and centre pivots and drip irrigation dominate the large farms.
4.3 What the water saving represents
In the central scenario, the saving is 2,425.0 million m³ a year, or 12.7% of agricultural withdrawals. At 5,816 m³ per equipped hectare, this water would irrigate about 416,973 more hectares, or 12.7% of today's equipped area.
5. Fertilisers: Quantities, purchases, spending
5.1 Quantities used
In 2024, agricultural use reaches 258,330 tonnes of nitrogen, 200,959 tonnes of phosphate (P2O5) and 80,535 tonnes of potash (K2O). The country produces 3,539,966 tonnes of nitrogen and 2,345,914 tonnes of phosphate (P2O5); it imported 42,837 tonnes of nitrogen in the same year. Per hectare of arable land, use is 125.5 kg per hectare.
5.2 Regulatory framework
Fertilisers are registered with the Ministry of Environment, Water and Agriculture (A13, level C). A water-retaining polymer would come under it according to its classification, to be confirmed with the ministry.
5.3 Indicative spending
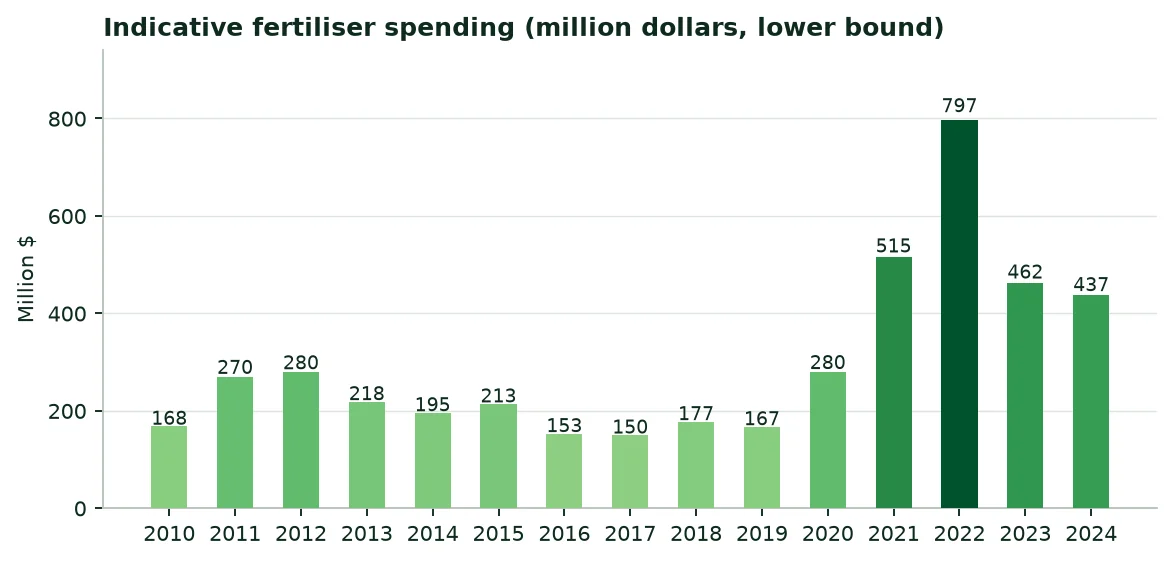
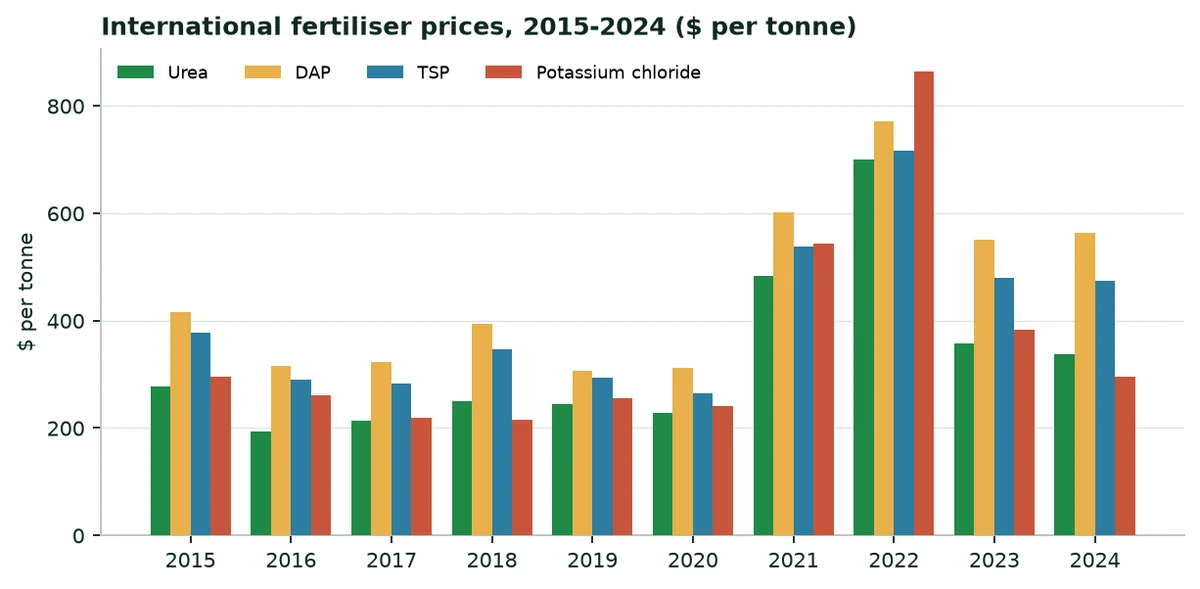
In 2024, the indicative minimum spending on mineral fertilisers reaches $437 million, at international fertiliser prices (calculation in Annex B, lower bound).
6. The regions at a glance
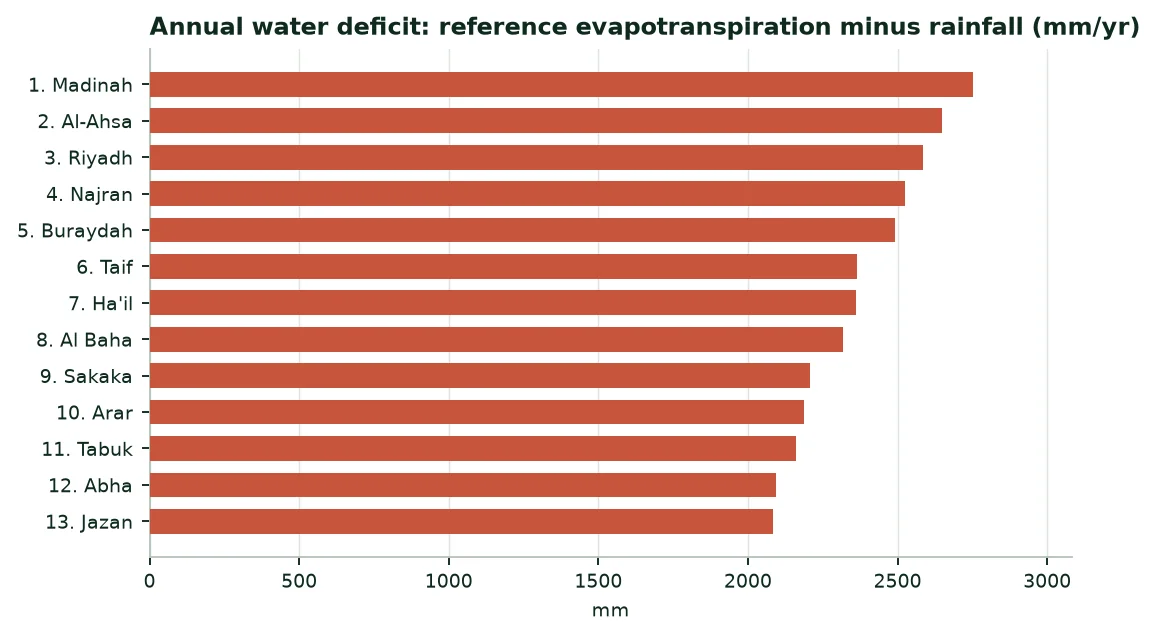
The table compares the thirteen administrative regions, each represented by a reference town. Climate figures are 1991-2020 averages, except radiation (2005-2020).
Climate of the capitals, 1991-2020 means
Region (city) | Rainfall (mm/yr) | ET0 (mm/yr) | Deficit (mm/yr) | Radiation (kWh/m²/yr) | Temperature (°C) |
|---|---|---|---|---|---|
Riyadh (Riyadh) | 34 | 2,618 | 2,584 | 2,222 | 25.8 |
Makkah (Taif) | 38 | 2,401 | 2,363 | 2,272 | 23.7 |
Madinah (Madinah) | 20 | 2,772 | 2,752 | 2,338 | 26.2 |
Qassim (Buraydah) | 34 | 2,526 | 2,492 | 2,196 | 24.6 |
Eastern Province (Al-Ahsa) | 40 | 2,690 | 2,650 | 2,187 | 26.8 |
Asir (Abha) | 69 | 2,164 | 2,095 | 2,180 | 25.0 |
Tabuk (Tabuk) | 19 | 2,181 | 2,162 | 2,331 | 20.4 |
Ha'il (Ha'il) | 30 | 2,391 | 2,361 | 2,257 | 22.3 |
Northern Borders (Arar) | 26 | 2,212 | 2,186 | 2,163 | 21.5 |
Jazan (Jazan) | 171 | 2,256 | 2,085 | 2,219 | 30.6 |
Najran (Najran) | 25 | 2,551 | 2,526 | 2,391 | 24.5 |
Al Baha (Al Baha) | 59 | 2,378 | 2,319 | 2,116 | 26.6 |
Al Jawf (Sakaka) | 29 | 2,238 | 2,209 | 2,220 | 21.0 |
Source: NASA POWER (A9); PVGIS (A8); author's calculation.
7. The twenty main crops: Three rankings
7.1 By harvested area
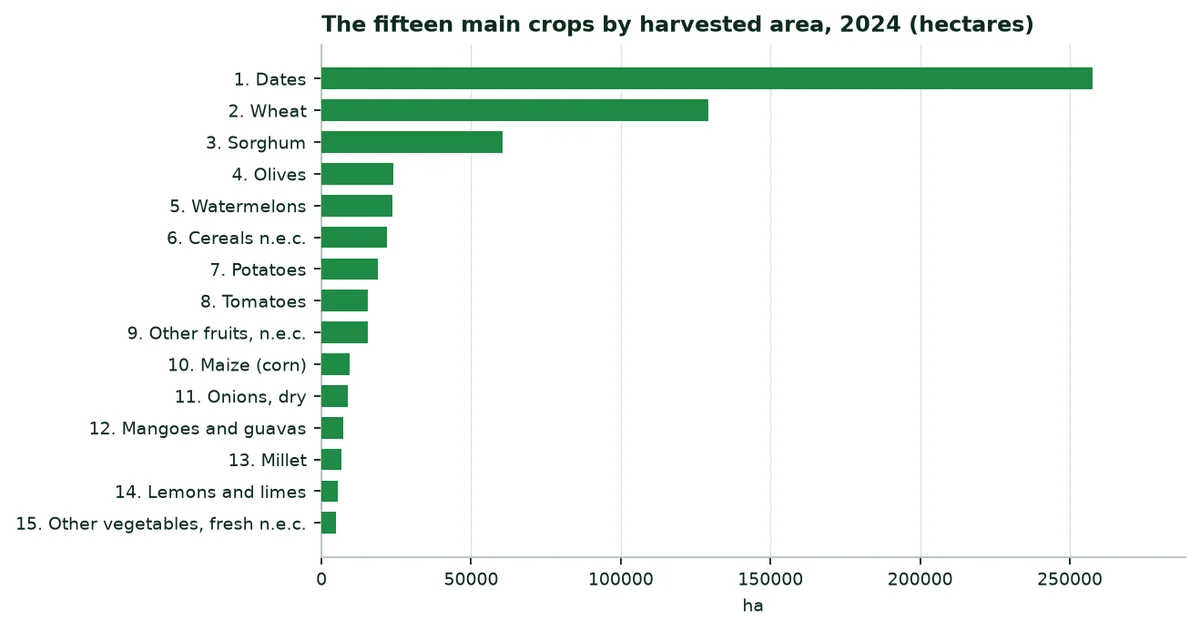
The ten main crops by area, 2024
Crop | Harvested area (ha) | Production (t) | Yield (t/ha) |
|---|---|---|---|
Dates | 257,613 | 1,927,556 | 7.48 |
Wheat | 129,202 | 820,393 | 6.35 |
Sorghum | 60,475 | 168,328 | 2.78 |
Olives | 24,004 | 351,278 | 14.63 |
Watermelons | 23,648 | 608,478 | 25.73 |
Cereals n.e.c. | 21,746 | 92,664 | 4.26 |
Potatoes | 18,843 | 625,071 | 33.17 |
Tomatoes | 15,518 | 682,569 | 43.99 |
Other fruits, n.e.c. | 15,345 | 266,855 | 17.39 |
Maize (corn) | 9,453 | 67,441 | 7.13 |
Source: FAOSTAT (A2).
7.2 By production
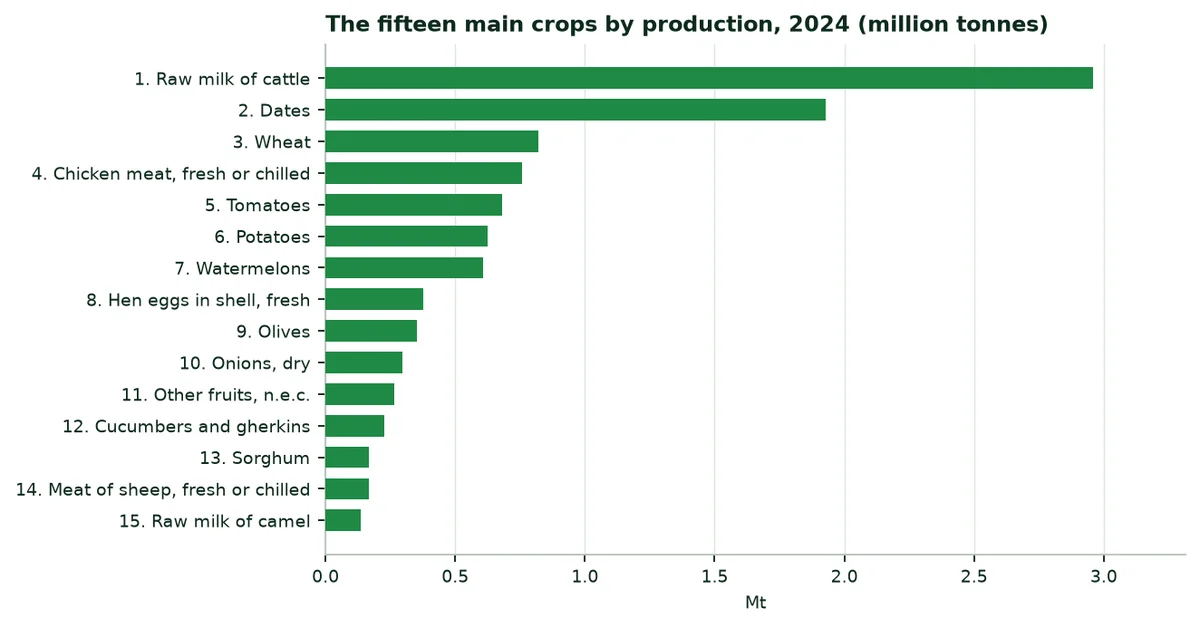
7.3 By production value
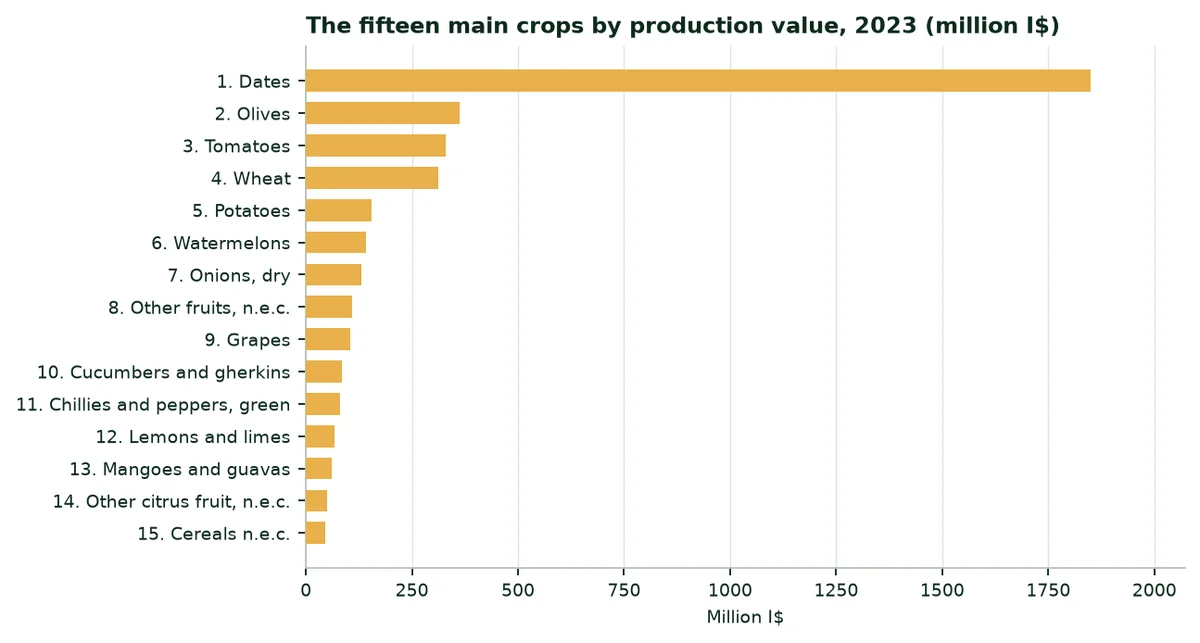
By production value, the three main crops are: Dates, olives and tomatoes (FAOSTAT, 2023, constant international dollars).
8. Extrapolation by crop: Irrigation and rainfed crops
8.1 Method
8.2 Trials used as analogues
Trials cited and their use in the calculation
Trial | Crop | Water | Yield | Use in the calculation |
|---|---|---|---|---|
Maize, Türkiye (TIGEM, Konya, 2025) | Maize | -38.9% | +17.1% | Maize: Water and yield |
Soybean, China | Soybean | Assumption | +11.3% | Not used; cited for reference |
Watermelon, Mexico (2023) | Watermelon | -60.5% | +30.0% | Watermelon and melon: Water and yield |
Potato, South Africa (2025) | Potato | -52.0% | +31.4% | Potato: Water and yield |
Date palm, UAE (ICBA, 2021) | Palm | -82.0% | +20.0% | Date palm: Water and yield |
Source: A14 to A18 (published trials and manufacturer's website, levels B and C).
No trial has yet been conducted in Saudi Arabia: The figures below apply the trials cited to the country's average yields.
8.3 Irrigation: Date palm, Wheat and barley, Watermelon and melon and Potato
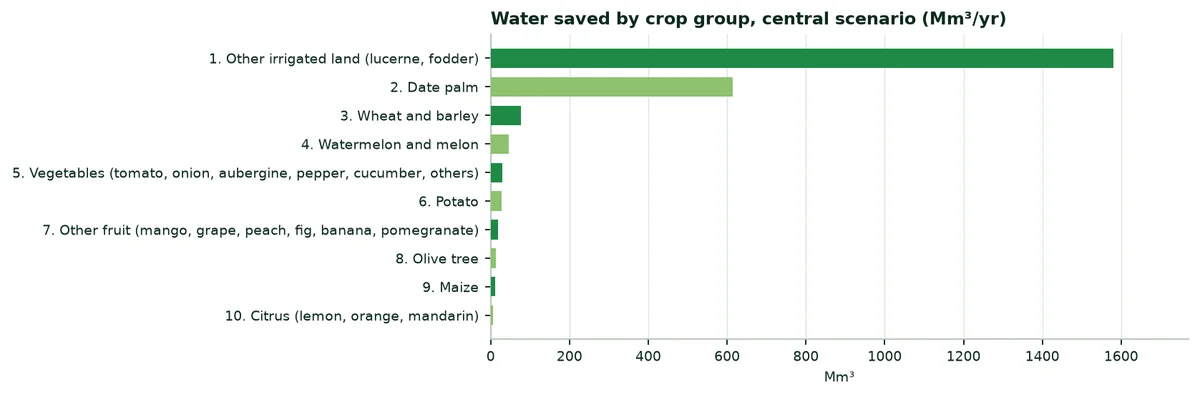
Equipped area assigned, trial used and water saved (central scenario)
Crop group | Equipped area (ha) | Share | Trial or assumption | Water saved (Mm³/yr) |
|---|---|---|---|---|
Date palm | 257,613 | 7.9% | Date palm, UAE (ICBA, 2021) | 614.3 |
Wheat and barley | 131,255 | 4.0% | Generic assumption, no trial | 76.3 |
Watermelon and melon | 26,215 | 0.8% | Watermelon, Mexico (2023) | 46.1 |
Potato | 18,843 | 0.6% | Potato, South Africa (2025) | 28.5 |
Vegetables (tomato, onion, aubergine, pepper, cucumber, others) | 51,925 | 1.6% | Generic assumption, no trial | 30.2 |
Olive tree | 24,004 | 0.7% | Generic assumption, no trial | 14.0 |
Citrus (lemon, orange, mandarin) | 9,676 | 0.3% | Generic assumption, no trial | 5.6 |
Other fruit (mango, grape, peach, fig, banana, pomegranate) | 31,947 | 1.0% | Generic assumption, no trial | 18.6 |
Maize | 9,453 | 0.3% | Maize, Türkiye (TIGEM, 2025) | 10.7 |
Other irrigated land (lucerne, fodder) | 2,717,989 | 82.9% | Generic assumption, no trial | 1,580.7 |
Source: Author's calculation (Annex B).
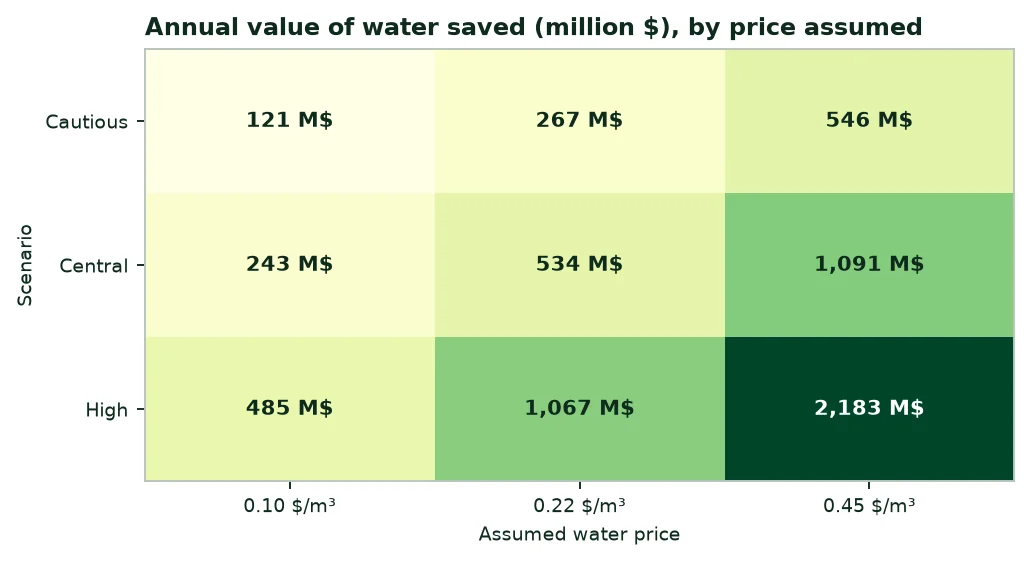
Water saved, extra irrigable hectares and production gain, by scenario
Scenario | Water (Mm³/yr) | Extra hectares | Production (t/yr) |
|---|---|---|---|
Cautious | 1,212.5 | 208,487 | 199,150 |
Central | 2,425.0 | 416,973 | 398,299 |
High | 4,850.1 | 833,947 | 796,599 |
Source: Author's calculation (Annex B).
8.4 Reading the results
9. Potential benefits of our products
The table lists what the products may bring according to the documents available, with their confidence level and their limit.
Potential benefits, by situation
Benefit | Published figures | Source (level) | Limit |
|---|---|---|---|
Irrigation water saving | Date palm −82%; watermelon −60.5%; potato −52%; maize −38.9% | A14 to A18 (B, C) | One trial per crop; none in Saudi Arabia |
Yield | Maize +17.1%; potato +31.4%; watermelon +30%; date palm +20%; soybean +11.2 to +11.4% | A14 to A18 (B, C) | Trials conducted under irrigation or in other climates |
Organic farming (ECOFERT®) | Certified by SOHISCERT and EU Bio | A21 (A) | Valid for the certified product |
Safety: Acrylamide (ECOSORB®) | Below 3.0 µg/g | A19 (B) | One laboratory, one date |
REACH compliance (EVERGREEN®) | ≤ 0.1% of substances of very high concern in 233 substances tested | A20 (B) | Screening, not an approval |
Agroforestry (Paulownia ALTIFOLIA®) | 13 to 15 m in 6 to 8 years (website) | A22 (C) | No trial in Saudi Arabia |
Source: Annex A.
10. External trade: Exports, imports, importing
10.1 Overview, 2023 and 2024
Agricultural products and total merchandise trade (million $)
Indicator | 2023 | 2024 |
|---|---|---|
Agricultural exports (crops and livestock) | 4,983 | 5,719 |
Agricultural imports (crops and livestock) | 27,216 | 29,523 |
Exports, all merchandise | 322,256 | 305,350 |
Imports, all merchandise | 211,028 | 232,028 |
Source: FAOSTAT (A4).
10.2 Exports
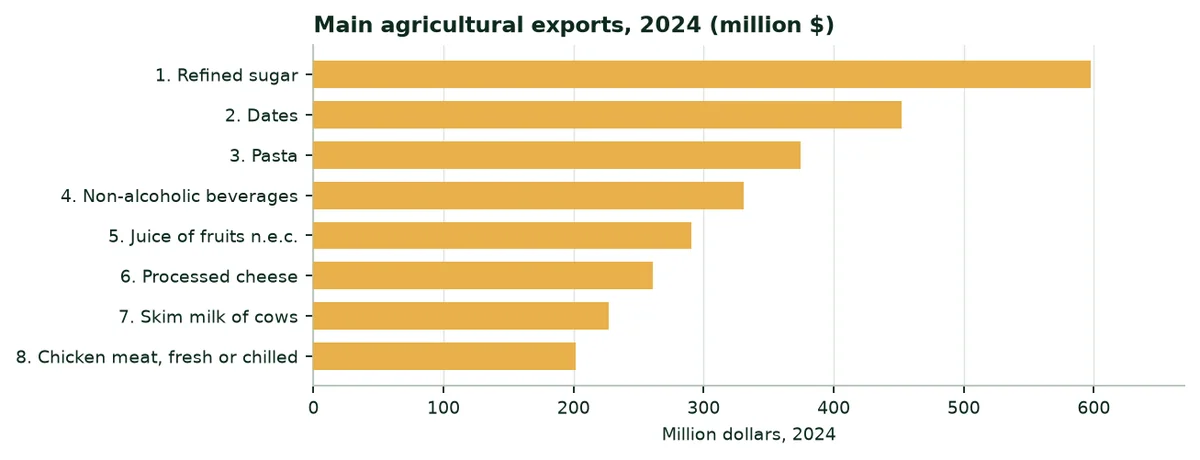
The three main farm products exported in 2024 are: Refined sugar ($598 million), dates ($452 million) and pasta ($374 million).
10.3 Imports
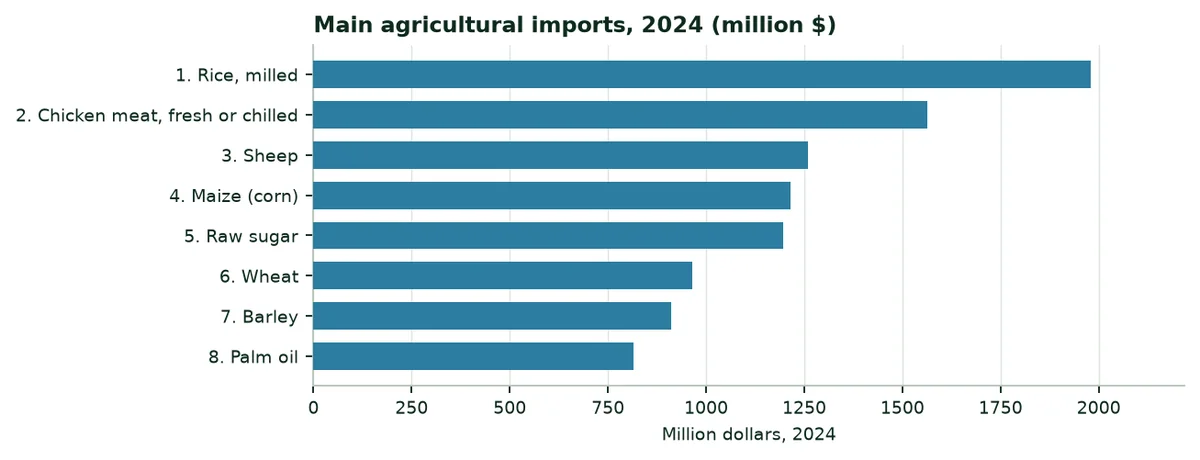
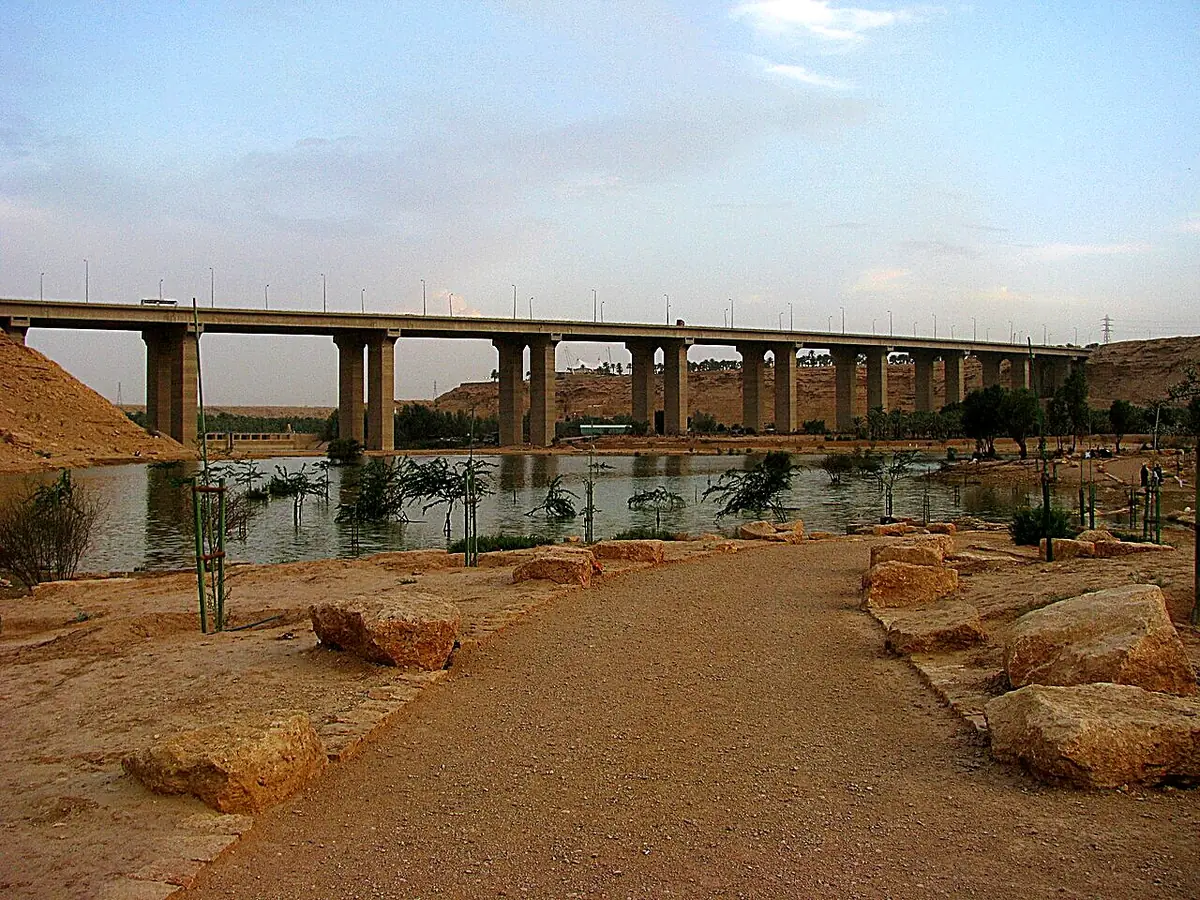
The main farm purchases are: Chicken meat, fresh or chilled ($1,564 million), sheep ($1,260 million) and maize (corn) ($1,214 million). Rice weighs $1,981 million (husked, broken and milled rice): Every tonne grown locally reduces this bill.
 |  |
|---|
10.4 Importing water-retention polymers into Saudi Arabia
11. A study of each region
Each region is described through the city that represents it. The figures describe the climate; the water deficit (evapotranspiration minus rainfall) shows where water is most short. The description of crops is qualitative.
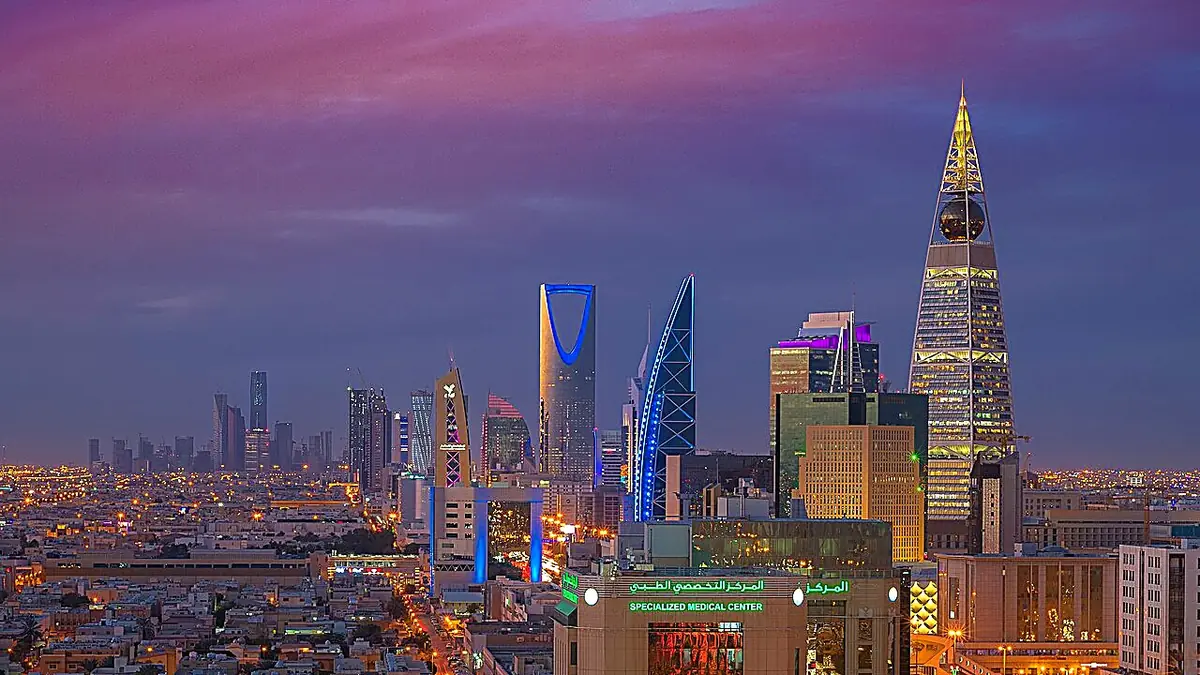
Riyadh (Riyadh)
Central plateau, very hot, with almost no rain: Fodder, dairy farming, date palms and vegetables, irrigated by centre pivots and drip from deep groundwater, notably around Al-Kharj and Wadi ad-Dawasir.
Indicator | Value |
|---|---|
Annual rainfall, 1991-2020 | 34 mm |
Reference evapotranspiration | 2,618 mm |
Annual water deficit | 2,584 mm |
Months with less than 50 mm of rain | 12 |
Global solar radiation | 2,222 kWh/m² |
Mean temperature | 25.8 °C |
Source: NASA POWER (A9); PVGIS (A8); author's calculation.
Makkah (Taif)
Hejaz highlands, cooler than the coast: Fruit (pomegranate, grape, fig), vegetables and roses, on terraces and irrigated orchards.
Indicator | Value |
|---|---|
Annual rainfall, 1991-2020 | 38 mm |
Reference evapotranspiration | 2,401 mm |
Annual water deficit | 2,363 mm |
Months with less than 50 mm of rain | 12 |
Global solar radiation | 2,272 kWh/m² |
Mean temperature | 23.7 °C |
Source: NASA POWER (A9); PVGIS (A8); author's calculation.
Madinah (Madinah)
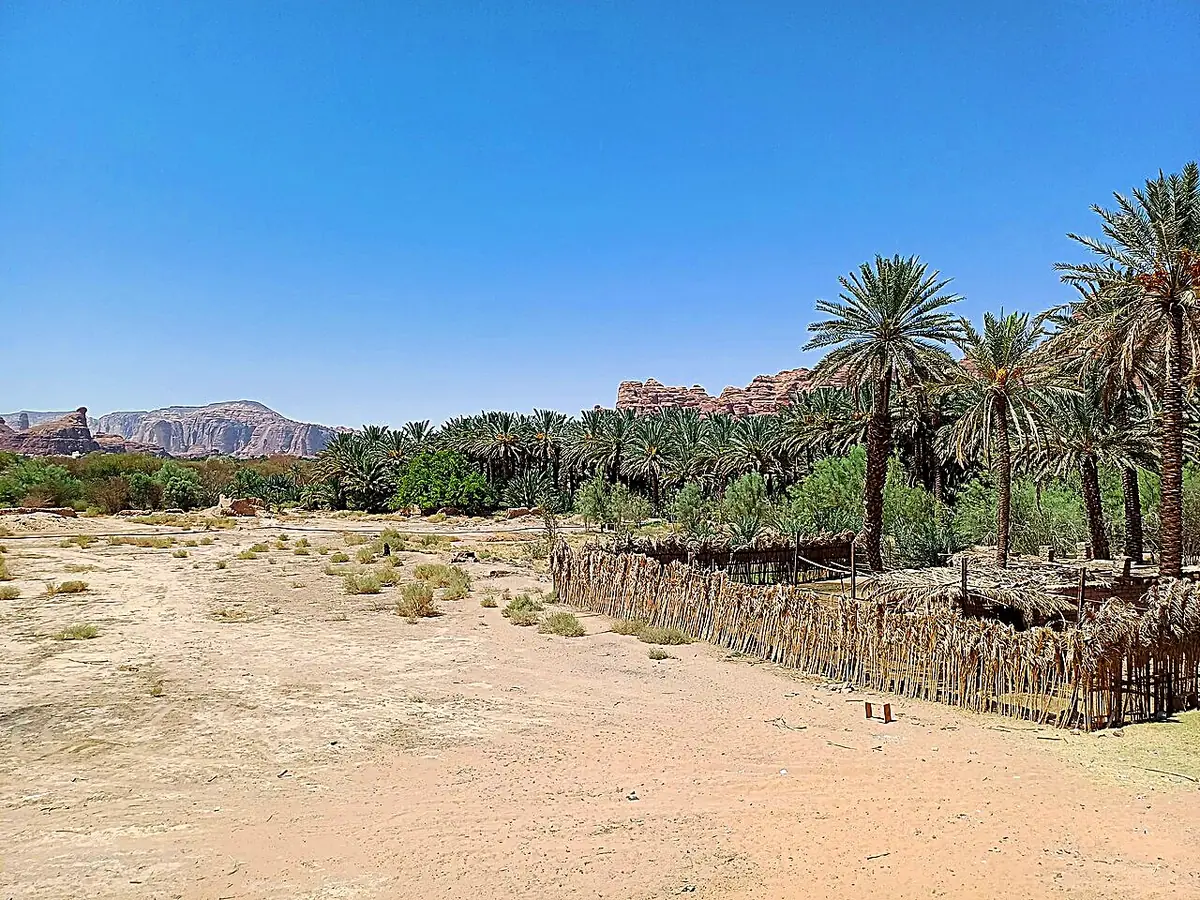
Oases and palm groves: Dates, including the Madinah varieties, vegetables and the crops of the Al-'Ula oasis, on wells and springs.
Indicator | Value |
|---|---|
Annual rainfall, 1991-2020 | 20 mm |
Reference evapotranspiration | 2,772 mm |
Annual water deficit | 2,752 mm |
Months with less than 50 mm of rain | 12 |
Global solar radiation | 2,338 kWh/m² |
Mean temperature | 26.2 °C |
Source: NASA POWER (A9); PVGIS (A8); author's calculation.
Qassim (Buraydah)
A region with the densest palm groves of the centre: Dates, wheat, fodder and vegetables, irrigated from groundwater.
Indicator | Value |
|---|---|
Annual rainfall, 1991-2020 | 34 mm |
Reference evapotranspiration | 2,526 mm |
Annual water deficit | 2,492 mm |
Months with less than 50 mm of rain | 12 |
Global solar radiation | 2,196 kWh/m² |
Mean temperature | 24.6 °C |
Source: NASA POWER (A9); PVGIS (A8); author's calculation.
Eastern Province (Al-Ahsa)
A large date-palm oasis of the east, fed by springs and wells: Dates, vegetables and fodder, in a very hot climate that is humid in summer.
Indicator | Value |
|---|---|
Annual rainfall, 1991-2020 | 40 mm |
Reference evapotranspiration | 2,690 mm |
Annual water deficit | 2,650 mm |
Months with less than 50 mm of rain | 12 |
Global solar radiation | 2,187 kWh/m² |
Mean temperature | 26.8 °C |
Source: NASA POWER (A9); PVGIS (A8); author's calculation.
Asir (Abha)
Asir mountains, with spring and summer rain: Terraced crops, fruit, vegetables, cereals and honey, on slopes where water runs off fast.
Indicator | Value |
|---|---|
Annual rainfall, 1991-2020 | 69 mm |
Reference evapotranspiration | 2,164 mm |
Annual water deficit | 2,095 mm |
Months with less than 50 mm of rain | 12 |
Global solar radiation | 2,180 kWh/m² |
Mean temperature | 25.0 °C |
Source: NASA POWER (A9); PVGIS (A8); author's calculation.
Tabuk (Tabuk)
The north-west, cool winters: Wheat, fodder, fruit trees (apple, pomegranate), dates and greenhouses, irrigated from groundwater.
Indicator | Value |
|---|---|
Annual rainfall, 1991-2020 | 19 mm |
Reference evapotranspiration | 2,181 mm |
Annual water deficit | 2,162 mm |
Months with less than 50 mm of rain | 12 |
Global solar radiation | 2,331 kWh/m² |
Mean temperature | 20.4 °C |
Source: NASA POWER (A9); PVGIS (A8); author's calculation.
Ha'il (Ha'il)
Northern plateau, cold in winter: Wheat, dates, fodder and vegetables, on large centre-pivot schemes.
Indicator | Value |
|---|---|
Annual rainfall, 1991-2020 | 30 mm |
Reference evapotranspiration | 2,391 mm |
Annual water deficit | 2,361 mm |
Months with less than 50 mm of rain | 12 |
Global solar radiation | 2,257 kWh/m² |
Mean temperature | 22.3 °C |
Source: NASA POWER (A9); PVGIS (A8); author's calculation.
Northern Borders (Arar)
Northern border, rare winter rain: Barley, wheat, sheep and camel herding, crops irrigated from boreholes.
Indicator | Value |
|---|---|
Annual rainfall, 1991-2020 | 26 mm |
Reference evapotranspiration | 2,212 mm |
Annual water deficit | 2,186 mm |
Months with less than 50 mm of rain | 12 |
Global solar radiation | 2,163 kWh/m² |
Mean temperature | 21.5 °C |
Source: NASA POWER (A9); PVGIS (A8); author's calculation.
Jazan (Jazan)
Red Sea coastal plain, hot and humid: Mango, banana, papaya, sorghum and vegetables; it is the country's tropical fruit region.
Indicator | Value |
|---|---|
Annual rainfall, 1991-2020 | 171 mm |
Reference evapotranspiration | 2,256 mm |
Annual water deficit | 2,085 mm |
Months with less than 50 mm of rain | 12 |
Global solar radiation | 2,219 kWh/m² |
Mean temperature | 30.6 °C |
Source: NASA POWER (A9); PVGIS (A8); author's calculation.
Najran (Najran)
Southern valley, at the foot of the mountains: Dates, pomegranate, grape, wheat and vegetables, irrigated from wells.
Indicator | Value |
|---|---|
Annual rainfall, 1991-2020 | 25 mm |
Reference evapotranspiration | 2,551 mm |
Annual water deficit | 2,526 mm |
Months with less than 50 mm of rain | 12 |
Global solar radiation | 2,391 kWh/m² |
Mean temperature | 24.5 °C |
Source: NASA POWER (A9); PVGIS (A8); author's calculation.
Al Baha (Al Baha)
South-western mountains: Terraced crops, fig, pomegranate, honey and vegetables, on small farms.
Indicator | Value |
|---|---|
Annual rainfall, 1991-2020 | 59 mm |
Reference evapotranspiration | 2,378 mm |
Annual water deficit | 2,319 mm |
Months with less than 50 mm of rain | 12 |
Global solar radiation | 2,116 kWh/m² |
Mean temperature | 26.6 °C |
Source: NASA POWER (A9); PVGIS (A8); author's calculation.
Al Jawf (Sakaka)
The north, desert and irrigated crops: Olive trees, wheat, dates and fodder, on large centre-pivot schemes, with a large groundwater resource.
Indicator | Value |
|---|---|
Annual rainfall, 1991-2020 | 29 mm |
Reference evapotranspiration | 2,238 mm |
Annual water deficit | 2,209 mm |
Months with less than 50 mm of rain | 12 |
Global solar radiation | 2,220 kWh/m² |
Mean temperature | 21.0 °C |
Source: NASA POWER (A9); PVGIS (A8); author's calculation.
Annex A. Sources and confidence levels
Ref. | Source | Level |
|---|---|---|
A1 | World Bank, World Development Indicators (WDI), Saudi Arabia | A |
A2 | FAOSTAT, crops and livestock (QCL), areas, production, 2014-2024 | A |
A3 | FAOSTAT, value of production (QV), constant 2014-2016 I$, 2019-2024 | A |
A4 | FAOSTAT, trade in crops and livestock products, 2018-2024 | A |
A5 | FAOSTAT, mineral fertilisers, agricultural use, production and imports, 2005-2023 | A |
A6 | FAOSTAT, land use, areas equipped for irrigation, organic farming | A |
A7 | World Bank, Pink Sheet (world prices of urea, DAP, TSP and potassium chloride) | A |
A8 | PVGIS (European Commission Joint Research Centre), radiation, 2005-2020 | B |
A9 | NASA POWER (NASA Langley Research Center), daily data: Rainfall, temperature, humidity, wind and radiation, 1981-2024; reference evapotranspiration calculated by the author with FAO-56 (Penman-Monteith) | B |
A10 | Natural Earth, first-level administrative boundaries and country outline | B |
A11 | Suhail M. et al., "Issues of Water Resources in Saudi Arabia: Past, Present, and Future", Sustainability, 2024, 16(10), 4189: Share of non-renewable resources in the water supply | B |
A12 | US Department of Commerce (International Trade Administration), country commercial guide, Saudi Arabia, import tariffs: Gulf Cooperation Council common external tariff of at least 5% on most goods, VAT at 15% since July 2020 | B |
A13 | Guide to chemical customs codes in Saudi Arabia (Palm Horizon KSA): Registration of fertilisers with the Ministry of Environment, Water and Agriculture | C |
A14 | Soybean trial, China (yield), manufacturer's website | C |
A15 | Date palm trial, UAE (ICBA, 2021), manufacturer's website | B |
A16 | Watermelon trial, Mexico (2023), manufacturer's website | C |
A17 | Potato trial, South Africa (2025), manufacturer's website | C |
A18 | Maize trial, Türkiye (TIGEM, Konya, 2025), manufacturer's website | B |
A19 | ECOSORB® acrylamide analysis (Polymex laboratory, 2024) | B |
A20 | EVERGREEN® REACH / SVHC screening (SGS, 2023) | B |
A21 | ECOFERT® certificate (SOHISCERT, EU Bio) | A |
A22 | Paulownia ALTIFOLIA® sheet figures (website) | C |
Annex B. Calculation method
1. Agricultural water. Total withdrawals (23,380 Mm³, 2022) × agricultural share (81.56%) = 19,069.6 Mm³.
2. Irrigation. The equipped area (3,278,920 ha) and agricultural water are shared between irrigated groups (date palm, wheat and barley, watermelon and melon, potato, vegetables, olive tree, citrus, other fruit, maize and other irrigated land) in proportion to their harvested areas (3,278,920 ha), without exceeding each group's harvested area. Our sources have no irrigation statistic by crop. Other crops are treated as rainfed and receive no irrigation water in the calculation. The equipped area exceeds the harvested area of the irrigable crops retained: The difference forms an "other irrigated land" group (lucerne and other fodder), with the generic assumption. Sorghum, millet and other cereals are treated as rainfed.
3. Scenarios. Water saved = group water × trial effect: A quarter (cautious), half (central), all of it (high). Without a trial: 5, 10 and 20%.
4. Extra hectares. Water saved ÷ water per equipped hectare (5,816 m³/ha).
6. Value of water. Three assumed prices (0.10; 0.22 and 0.45 $/m³); no national tariff was adopted.
7. Fertilisers. Minimum spending = nitrogen ÷ 0.46 × urea price + phosphate ÷ 0.46 × TSP price + potash ÷ 0.60 × potassium chloride price (A7).
8. Climate. Rainfall, reference evapotranspiration (FAO-56) and temperature: 1991-2020 means of the NASA POWER grid cell containing each city; radiation: PVGIS, 2005-2020. Temperature trends are linear regressions over 1981-2024. NASA POWER combines reanalyses and satellite data on a grid of about 50 km: Two nearby cities can share the same cell, and its rainfall can differ from local station records. On the maps, each region is coloured according to the value of its reference town.
9. Trade. Totals are those of the FAOSTAT crops and livestock line; products are listed one by one, without aggregates. Rice amounts add husked rice, broken rice and milled rice.
Annex C. Photo credits
File (Wikimedia Commons) | Author | Licence |
|---|---|---|
Al-'Ula oasis (8).jpg | Radosław Botev | CC BY 3.0 pl |
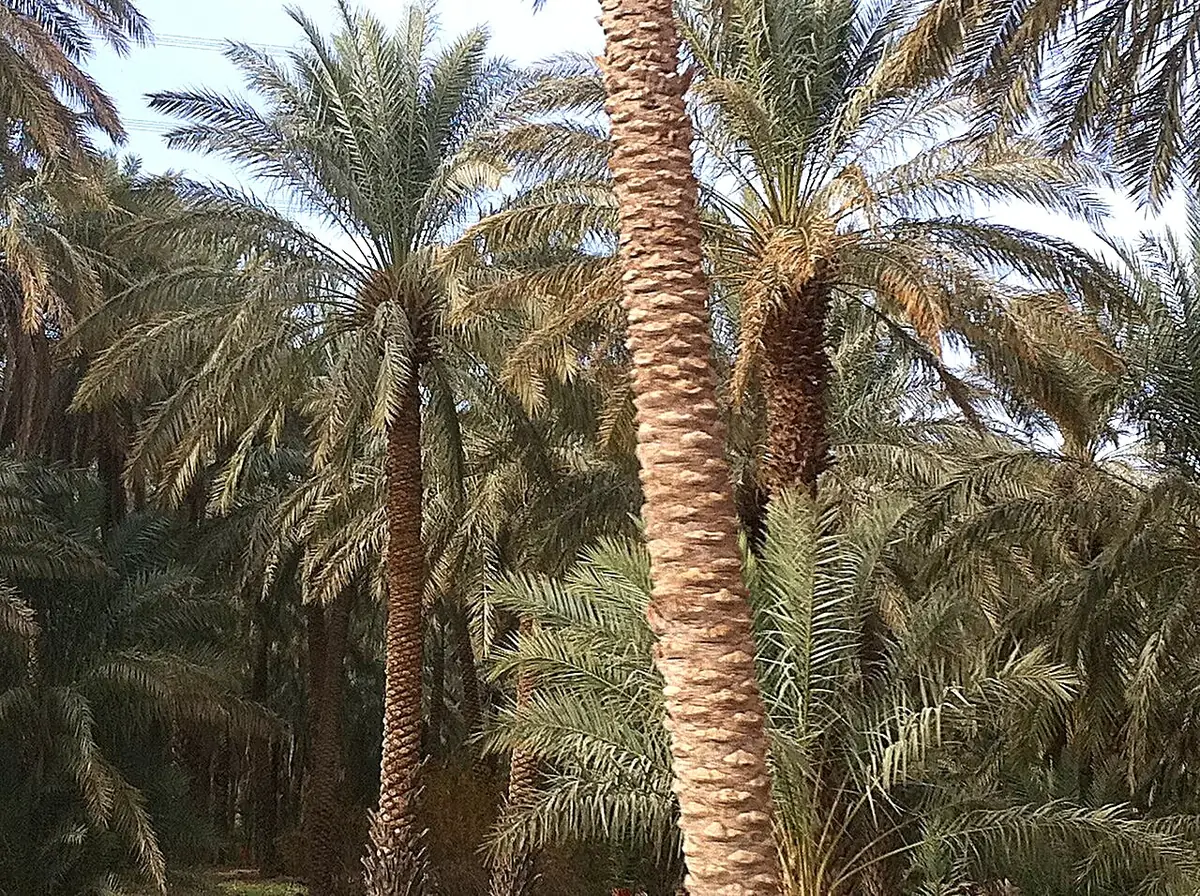
Palm Trees in Saudi Arabia.JPG | Haitham alfalah | CC BY 3.0 |
Bees Thrive on Berry Farm in Saudi Arabia's Aseer Region (2025).jpg | Saudi Press Agency (SPA) | CC BY-SA 4.0 |
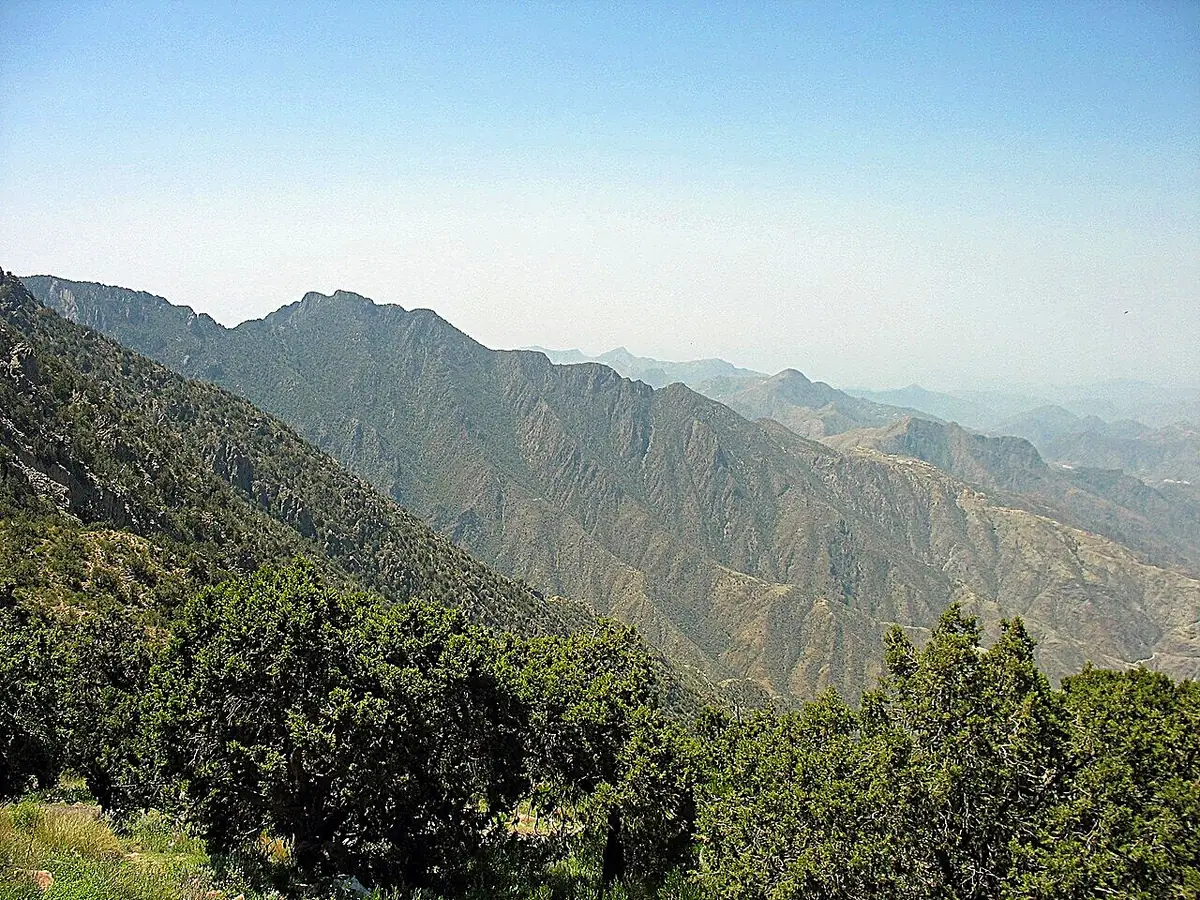
Al Sawda peak.jpg | Marviikad | CC BY-SA 2.0 |
Dam reservoir 3 - panoramio.jpg | Juhotski | CC BY-SA 3.0 |
زراعة الطماطم.jpg | الاءحكمي | CC BY 4.0 |
Circular irrigations in Al Jawf Region, Saudi Arabia.jpg | Axelspace Corporation | CC BY-SA 4.0 |
Al-'Ula oasis (1).jpg | Radosław Botev | CC BY 3.0 pl |
Wadi Hanifa.jpg | Ahmedpictures12 | CC BY-SA 4.0 |
Tomy Aitkins Mango ( Low Sugar Mangoes)..JPG | Abagchi77 | CC BY-SA 3.0 |
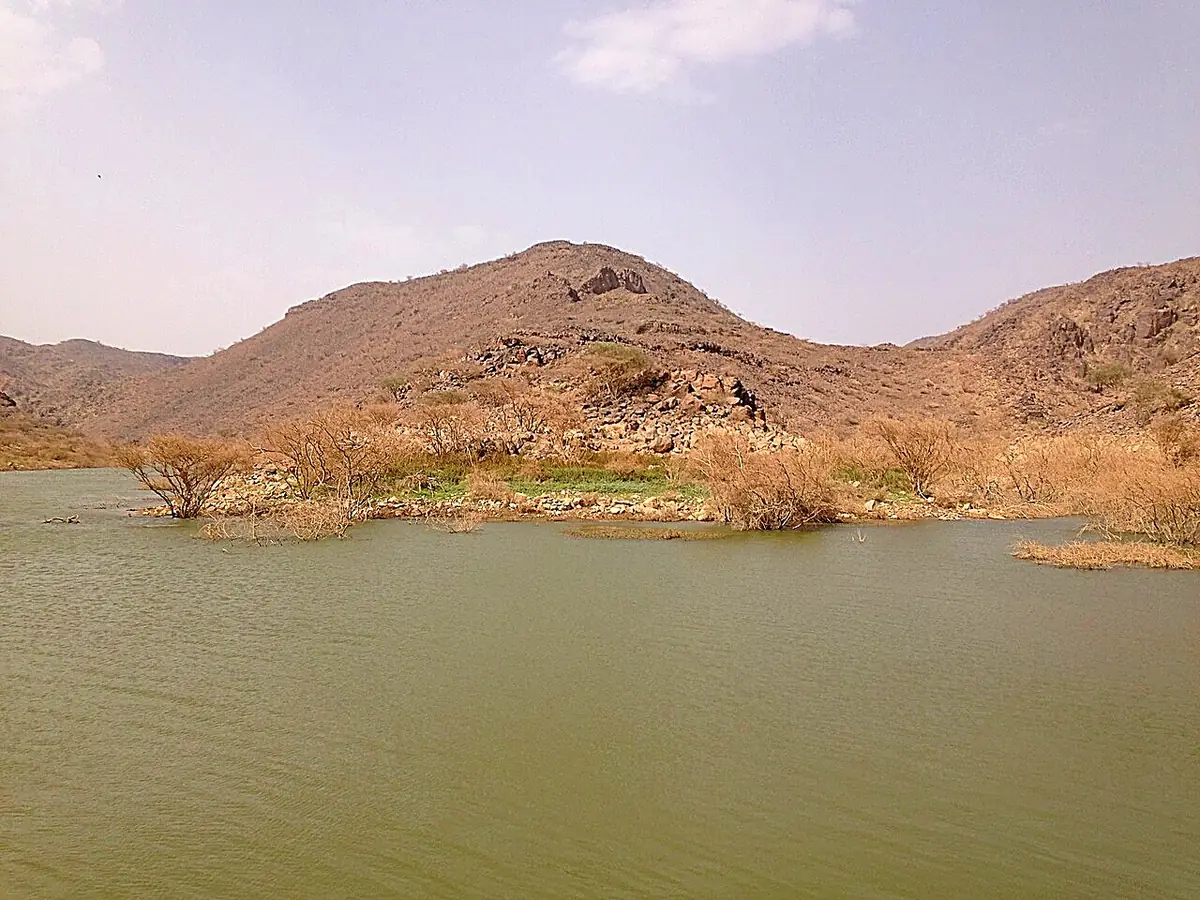
Lake at Wadi Hanifah (5218227168).jpg | Peter Dowley from Dubai, United Arab Emirates | CC BY 2.0 |
Riyadh Skyline.jpg | B.alotaby | CC BY-SA 4.0 |
Al-'Ula oasis (10).jpg | Radosław Botev | CC BY 3.0 pl |
Source: Photos published on Wikimedia Commons, colour-adjusted and sharpened, used under their licence.
 |  Green Solutions contact@green-solutions-group.com green-solutions-group.com |
|---|
أخبرنا عن أرضك
المحصول، وأسلوب الري، وطبيعة التربة، وحجم الماء المستهلك اليوم. نعود إليكم بالتركيبة المناسبة من التقنيات، والجرعات، والتجارب التي أُجريت في ظروف مشابهة.
التواصل الأول لا يُلزم بشيء.
أخبرنا عن أرضكcontact@green-solutions-group.com · Green Solutions Groupe AIM SA, 46, route de la Condémine, 1475 Forel, Switzerland
اعتمادات الصور
- Green Solutions / OpenAI — Illustration conceptuelle, septembre 2026, « Oliveraie irriguée — concept Al-Jawf »
الصور المفاهيمية مذكورة بوضوح ولا توثّق موقعاً أو تجربة حقيقية.